Opentelemetry Collector로 Native Histogram Metrics 수집하기
개요
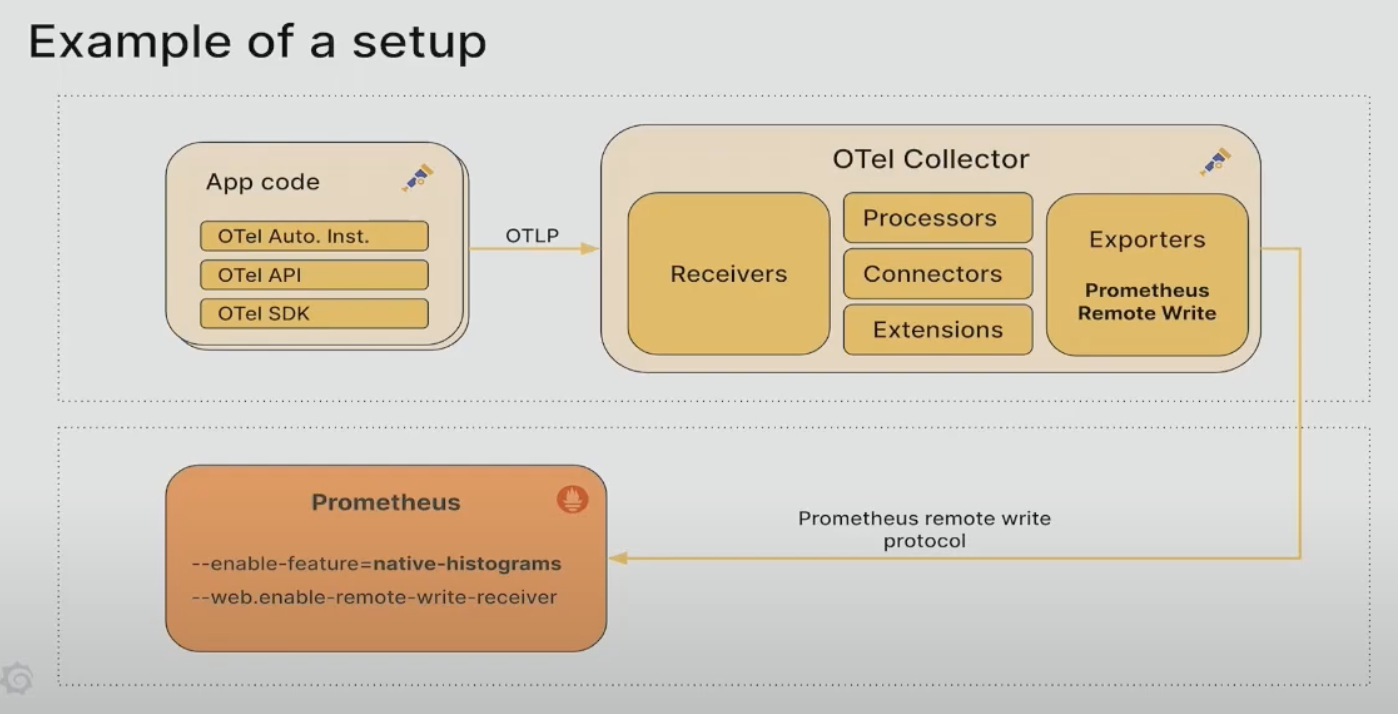
해당 글에서는 otel collector로 수집한 span 데이터를 spanmetrics 커넥터를 이용해 metrics 데이터로 변환하여, Prometheus에서 Native Histogram으로 수집하는 방법을 예시를 제공합니다
대략적인 그림은 아래와 같습니다 - reference의 youtube 화면 사용
reference 및 git repo 링크
- github : https://github.com/kyeongjun-dev/otel-collector-native-histogram
- youtube : https://www.youtube.com/watch?v=W2_TpDcess8&t=1182s
- go clinet를 이용한 Native Histogram 데이터 수집 참고 : https://velog.io/@kyeongjun-dev/Prometheus%EC%97%90%EC%84%9C-Native-Histogram-%EC%82%AC%EC%9A%A9%ED%95%98%EA%B8%B0
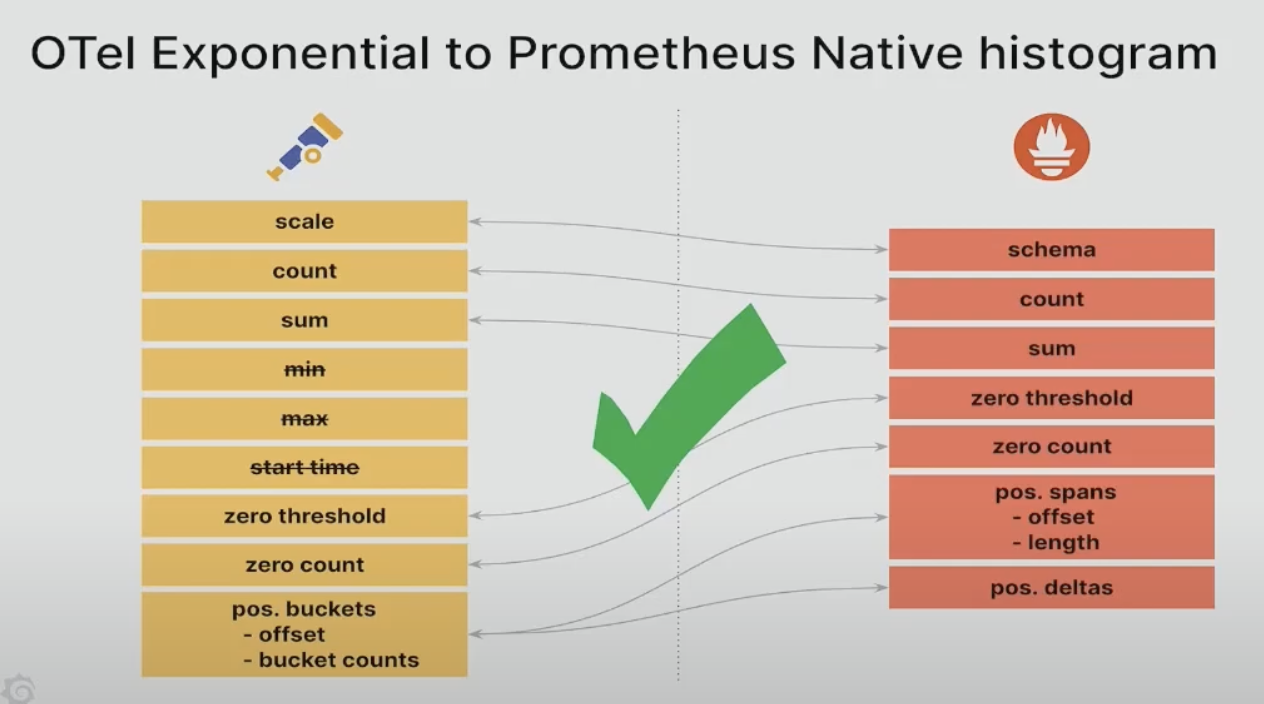
Opentelemetry Exponential 히스토그램과 Prometheus Native 히스토그램
reference의 youtube를 확인해보면 otel의 exponential 히스토그램과 prometheus의 native 히스토그램이 어떻게 호환되는지 확인할 수 있습니다
유의사항
별도의 설명이 없는 경우, 모든 command는 github repo를 clone한 뒤, 루트 디렉토리에서 실행하는것을 기본으로 합니다
git clone https://github.com/kyeongjun-dev/otel-collector-native-histogram.git
cd otel-collector-native-histogram
예시 springboot 앱 준비
github repo를 클론하여 아래 명령어로 도커 이미지를 빌드합니다
docker build -t springboot:local ./springboot또는 도커허브에 올라가있는 이미지를 사용해도 됩니다
docker pull kyeongjundev/springboot:39e2e243b5ddd14f47c35a91f00c068aef13b6abtempo 설치
grafana namespace에 tempo를 설치합니다
kubectl create ns grafana
helm install tempo charts/tempo -f values/tempo.yaml -n grafana
otel collector 설치
기본 사항만 설정한opentelemetry-collector-basic.yaml 파일로 otel collector를 monitoring namespace에 설치합니다
helm install opentelemetry-collector charts/opentelemetry-collector -f values/opentelemetry-collector-basic.yaml -n monitoringgrafana 설치
grafana namespace에 grafana를 설치합니다
helm install grafana charts/grafana -f values/grafana.yaml -n grafana기본 values.yaml 파일에서 수정한 부분은 아래와 같습니다
- 브라우저 접속을 쉽게 하기위해서 30001
NodePort로 변경 - 기본 admin 계정 패스워드를 admin으로 변경
- tempo를 data source로 추가 (grafana에 접속해서 별도로 추가하는 것도 가능)
diff charts/grafana/values.yaml values/grafana.yaml
231c231
<   type: ClusterIP
---
>   type: NodePort
240a241
>   nodePort: 30001
483c484
< # adminPassword: strongpassword
---
> adminPassword: admin
655c656,664
< datasources: {}
---
> datasources:
>   datasources.yaml:
>     apiVersion: 1
>     datasources:
>     - name: Tempo
>       type: tempo
>       access: proxy
>       url: http://tempo.grafana.svc.cluster.local:3100
>       basicAuth: false
springboot 앱 배포 및 trace 수집 확인
springboot namespace에 springboot 앱을 배포합니다
kubectl create ns springboot
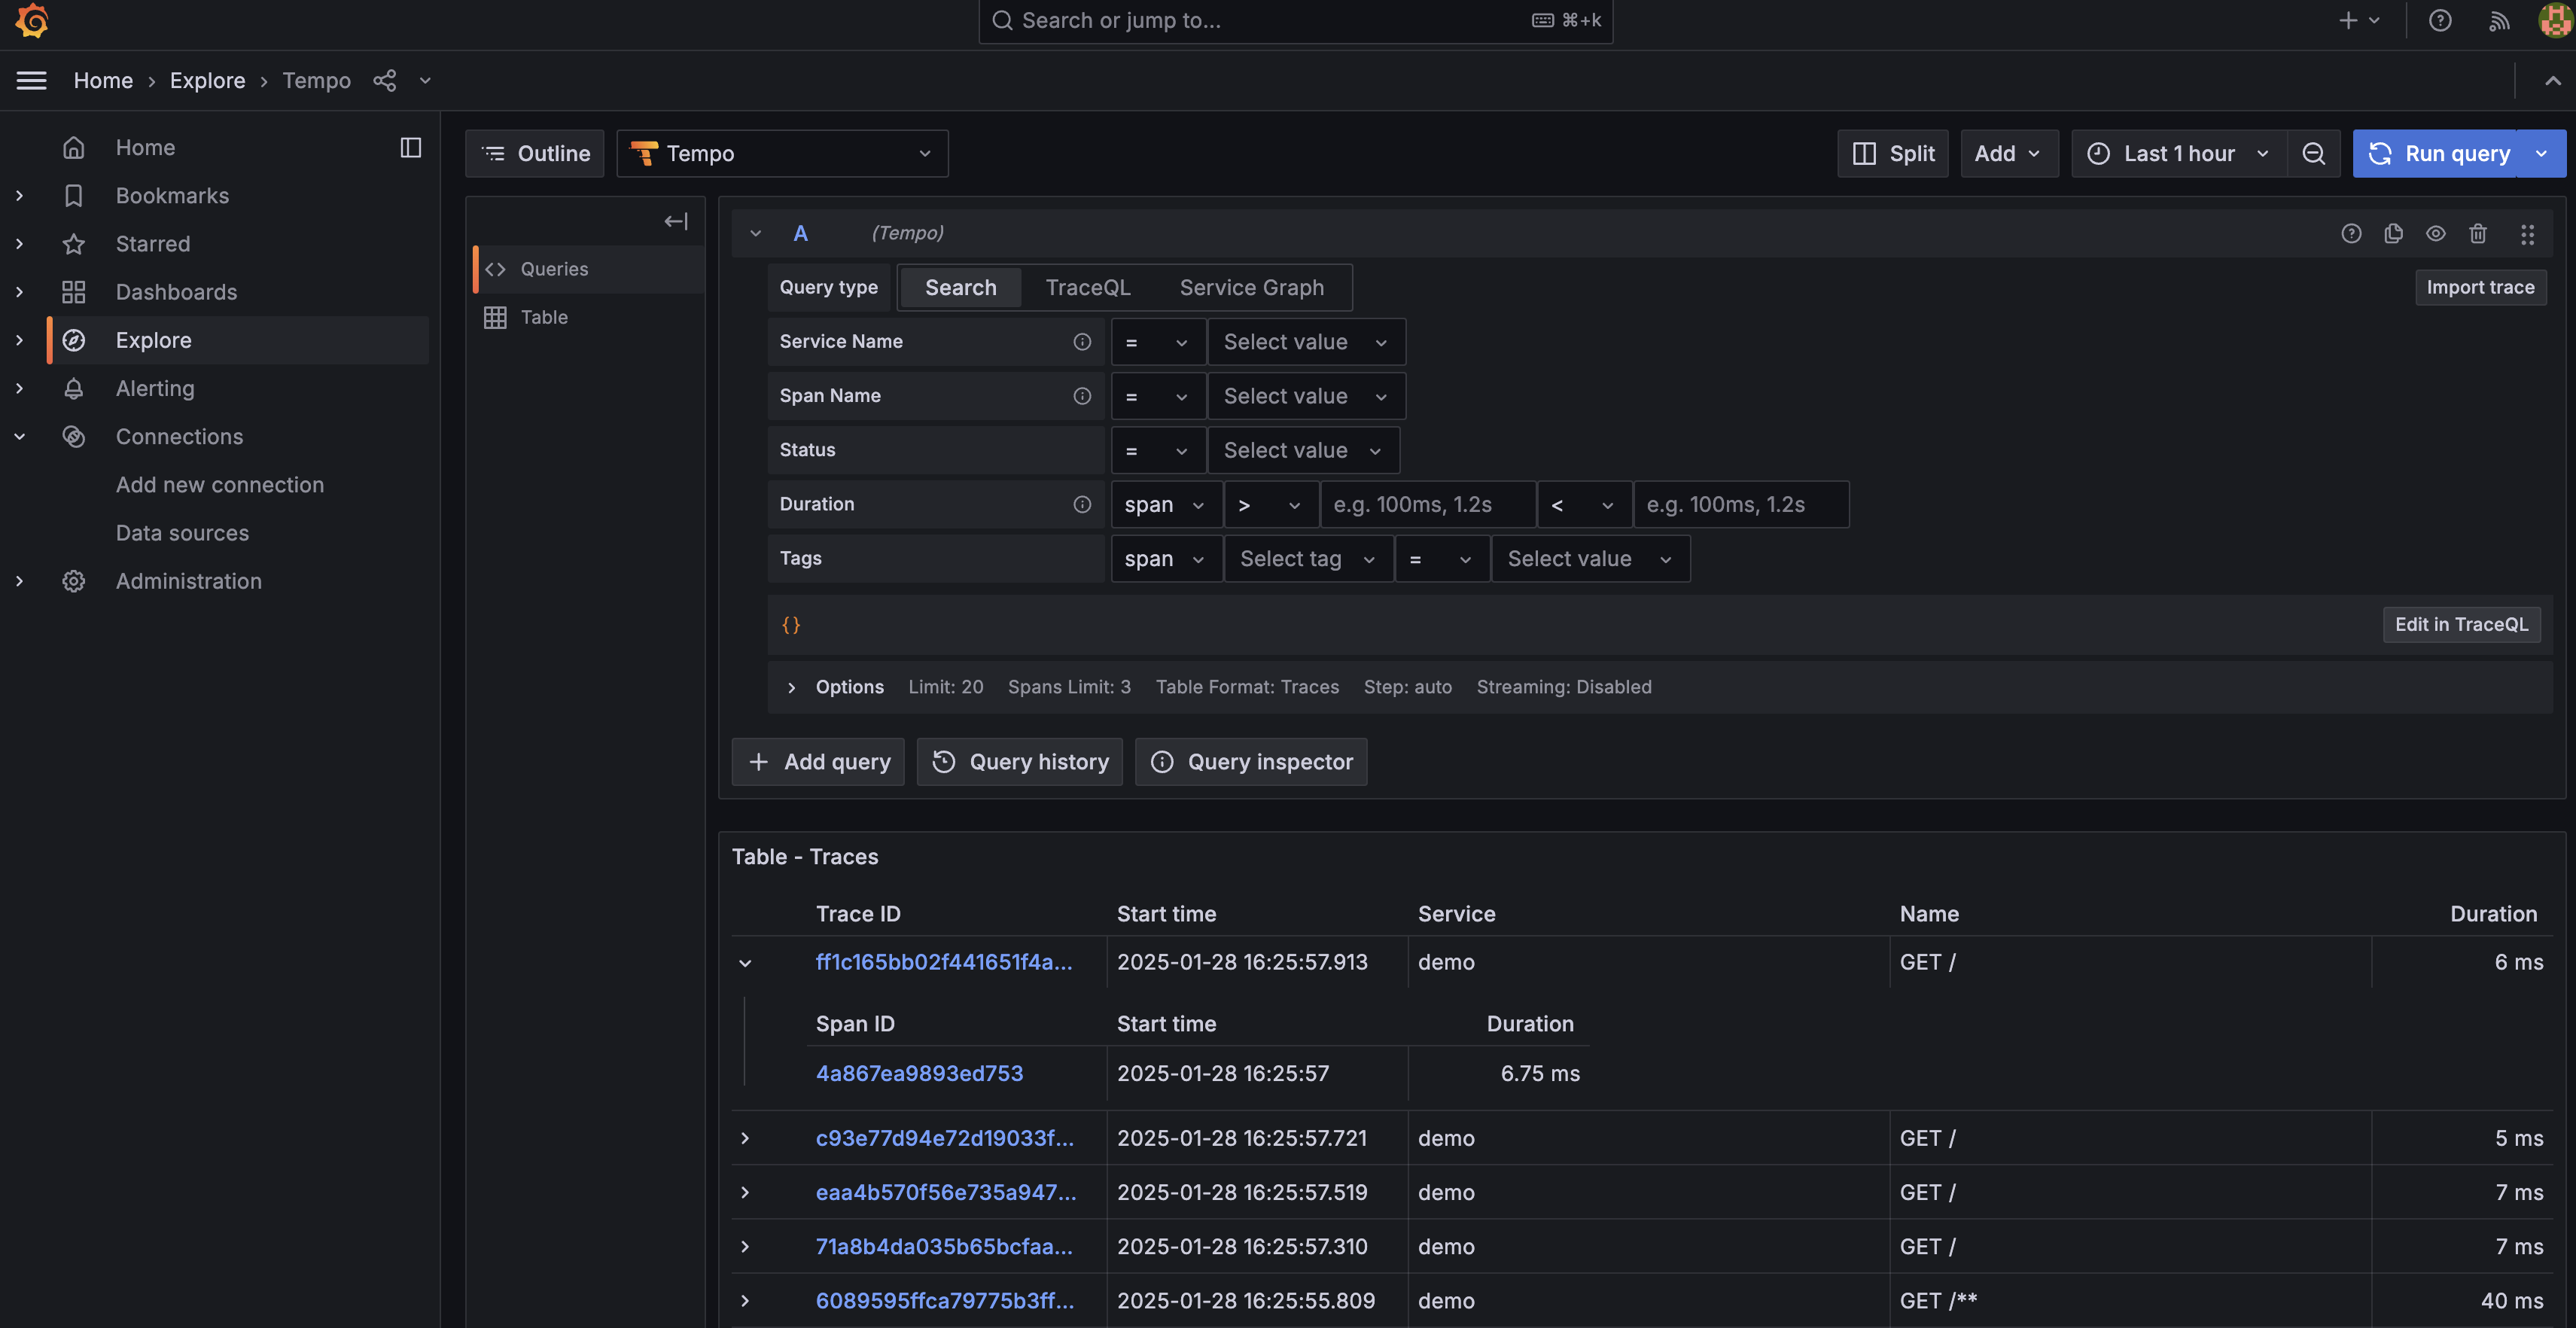
kubectl apply -f springboot/springboot-k8s-otel.yaml -n springboothttp://localhost:30008 url로 curl이나 브라우저에서 접속 후, grafana에서 trace가 수집되는 것을 확인합니다
Prometheus 설치
otel collector에서 trace를 metrics로 변환한 후, metrics 데이터를 전송할 Prometheus를 prometheus namespace에 설치합니다
kubectl create ns prometheus
helm install kube-prometheus-stack charts/kube-prometheus-stack -f values/kube-prometheus-stack.yaml -n prometheus
기본 values.yaml 파일에서 수정한 부분은 아래와 같습니다
- prometheus만 설치되도록
prometheusOperator,prometheus만 enable - 접속을 원할하게 하기 위해 30090
NodePort로 변경 - Native Histogram을 사용하기 위해
enableFeatures에서 기능 - otel collector에서 데이터를 push할 수 있도록
enableRemoteWriteReceiver기능 활성화
crds:
  enabled: true

defaultRules:
  create: false

global:
  rbac:
    create: true

windowsMonitoring:
  enabled: false

prometheus-windows-exporter:
  prometheus:
    monitor:
      enabled: false

alertmanager:
  enabled: false

grafana:
  enabled: false

kubernetesServiceMonitors:
  enabled: false

kubeApiServer:
  enabled: false

kubelet:
  enabled: false

kubeControllerManager:
  enabled: false

coreDns:
  enabled: false

kubeDns:
  enabled: false

kubeEtcd:
  enabled: false

kubeScheduler:
  enabled: false

kubeProxy:
  enabled: false

kubeStateMetrics:
  enabled: false

nodeExporter:
  enabled: false

prometheusOperator:
  enabled: true

prometheus:
  enabled: true
  service:
    type: NodePort
    nodePort: 30090
    targetPort: 9090
    port: 9090
  agentMode: false
  prometheusSpec:
    externalLabels: {}
    enableRemoteWriteReceiver: true
    enableFeatures:
    - native-histograms
otel collector로 metrics 데이터 전송
otel collector 설치에 사용한 values를 다르게 하여 재배포 합니다 - spanmetrics/exponential connector 사용
helm upgrade opentelemetry-collector charts/opentelemetry-collector -f values/opentelemetry-collector-native-histogram.yaml -n monitoring지속적으로 어플리케이션을 call하는 스크립트를 실행시킵니다
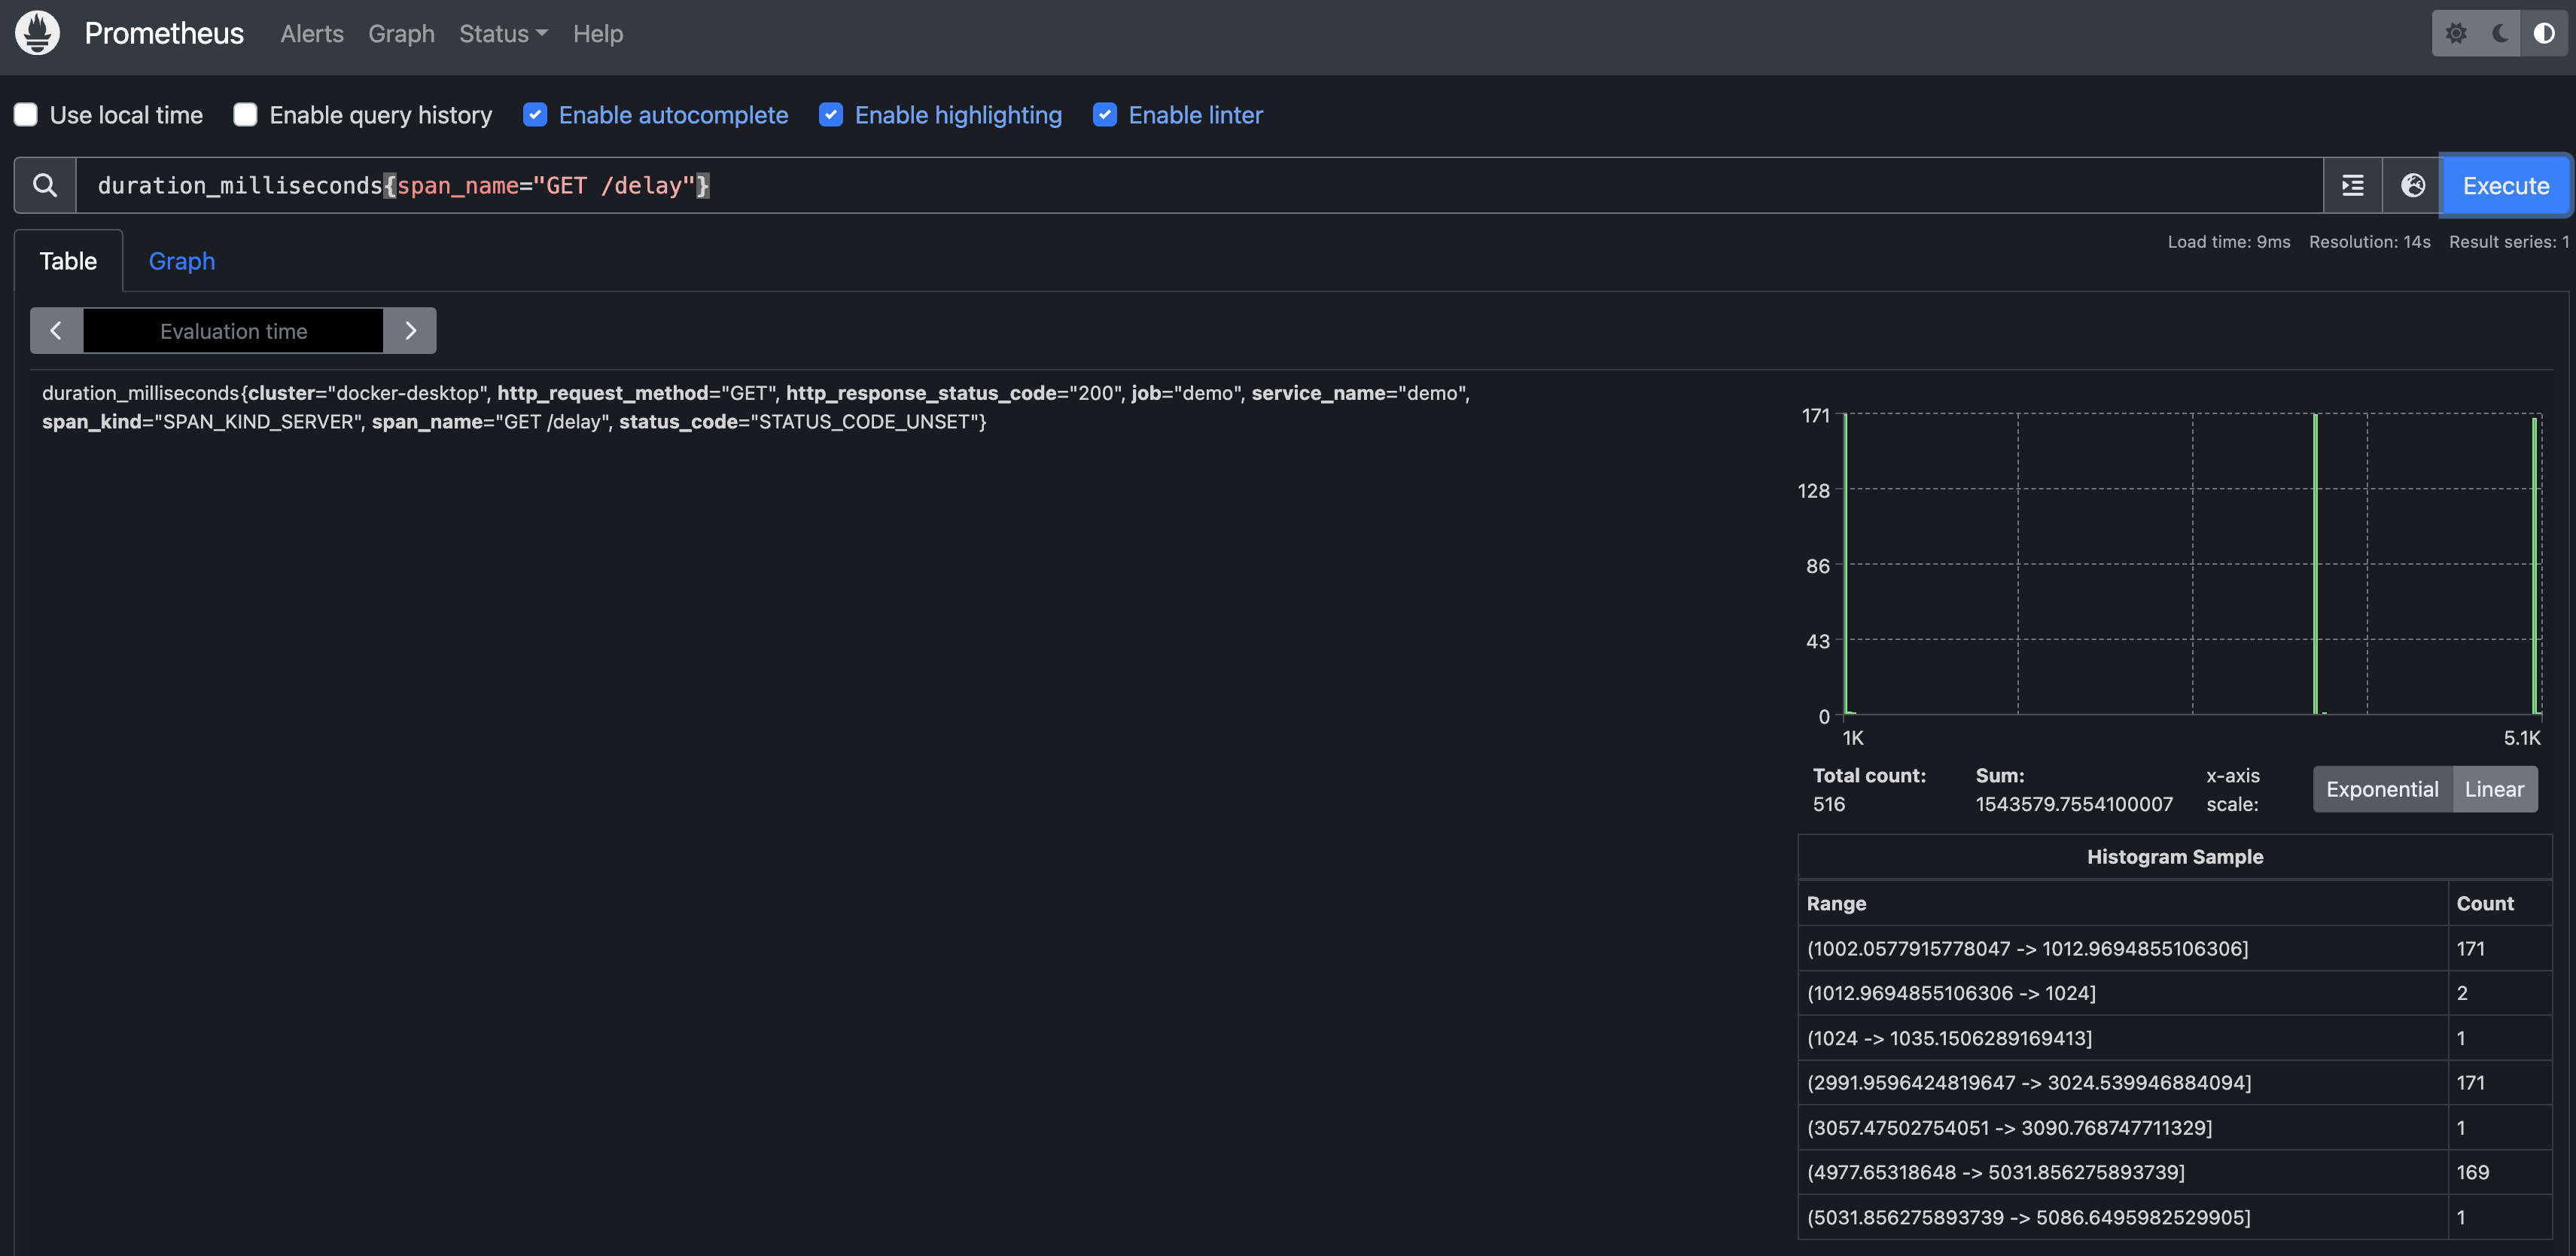
sh curl-springboot-delay.shhttp://localhost:30090 url로 prometheus에 접속후, duration_milliseconds{span_name="GET /delay"}를 검색합니다
- 위에서 실행한
curl-springboot-delay.sh가/delay로 지속적으로 요청을 보냅니다