tempo-cli 사용해보기
참고사이트
- tempo cli 사용법 docs : https://grafana.com/docs/tempo/latest/operations/tempo_cli/
- tempo cli 바이너리 파일 다운로드하는 release 페이지 : https://github.com/grafana/tempo/releases/
개요
tempo에서 크기가 큰 trace를 검색하면, max_bytes_per_trace 크기를 초과하는 경우 trace exceeds max size에러로 검색이 불가능합니다
무작정 max_bytes_per_trace를 올리는 것보다는 적절하게 값을 조정해주는게 좋기에 trace 크기를 tempo-cli를 이용해 확인합니다
설치 및 trace id 확인
https://github.com/kyeongjun-dev/monitoring/tree/feat/docker-compose_tempo-cli/example/docker-compose-springboot-native-histogram-local_tempo-cli
repo를 clone하고 위 디렉토리로 이동 후, docker-compose up -d 명령어를 실행한 뒤에 루트디렉토리로 이동하여 sh curl-springboot-delay.sh 8080로 springboot 앱에 trace를 발생시킵니다
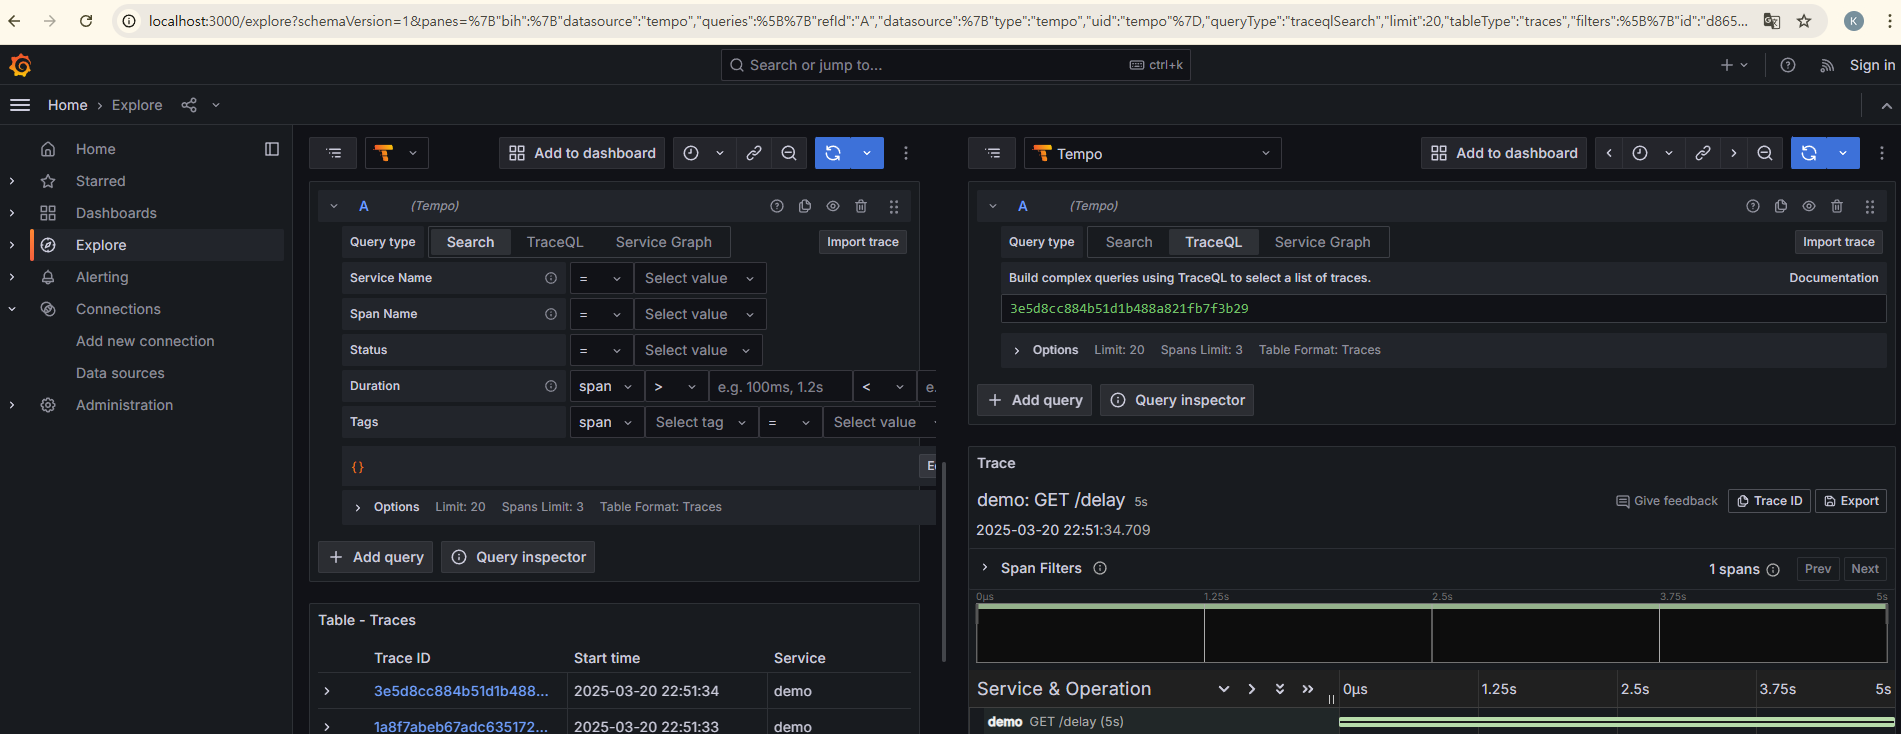
localhost:3000 그라파나로 접속하여 trace id를 임의로 확인합니다 (여기서는 3e5d8cc884b51d1b488a821fb7f3b29 사용)
tempo-cli 실행
docker-compose up -d 명령어를 수행한 디렉토리에서 아래 아래 사진에 표시된 (1)번과 같이 tempo-data 디렉토리를 확인할 수 있습니다
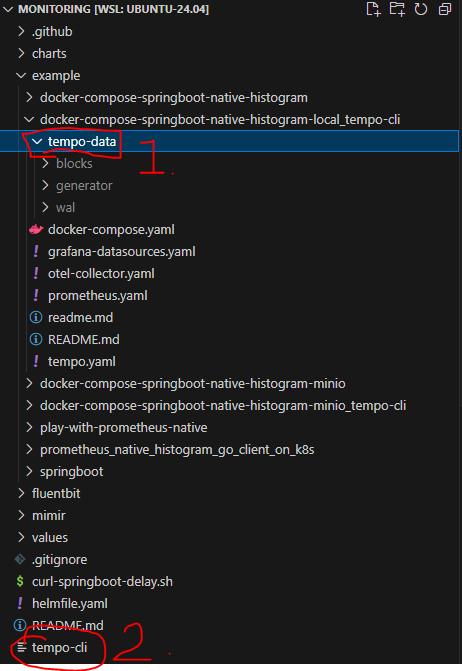
clone한 root 디렉토리에 tempo-cli 파일이 있는데, 해당 파일(amd64)을 이용하여 tempo-cli를 실행할 수 있습니다
arm 등 arch가 맞지 않는겨우, tempo github의 release 페이지에서 알맞은 tar 파일을 받아서 압축을 해제하면,
tempo-cli파일이 들어있습니다
https://github.com/grafana/tempo/releases/tag/v2.7.1
./tempo-cli query trace-summary 3e5d8cc884b51d1b488a821fb7f3b29 single-tenant --backend=local --bucket=./example/docker-compose-springboot-native-histogram-local_tempo-cli/tempo-data/blocks/루트 디렉토리를 기준으로 ./tempo-cli query trace-summary 명령어를 실행합니다
- 325d~ : trace id
- single-tenant :
tempo-data/blocks/single-tenant디렉토리 이름 - backend : local (local, s3, gcs 등 설정 가능)
- bucket : 검색할 디렉토리 위치
실행결과는 아래와 같습니다 : 탐색한 block 개수, trace에 포함된 Span 개수, trcace 크기 등
total blocks to search:  8
....0....Number of blocks: 2
Span count: 2
Trace size: 2944 B
Trace duration: 5 seconds
Root service name: demo
Root span info:
(*v1.Span)(0xc0004864b0)({
 TraceId: ([]uint8) (len=16 cap=16) {
  00000000  03 e5 d8 cc 88 4b 51 d1  b4 88 a8 21 fb 7f 3b 29  |.....KQ....!..;)|
 },
 SpanId: ([]uint8) (len=8 cap=8) {
  00000000  5d df c3 c6 d7 de f2 f2                           |].......|
 },
 TraceState: (string) "",
 ParentSpanId: ([]uint8) {
 },
 Flags: (uint32) 0,
 Name: (string) (len=10) "GET /delay",
 Kind: (v1.Span_SpanKind) 2,
 StartTimeUnixNano: (uint64) 1742478694709420660,
 EndTimeUnixNano: (uint64) 1742478699710892523,
 Attributes: ([]*v1.KeyValue) (len=15 cap=16) {
  (*v1.KeyValue)(0xc00079d4d0)({
   Key: (string) (len=10) "http.route",
   Value: (*v1.AnyValue)(0xc000893650)({
    Value: (*v1.AnyValue_StringValue)(0xc000893660)({
     StringValue: (string) (len=6) "/delay"
    })
   })
  }),
(생략)
DroppedAttributesCount: (uint32) 0,
 Events: ([]*v1.Span_Event) <nil>,
 DroppedEventsCount: (uint32) 0,
 Links: ([]*v1.Span_Link) <nil>,
 DroppedLinksCount: (uint32) 0,
 Status: (*v1.Status)(0xc00079d650)({
  Message: (string) "",
  Code: (v1.Status_StatusCode) 0
 })
})
top frequent service.names:
[demo    ]
마치며
https://grafana.com/docs/tempo/latest/operations/tempo_cli/
위 링크를 참고하면 다양한 tempo-cli 기능을 확인할 수 있습니다
s3에 tempo 데이터가 저장되는 경우, 옵션만 다르게하여 검색이 가능합니다
(minio를 docker-compose로 구성해서 tempo cli를 사용하면, server gave HTTP response to HTTPS client 에러가 발생하는데, tempo cli 자체가 https로 요청을 보내서 그런것으로 생각되지만 보통은 s3에 저장을 할 것이기에... 깊이 파보지는 않았습니다)
