MySQL + mysqld-exporter 구성하기
쿠버네티스 환경에서 MySQL을 모니터링하려면
Prometheus가 읽을 수 있는 형태의 메트릭을 노출해야 한다.
MySQL 자체는 메트릭을 제공하지 않기 때문에
mysqld-exporter를 추가로 배포해야 한다.
이번 글에서는 다음 두 가지를 배포한다.
MySQL Deployment + Service
mysqld-exporter Deployment + Service
그리고 마지막에 Prometheus UI에서 메트릭이 잘 수집되는지 확인한다.
1. MySQL 배포하기
파일명: mysql.yaml
apiVersion: apps/v1
kind: Deployment
metadata:
  name: mysql
  namespace: monitoring
  labels:
    app: mysql
spec:
  replicas: 1
  selector:
    matchLabels:
      app: mysql
  template:
    metadata:
      labels:
        app: mysql
    spec:
      containers:
      - name: mysql
        image: mysql:8.0.30
        env:
        - name: MYSQL_ROOT_PASSWORD
          value: "root"
        ports:
        - containerPort: 3306
---
apiVersion: v1
kind: Service
metadata:
  name: mysql
  namespace: monitoring
  labels:
    app: mysql
spec:
  type: ClusterIP
  selector:
    app: mysql
  ports:
   - name: mysql
     port: 3306
     targetPort: 3306
2. mysqld-exporter 배포하기
파일명: mysqld-exporter.yaml
apiVersion: apps/v1
kind: Deployment
metadata:
  name: mysqld-exporter
  namespace: monitoring
  labels:
    app: mysqld-exporter
spec:
  replicas: 1
  selector:
    matchLabels:
      app: mysqld-exporter
  template:
    metadata:
      labels:
        app: mysqld-exporter
    spec:
      containers:
      - name: mysqld-exporter
        image: prom/mysqld-exporter:v0.14.0
        ports:
        - containerPort: 9104
        env:
        - name: DATA_SOURCE_NAME
          value: "root:root@(mysql.monitoring.svc.cluster.local:3306)/"
---
apiVersion: v1
kind: Service
metadata:
  name: mysqld-exporter
  namespace: monitoring
  labels:
    app: mysqld-exporter
spec:
  selector:
    app: mysqld-exporter
  ports:
   - port: 9104
     targetPort: 9104
     name: metrics
설명
- Prometheus가 수집할 수 있도록 annotations 포함
- MySQL에 root 계정으로 접근하도록 설정
→ DATA_SOURCE_NAME="root:root@(mysql.default.svc.cluster.local:3306)/"
Prometheus는 이 Exporter의 /metrics endpoint를 수집해
MySQL 상태를 모니터링할 수 있다.
4. 배포
kubectl apply -f mysql.yaml
kubectl apply -f mysqld-exporter.yaml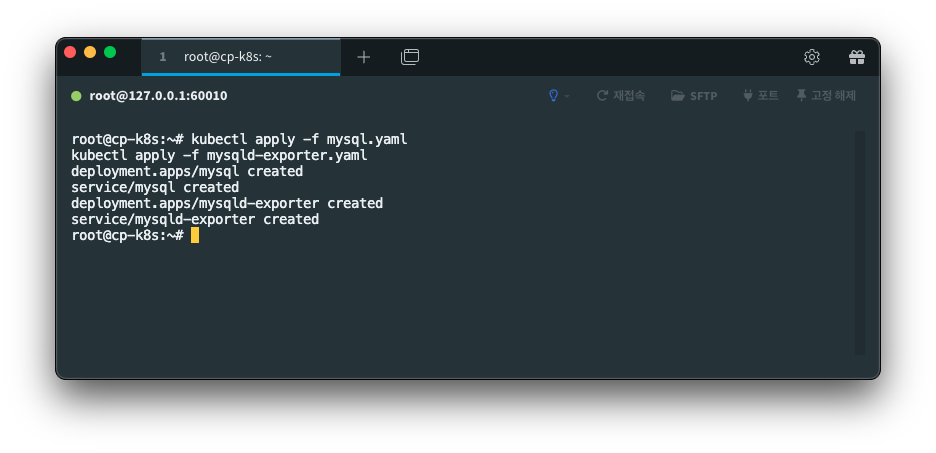
5. Prometheus UI에서 확인
Prometheus → Status → Targets 메뉴에서
scrape 항목에 다음이 떠야 한다.
- mysqld-exporter (UP)
이렇게 뜨면 MySQL 메트릭이 정상적으로 수집되는 것이다.
또한 Query 입력창에서 예를 들어:
mysql_global_status_threads_connected같은 메트릭을 조회할 수 있다.
근데 안 뜬다. 왜 ?
6. 🚫 mysqld-exporter가 Target에 안 뜨는 이유 (+ mysqld-exporter ServiceMonitor 생성)
Prometheus Operator(kube-prometheus-stack)를 사용하면,
기본 prometheus.io/scrape=true 어노테이션은 무시된다.
즉, 아무리 Service에 아래처럼 적어도:
annotations:
  prometheus.io/scrape: "true"
Prometheus Operator는 이를 보지 않는다.
왜냐하면 Prometheus Operator는 ServiceMonitor / PodMonitor 리소스를 통해서만
"어떤 Service를 스크랩할지" 결정하기 때문이다.
그래서 mysqld-exporter가 Target에 안 뜨는 이유
mysqld-exporter Service는 존재한다.
하지만 Prometheus에게 “이 서비스를 스크랩해라” 라고 알려주는 객체가 없다.
그 역할을 하는 것이 바로 ServiceMonitor 이다.
ServiceMonitor가 없으면 Prometheus는 mysqld-exporter를 인식하지 못한다.
즉,
mysqld-exporter → 있는데
Prometheus → 존재 자체를 모름 → Target에 안 뜸
이 흐름이다.
그래서 Target에서도, Graph에서도 찾을 수 없던 것이다.
해결 방법: ServiceMonitor 생성
mysqld-exporter를 Prometheus Target에 등록하려면
반드시 아래 같은 ServiceMonitor가 필요하다.
파일명 : mysqld-exporter-servicemonitor.yaml
kind: ServiceMonitor
metadata:
  name: mysqld-exporter
  namespace: monitoring
  labels:
    release: kube-prom-stack
spec:
  selector:
    matchLabels:
      app: mysqld-exporter
  namespaceSelector:
    matchNames:
      - monitoring
  endpoints:
  - port: metrics
    interval: 15s
위 파일을 적용해준다.
그래서 ServiceMonitor를 적용하면:
- Target 목록에 mysqld-exporter가 나타나고
- PromQL 자동완성에도 mysq 관련 메트릭이 뜨고
- 그래프 조회가 가능해진다
ServiceMonitor에서의 핵심
ServiceMonitor YAML에서 핵심은 딱 두 가지이다:
1) kind: ServiceMonitor
→ “이 서비스를 Prometheus가 스크랩 대상(Target)으로 등록하라”는 선언
즉, Prometheus Operator에게:
“이 서비스의 /metrics 엔드포인트를 읽어라.”
라고 공식적으로 알려주는 역할이다.
2) selector.matchLabels
→ “어떤 Service를 스크랩할지” 지정하는 부분
Prometheus는 ServiceMonitor가 어떤 서비스(app=xxx)를 바라보고 있는지를 보고
해당 서비스의 엔드포인트를 스크랩한다.
그래서 ServiceMonitor 파일의 핵심은 아래 두 줄로 요약된다:
kind: ServiceMonitor  ← 스크랩 대상 선언
selector.matchLabels  ← 어떤 서비스인지 지정
Redis와 다른 점 (이전 게시물에서는 왜 ServiceMonitor이 없어도 떴을까?)
이전 게시물 : Redis Exporter에서 Ridis는 다음과 같이 만들었다.
- Deployment (redis)
- Service (redis)
- Deployment (redis-exporter)
- Service (redis-exporter)
- ServiceMonitor (redis-exporter) ← 이미 있었음.
즉, Redis Exporter는 처음부터 ServiceMonitor를 같이 배포했기 때문에
Prometheus Operator가 정상적으로 Target에 등록할 수 있었다.
Redis는 이미 ServiceMonitor가 있었다.
redis-exporter.yaml을 다시 보면 맨 마지막에 ServiceMonitor가 포함되어 있다.
apiVersion: monitoring.coreos.com/v1
kind: ServiceMonitor
metadata:
  name: redis-exporter
  namespace: monitoring
  labels:
    release: kube-prom-stack
spec:
  selector:
    matchLabels:
      app: redis-exporter
  namespaceSelector:
    matchNames:
      - monitoring
  endpoints:
  - port: metrics
    interval: 15s
이게 있었기 때문에 Redis Exporter는
Prometheus Operator가 Target에 자동 반영했다.
그래서 여기에서도 ServiceMonitor을 배포해주어야 스크랩 대상이라고 인식할 수 있다.
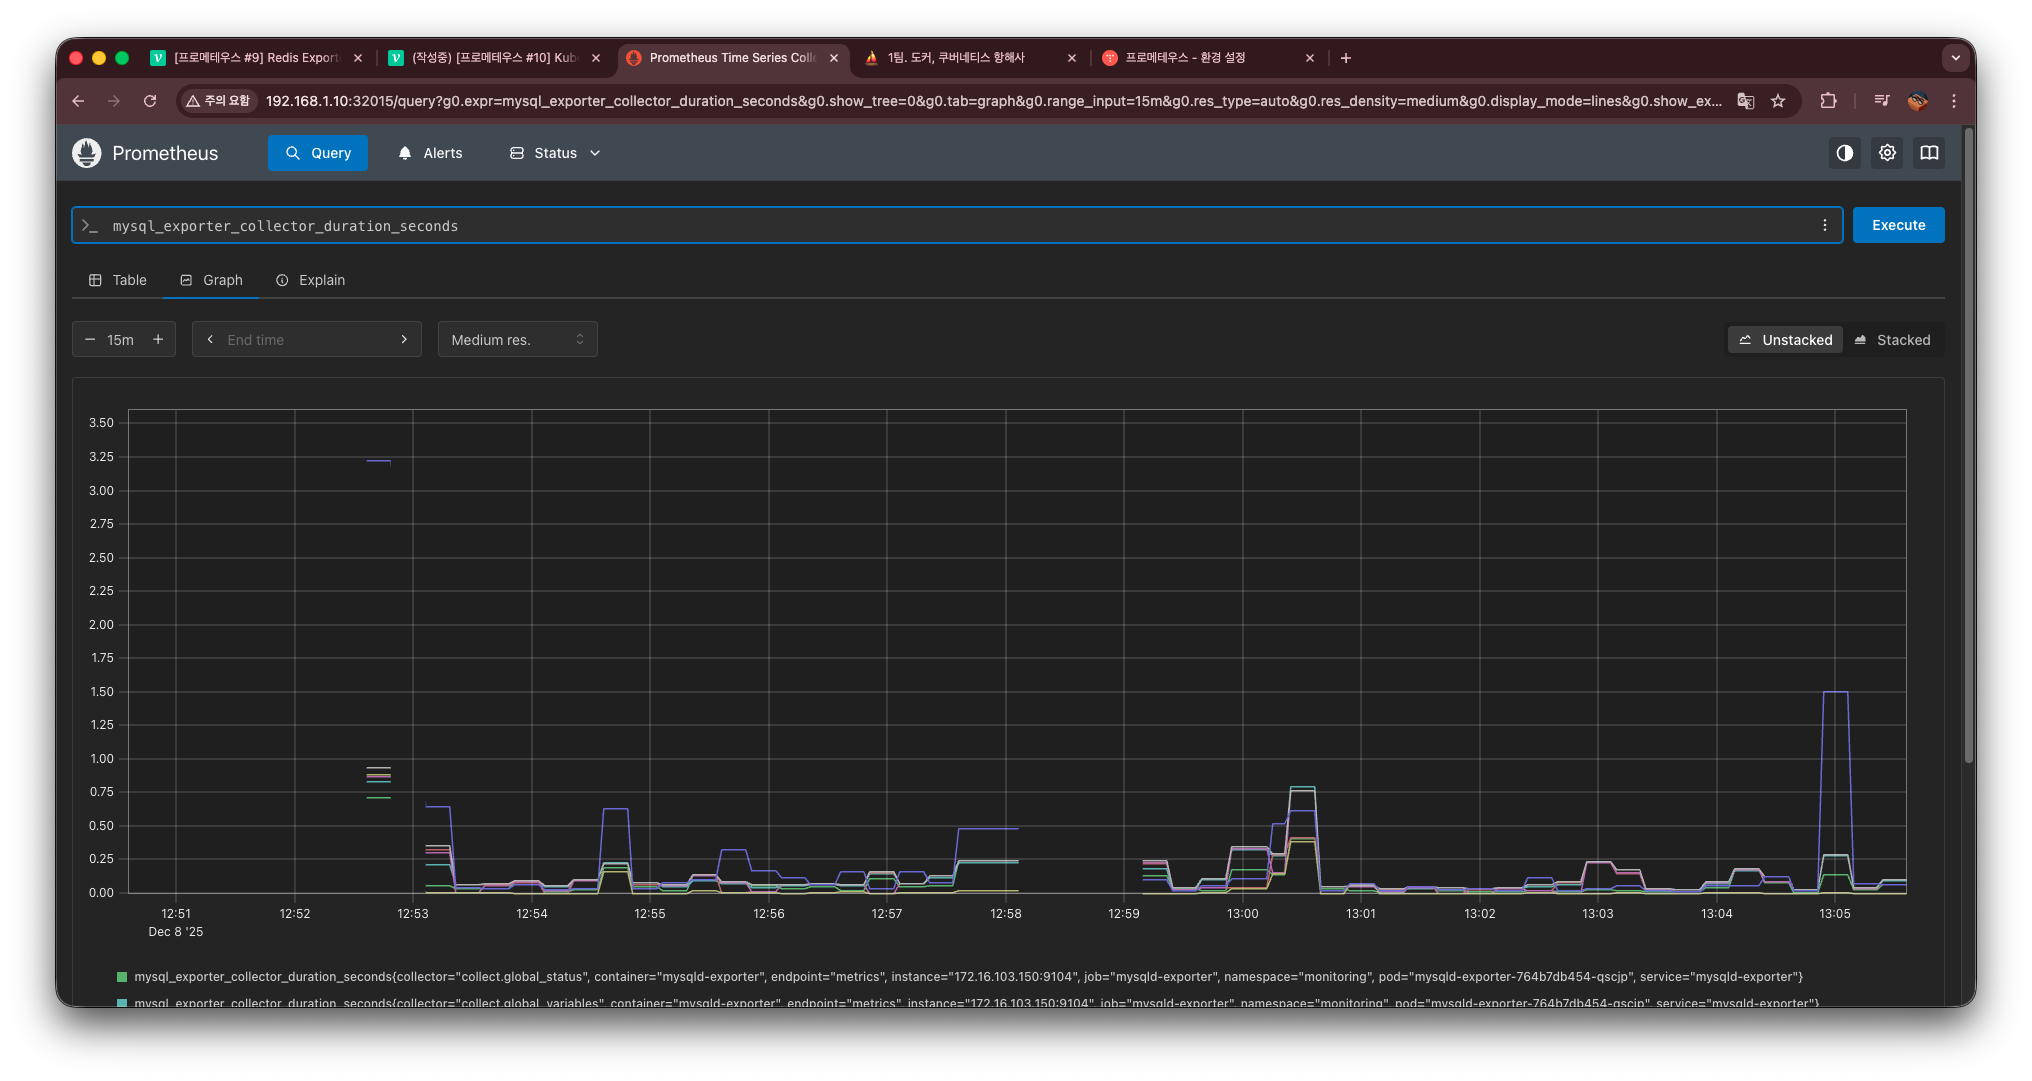
7. 프로메테우스 UI 확인 (Target, Graph)
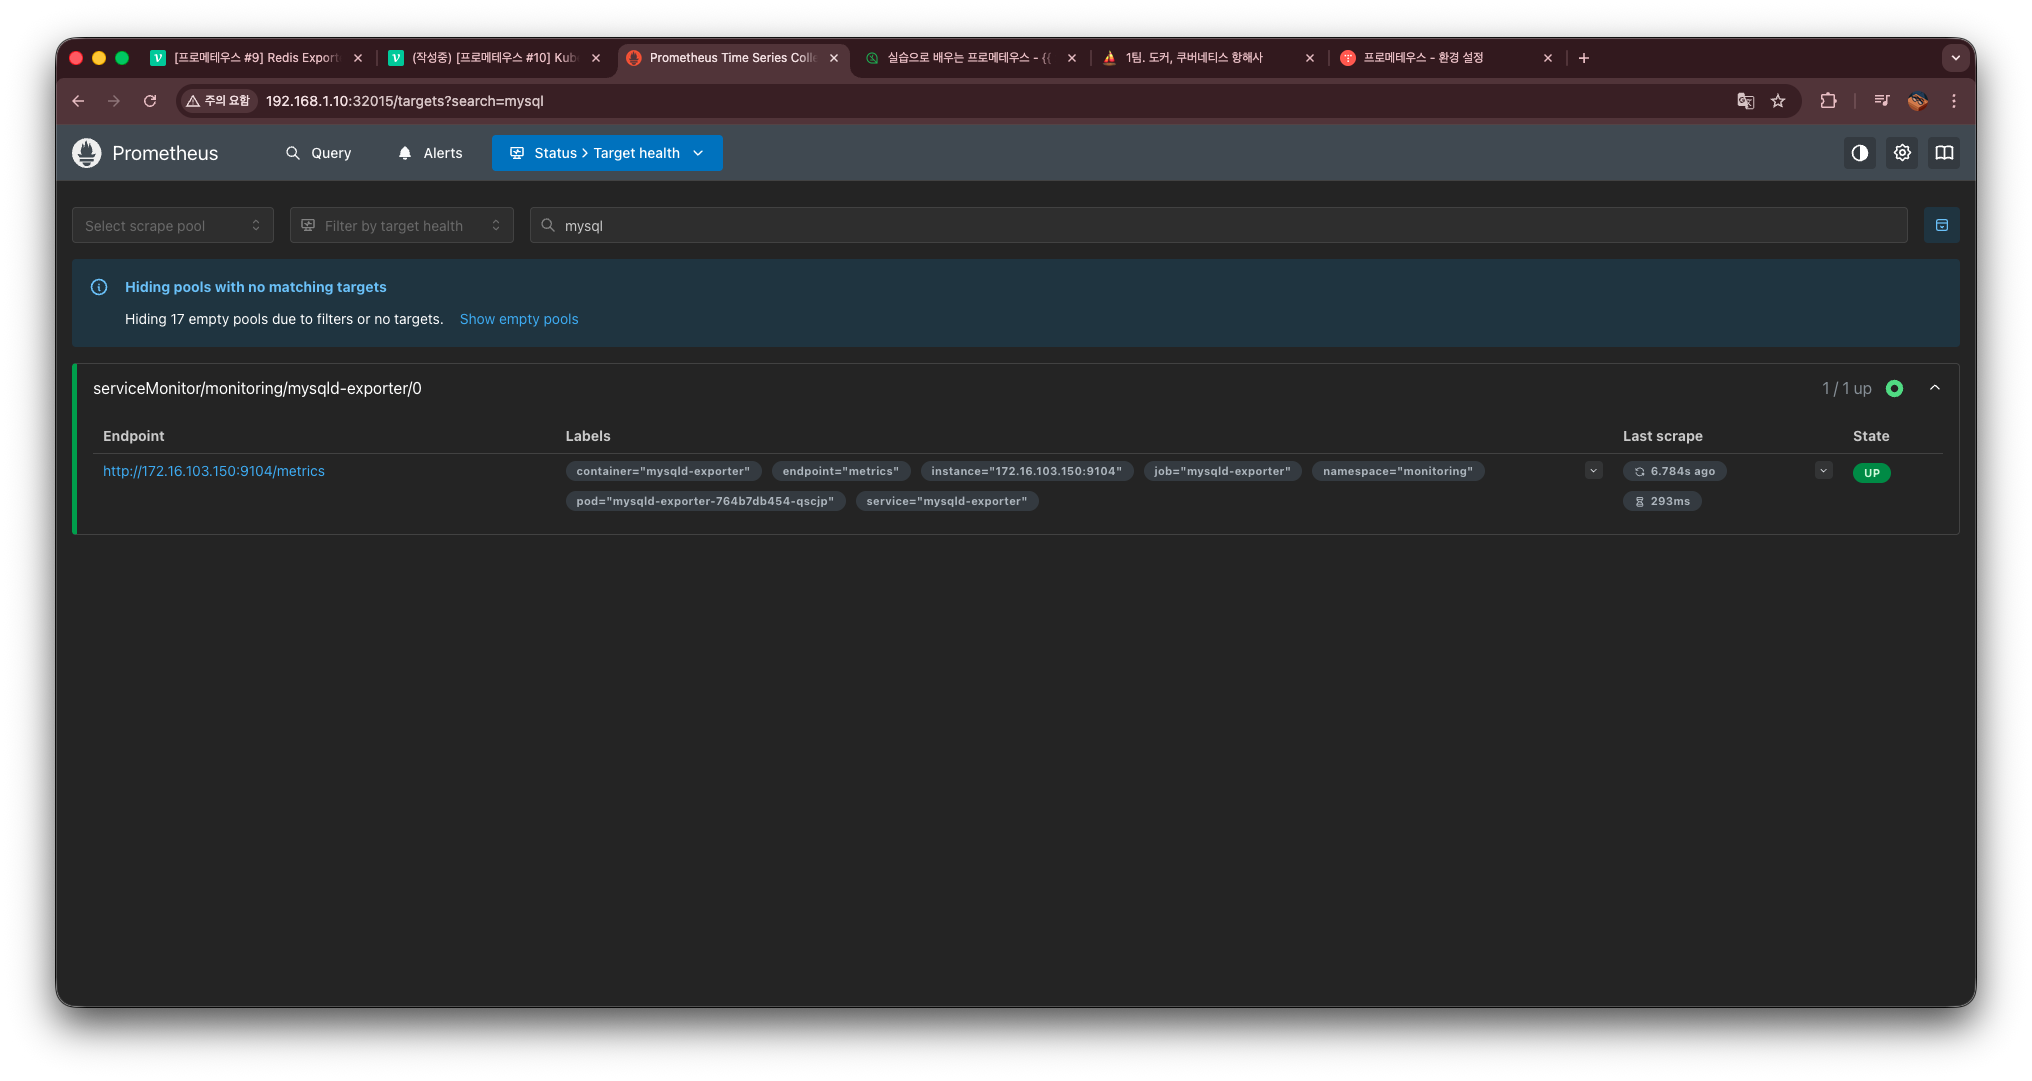
이렇게 Target에 뜨는 것을 확인할 수 있으며,
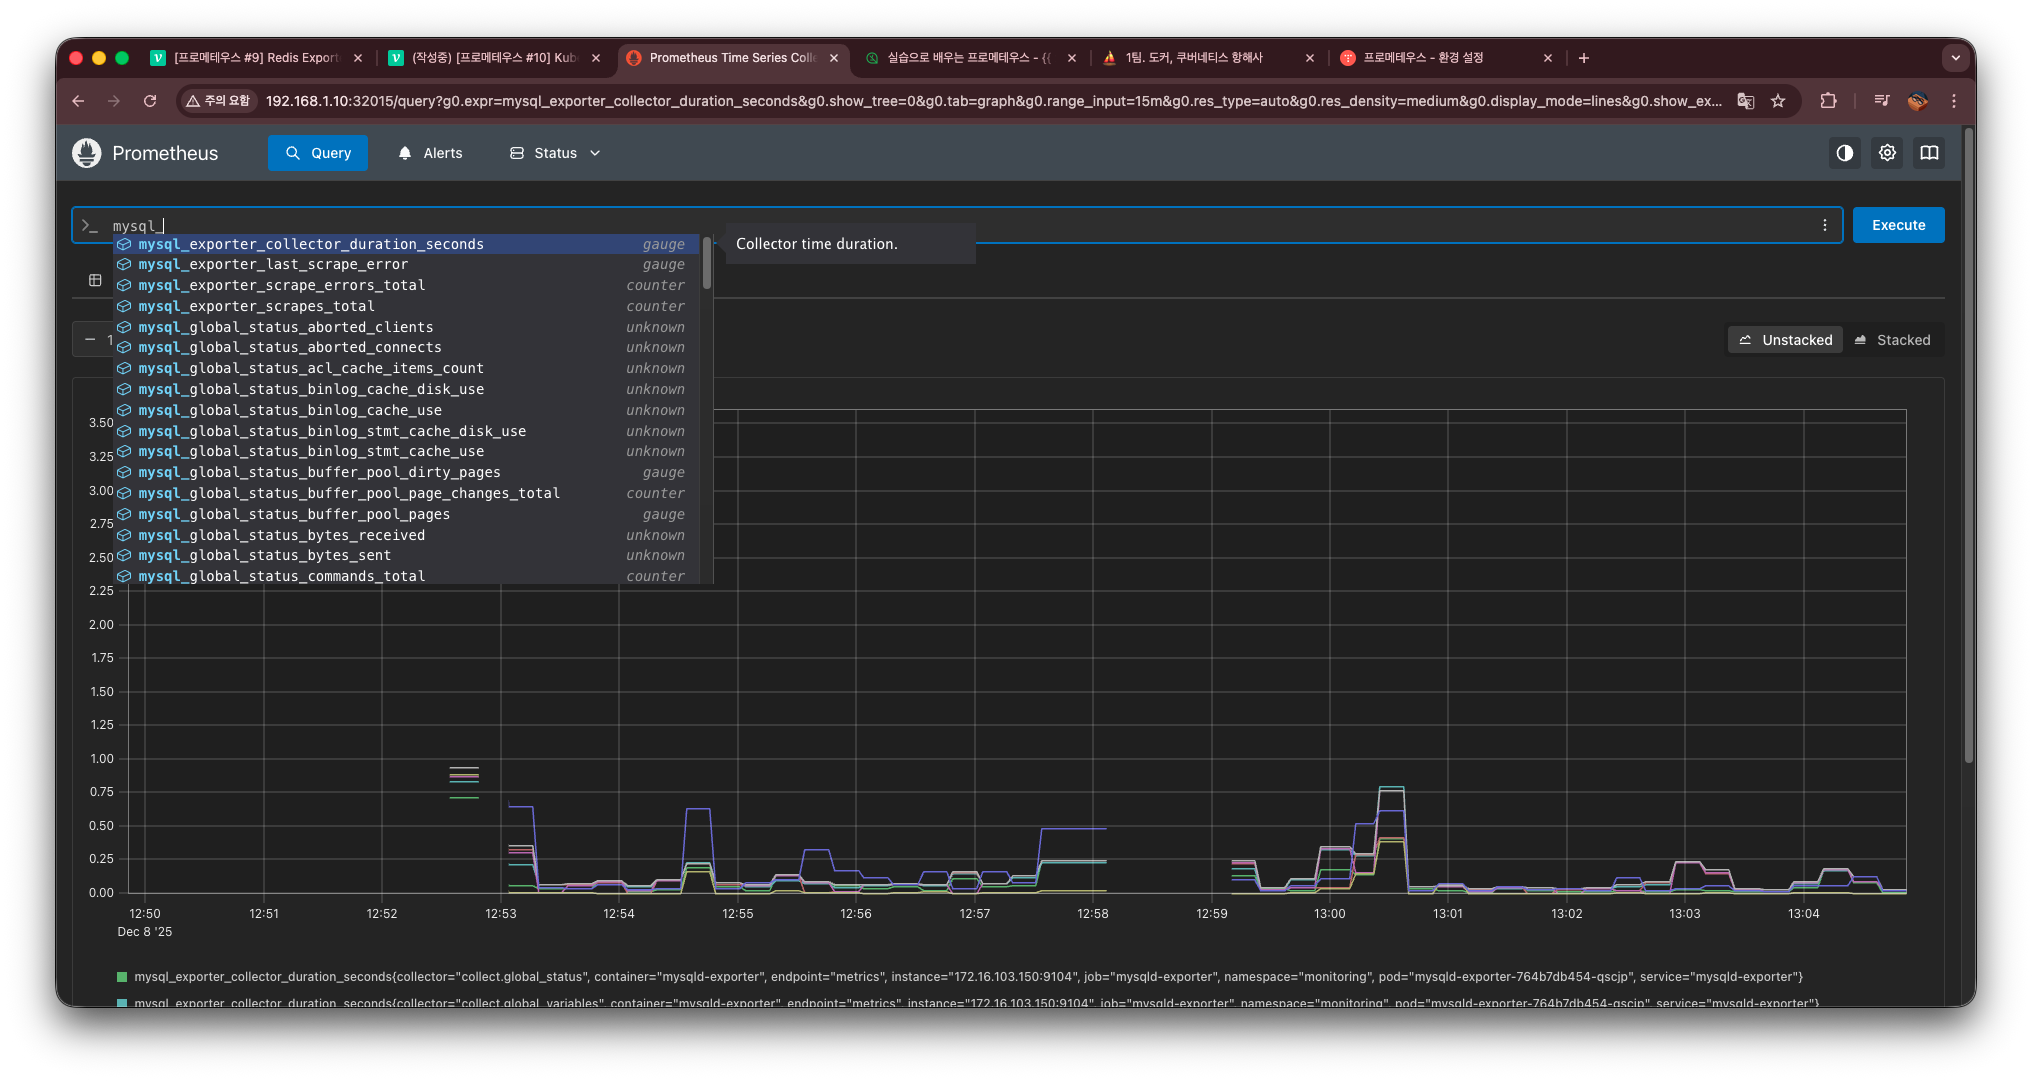
Graph에서도 자동완성 및 데이터가 뜨는 것을 확인할 수 있다.