Recording Rule란
Recording Rule은 Prometheus에서 자주 사용하는 계산식(PromQL) 을
미리 계산해 새로운 메트릭으로 저장해두는 기능이다.
이렇게 해두면,
- 무거운 쿼리 계산이 빨라지고
- UI에서도 즉시 조회가 가능하며
- 자주 쓰는 식을 “메트릭처럼” 편하게 사용할 수 있다.
예를 들어,
topk(3,sum(rate(container_cpu_usage_seconds_total{pod!=""}[1m])) by (pod))이런 긴 식을 매번 입력하는 대신, recording rule로 정의해두면:
record: pod:cpu_usage:top3이렇게 간단한 이름으로 조회할 수 있다.
이번 포스팅에서는 다음 두 가지 Recording Rule을 만들어본다.
- 노드 메모리 사용률 계산
- CPU 사용량이 높은 Pod Top3 계산
실습
1. 노드 메모리 사용률 Recording Rule
파일명: patch-recording-1.yaml
apiVersion: monitoring.coreos.com/v1
kind: PrometheusRule
metadata:
  name: custom-recording-rules-1
  namespace: monitoring
  labels:
    release: kube-prom-stack
spec:
  groups:
  - name: custom.recording.rules.1
    rules:
    - record: node:memory_usage:percent
      expr: |
        100 - 100 * (
          (node_memory_MemTotal_bytes
           - node_memory_MemFree_bytes
           - node_memory_Buffers_bytes
           - node_memory_Cached_bytes
           - node_memory_SReclaimable_bytes)
           /
          node_memory_MemTotal_bytes
        )
2. CPU Top3 Recording Rule
파일명: patch-recording-2.yaml
apiVersion: monitoring.coreos.com/v1
kind: PrometheusRule
metadata:
  name: custom-container-cpu-top3
  namespace: monitoring
  labels:
    release: kube-prom-stack
spec:
  groups:
  - name: custom-container-cpu-top3
    interval: 15s
    rules:
    - record: pod:cpu_usage:top3
      expr: |
        topk(3,
          sum(rate(container_cpu_usage_seconds_total{pod!=""}[1m])) by (pod)
        )
3. 적용
Recording Rule 적용 명령어
kubectl apply -f patch-recording-1.yaml
kubectl apply -f patch-recording-2.yaml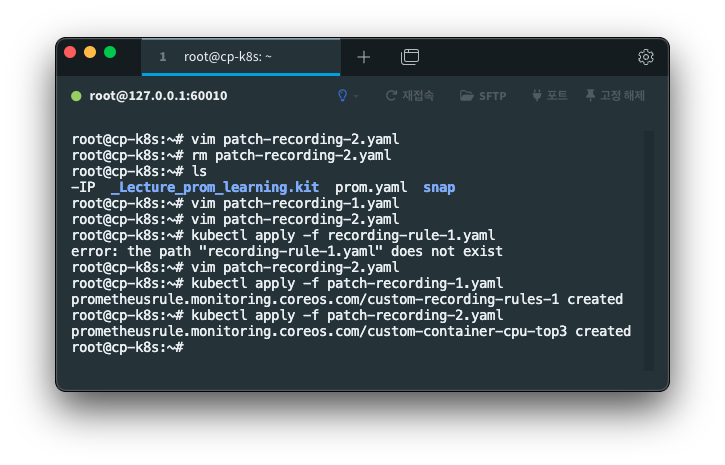
이렇게 적용을 시켰으며,
이제 프로메테우스 ui에 가서 확인을 해 볼 것이다.
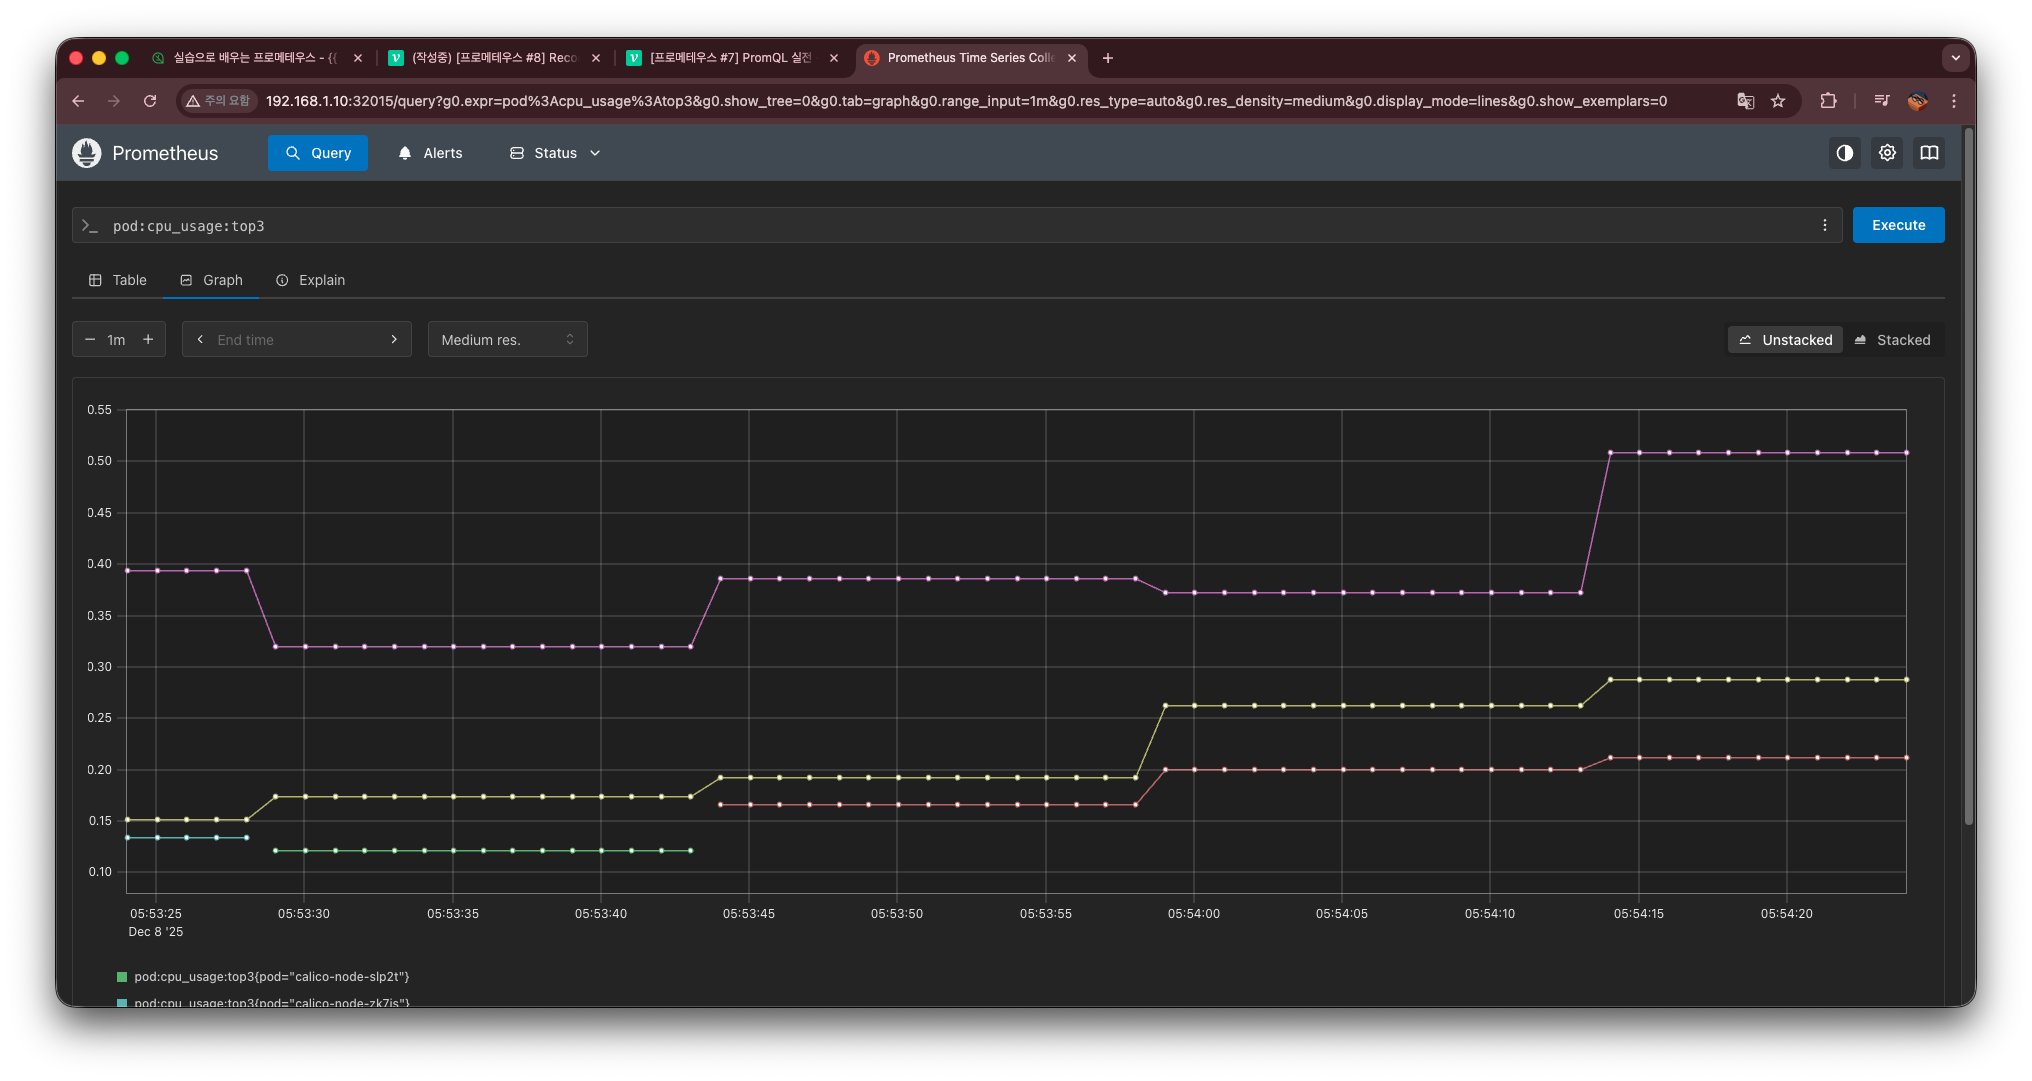
4. 프로메테우스 UI에서 확인
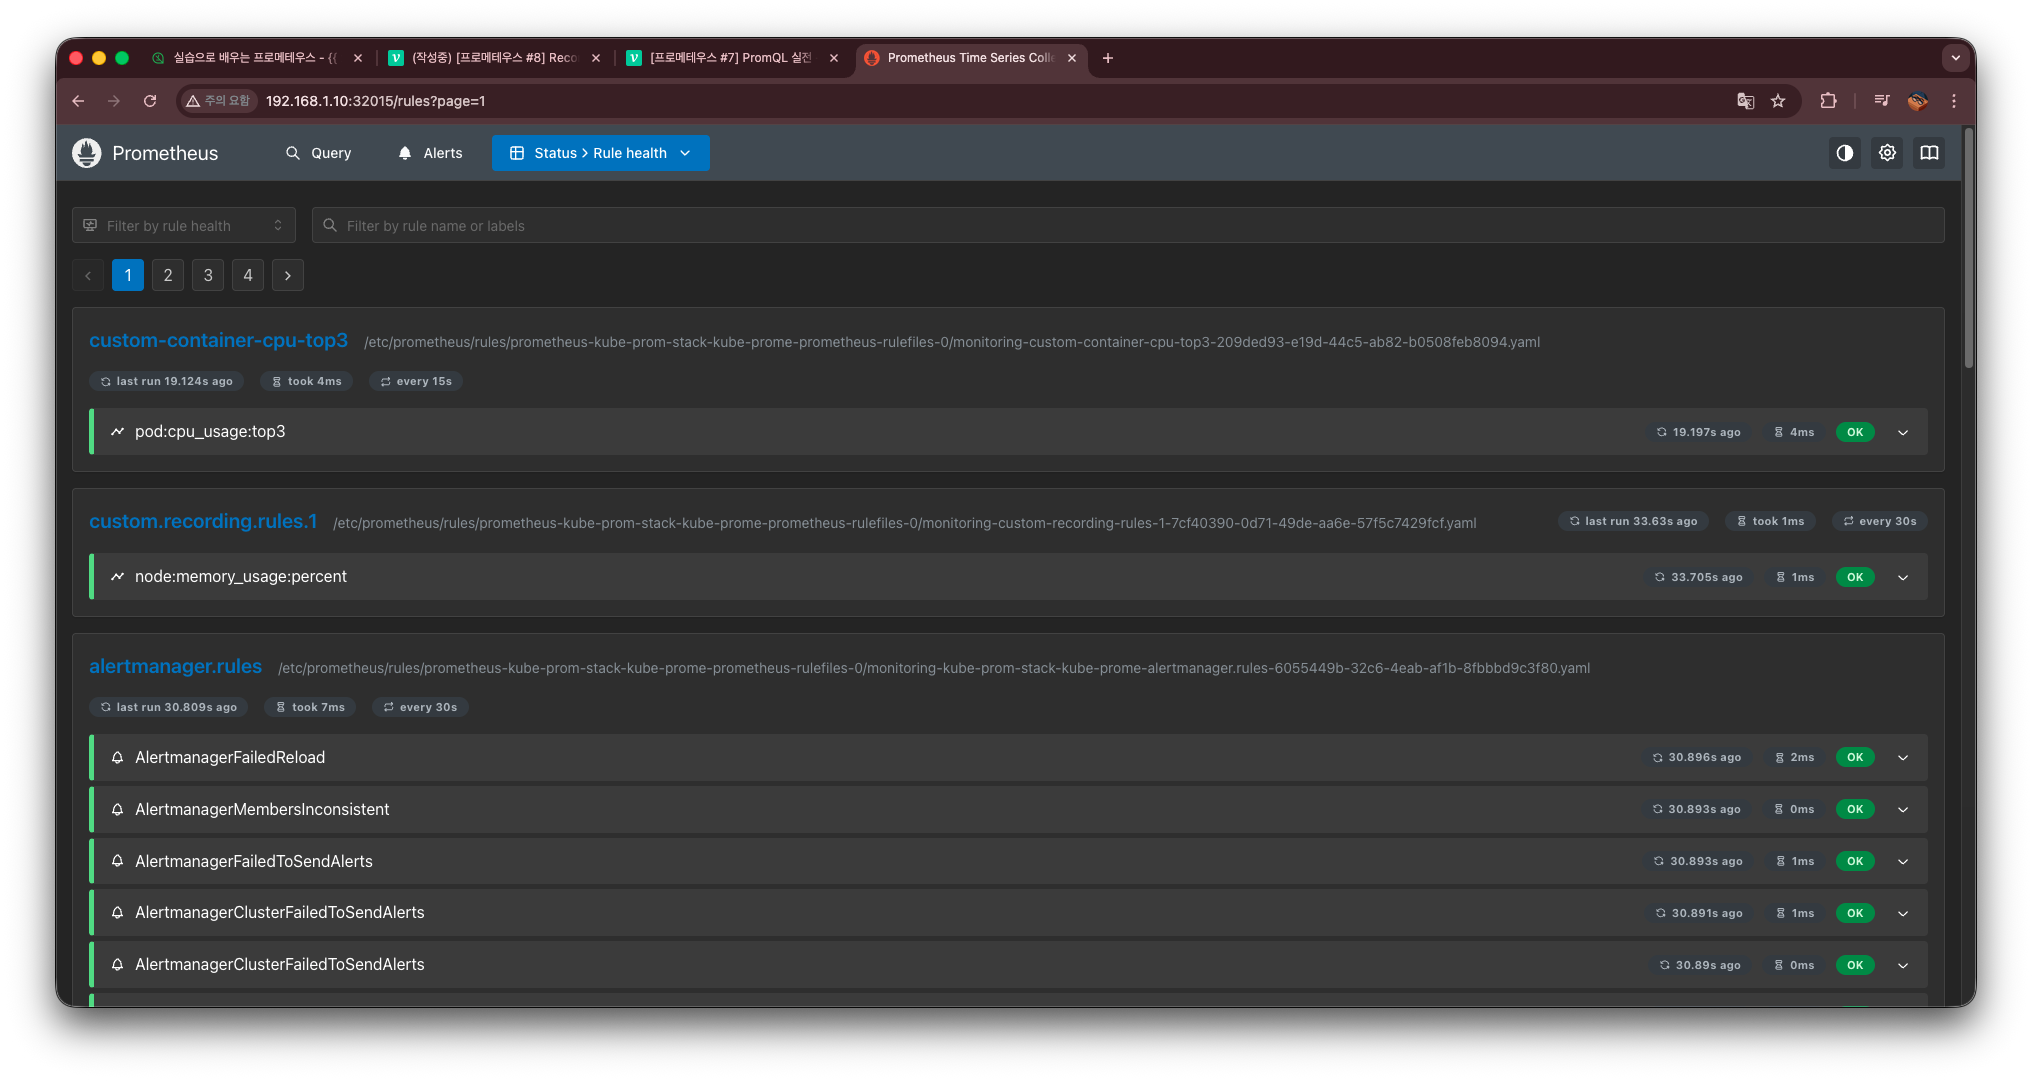
이렇게 Custom- 하고 만든 rule 두 개를 확인할 수 있다.
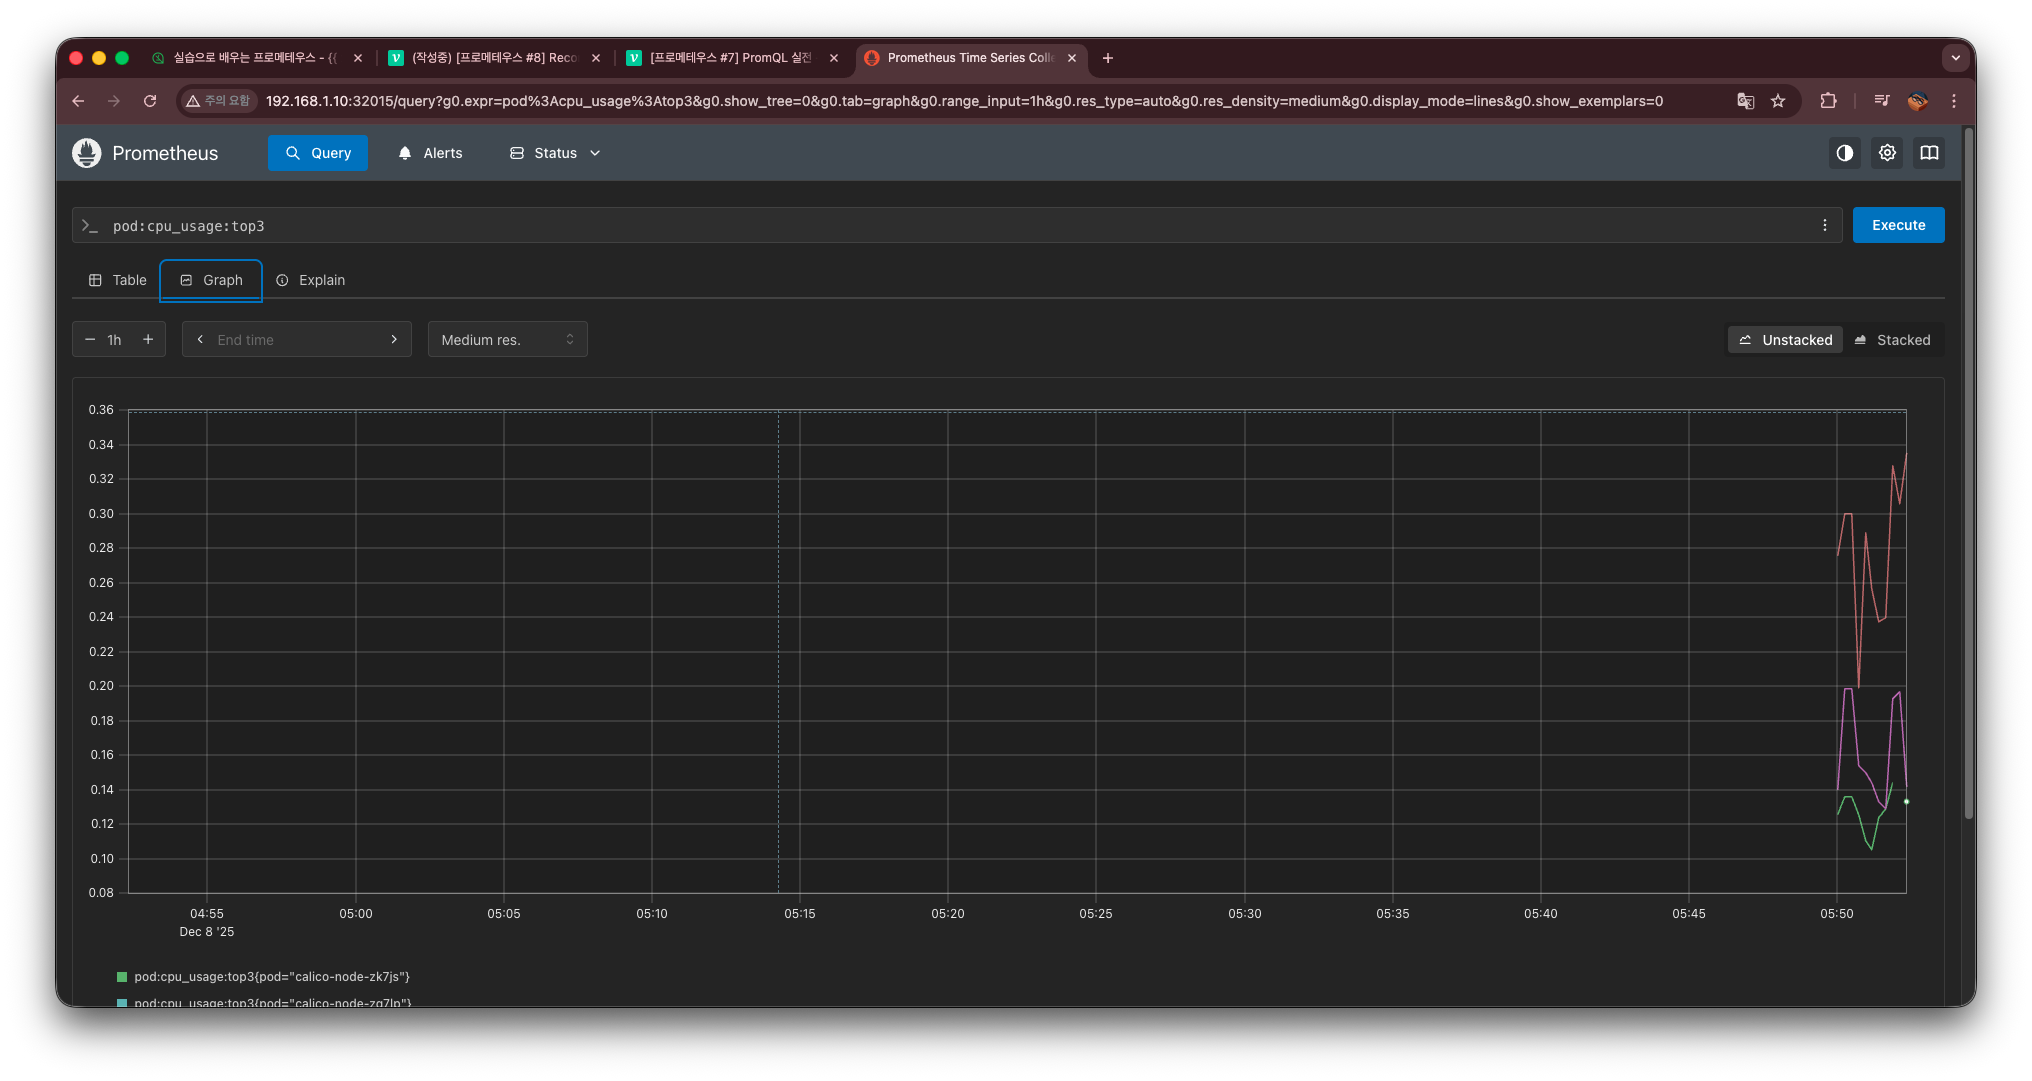
또한 graph에서 만든 rule이 자동완성으로 뜨는 것을 확인 및
조회 가능한 것을 확인할 수 있다.

정도를 걷는 엔지니어