👉 테스트 이유
ecs로 전환하기 전 필요한 메모리를 측정해보기 위해서... + 성능을 테스트해보기 위해 테스트 준비를 해보려고 한다.
👉 목표
Grafana + Prometheus + Docker 를 활용하여 모니터링 환경을 구축하고, JMeter를 사용해 부하를 생성하면서 CPU, 메모리, 네트워크 사용량 등 리소스를 실시간으로 확인하기
👉 모니터링이 필요한 이유
모니터링은 애플리케이션의 안정성과 성능 최적화를 위해 필요하다!
이를 통해 문제를 조기에 발견하고 장애를 예방하며, 과도한 자원 사용을 최적화하여 비용을 절감할 수 있다. 또한, 응답 시간과 성능 트렌드를 파악해 사용자 경험을 개선하고, 데이터 기반 의사결정에 활용할 수 있기때문에 필요하다.
Grafana + Prometheus + Docker
Grafana는 CPU, 메모리 등 애플리케이션과 시스템의 다양한 메트릭을 시각화하여 모니터링할 수 있는 도구로 Prometheus와 같은 모니터링 데이터베이스에서 메트릭 데이터를 가져와, 대시보드를 통해 실시간으로 보여준다.
이렇게 함으로써 Grafana는 시스템 성능을 한눈에 파악할 수 있게 해줌
또한, Grafana는 실시간 대시보드에 기반해 메트릭을 지속적으로 모니터링하여, 설정한 조건이 충족되면 즉시 알림을 발송해준다고 한다.
먼저 spring boot에 grafana를 설정해주기 위해 Spring Boot Actuator를 사용하여야 한다.
/actuator/premetheus경로로 Promethesus에서 사용할 메트릭 정보를 가져와야 한다.
여기서 매트릭 정보는
Promethues는 일정시간마다 pull 해와서 수집한다고 한다.
👉 환경 설정
build.gradle
	implementation 'org.springframework.boot:spring-boot-starter-actuator'
	implementation 'io.micrometer:micrometer-core'
	implementation 'io.micrometer:micrometer-regis```
코드를 입력하세요
```try-prometheus'
application.yml
management:
endpoint:
prometheus:
enabled: true
endpoints:
web:
exposure:
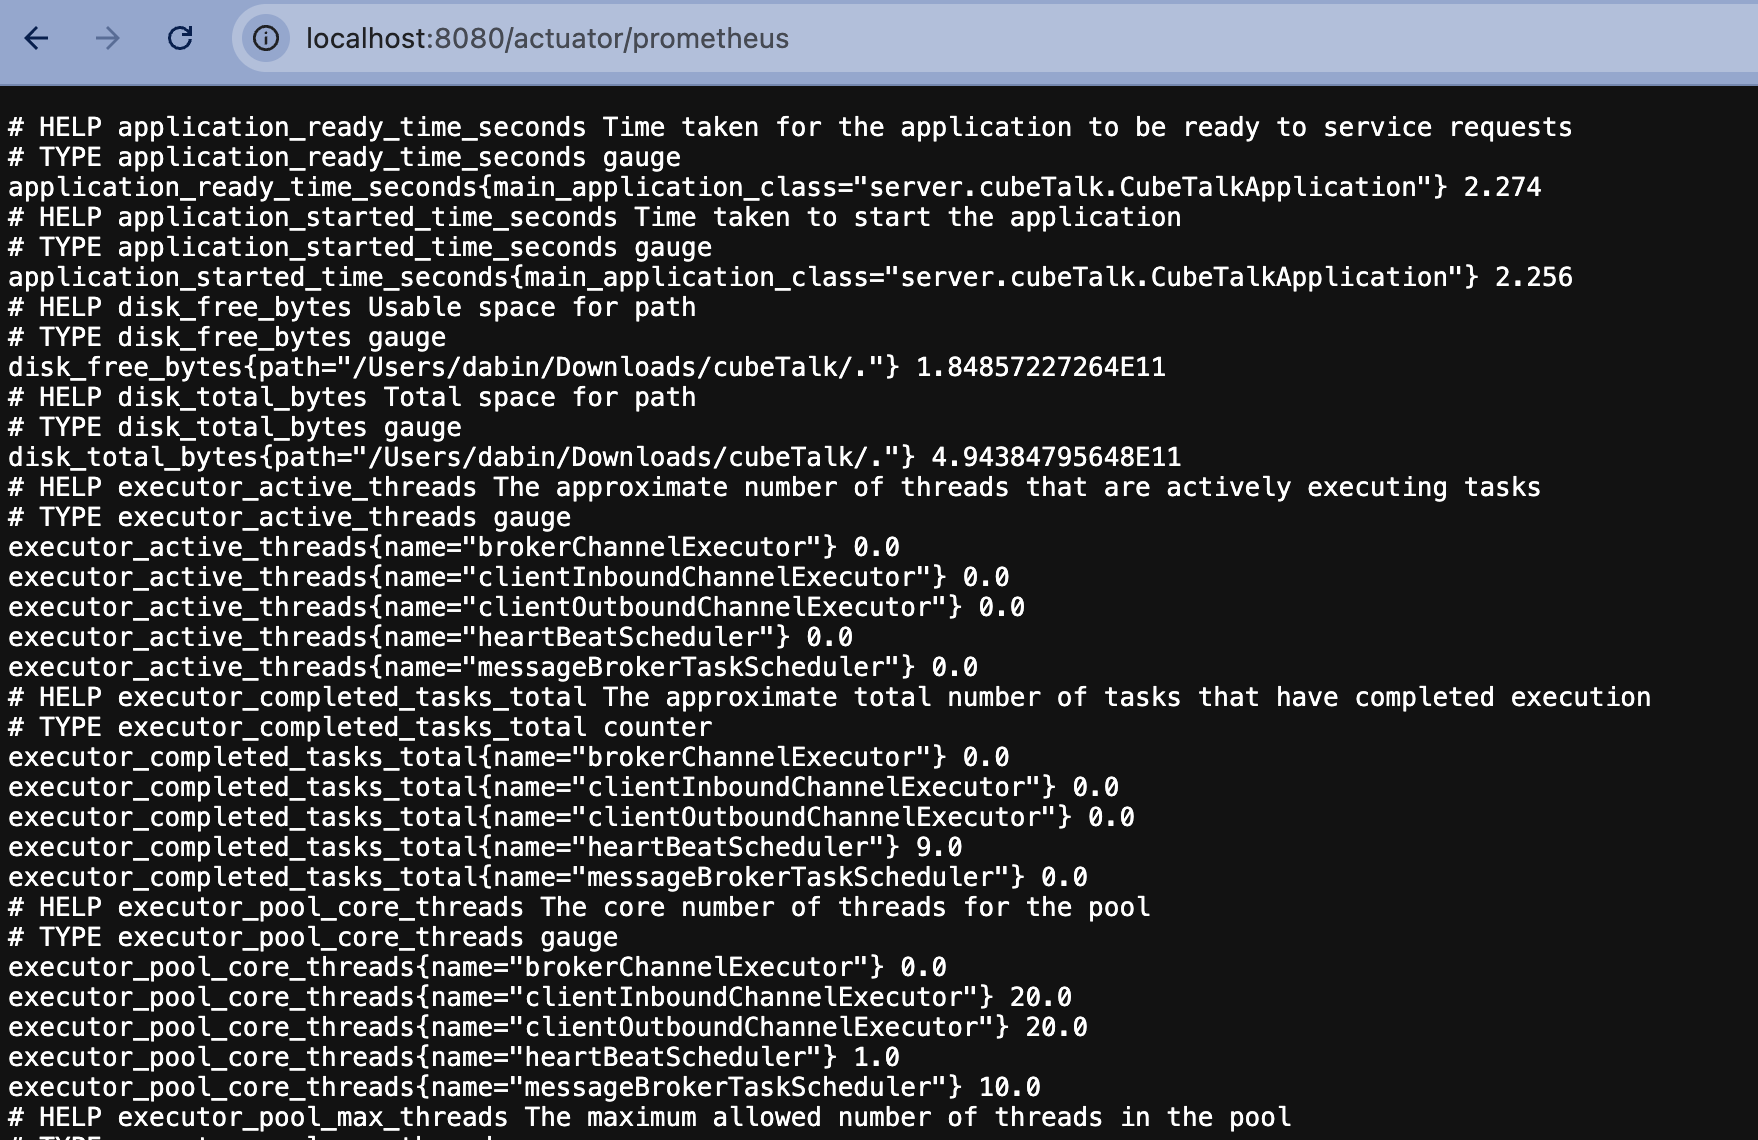
include: prometheus이제 빌드 후 스프링 부트를 실행시키고, localhost:8080/actuator/prometheus 경로로 접속하면 매트릭 정보를 확인할 수 있다.
docker-compose.yml 파일을 작성하여 Prometheus와 Grafana 컨테이너를 설정
version: '3'
services:
  prometheus:
    image: prom/prometheus:latest
    container_name: prometheus
    volumes:
      - ./prometheus.yml:/etc/prometheus/prometheus.yml  # Prometheus 설정 파일
    ports:
      - "9090:9090"  # Prometheus 웹 인터페이스 포트

  grafana:
    image: grafana/grafana:latest
    container_name: grafana
    ports:
      - "3000:3000"  # Grafana 웹 인터페이스 포트
    environment:
      - GF_SECURITY_ADMIN_USER=admin     # Grafana 기본 사용자 이름
      - GF_SECURITY_ADMIN_PASSWORD=admin # Grafana 기본 비밀번호
Prometheus가 Spring 애플리케이션의 메트릭을 수집할 수 있도록, prometheus.yml 파일을 프로젝트 루트 디렉토리에 생성하여 작성한다.
global:
  scrape_interval: 5s  # 메트릭 수집 주기

scrape_configs:
  - job_name: 'spring-actuator'
    metrics_path: '/actuator/prometheus'  # Spring Actuator 메트릭 경로
    static_configs:
      - targets:
      	- 'host.docker.internal:8080'
Mac과 Windows에서는 Docker가 host.docker.internal 또는 docker.for.mac.localhost를 통해 호스트를 참조할 수 있게 지원한다고 한다.
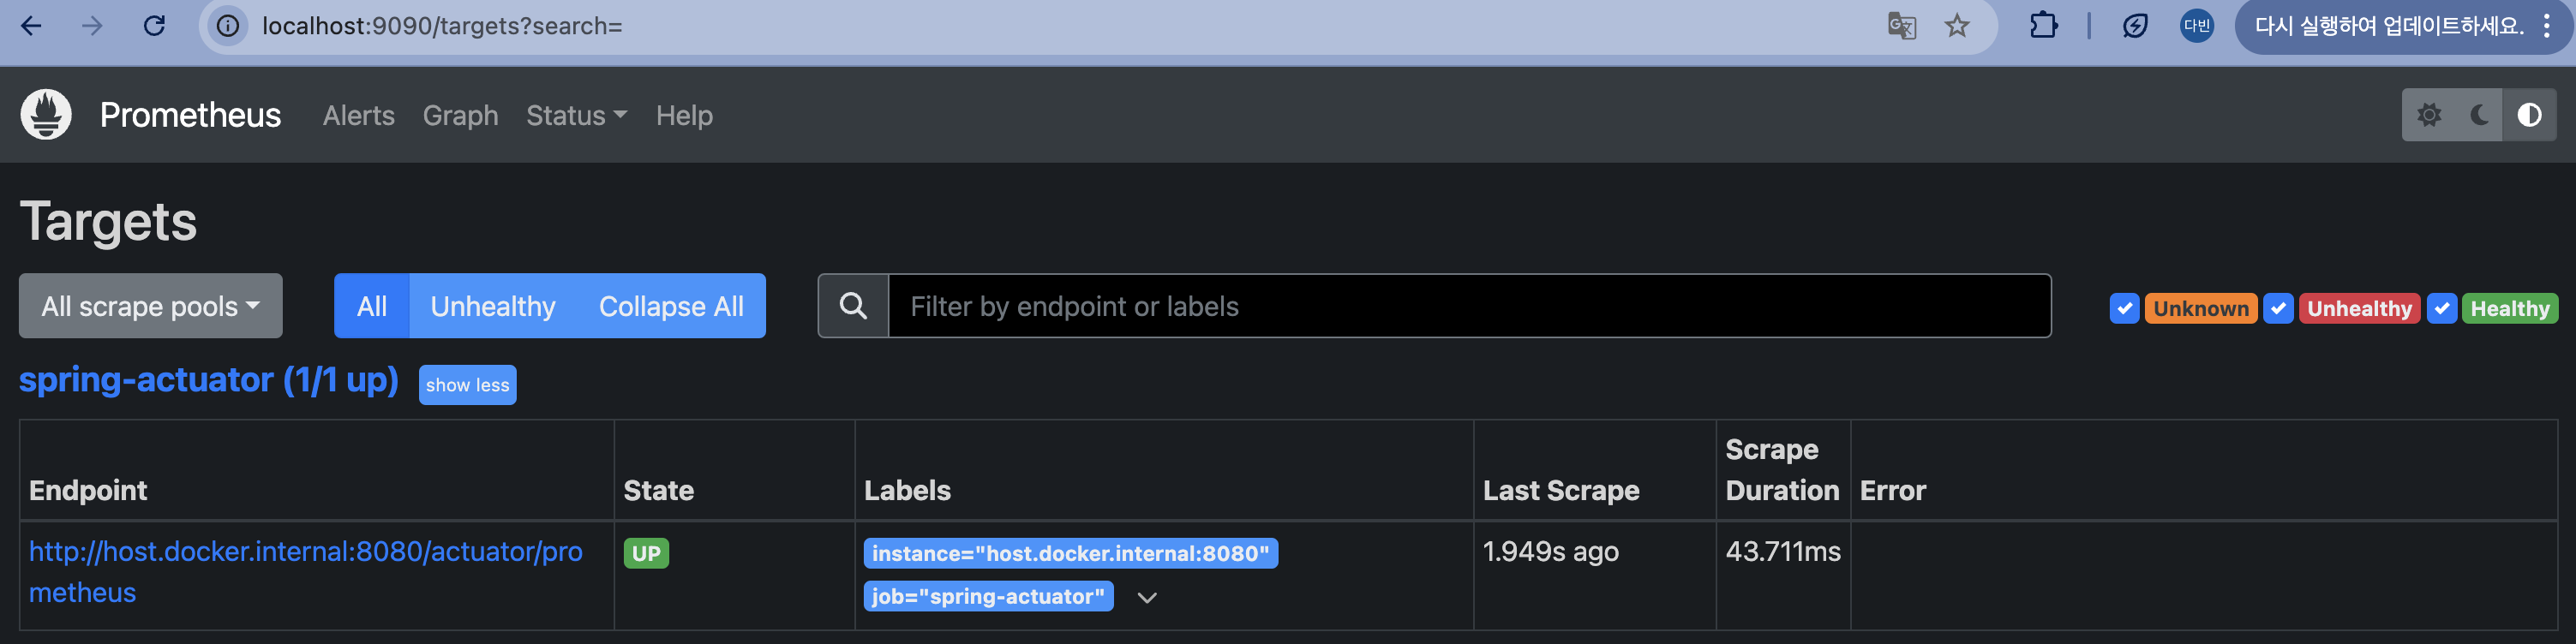
이제
localhost:9090/targets에 접속하면, 해당 state를 확인할 수 있다
grafana
http://localhost:3000
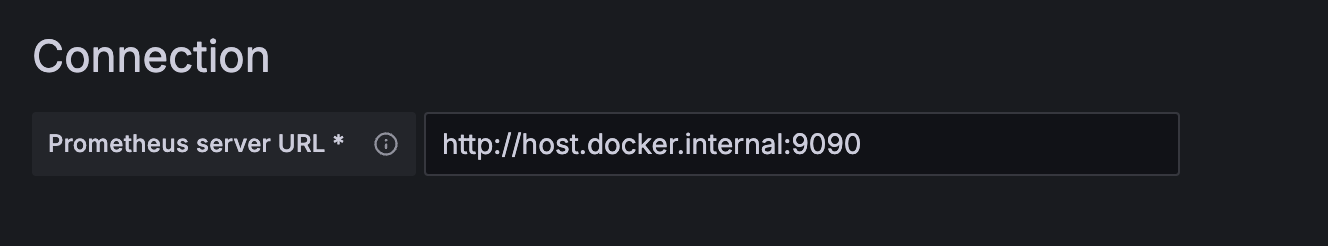
로 접속하여, database -> prometheus 를 들어간뒤에 connection에
해당 prometheus.yml 에서 설정했던 어플리케이션의 url을 입력해준다.
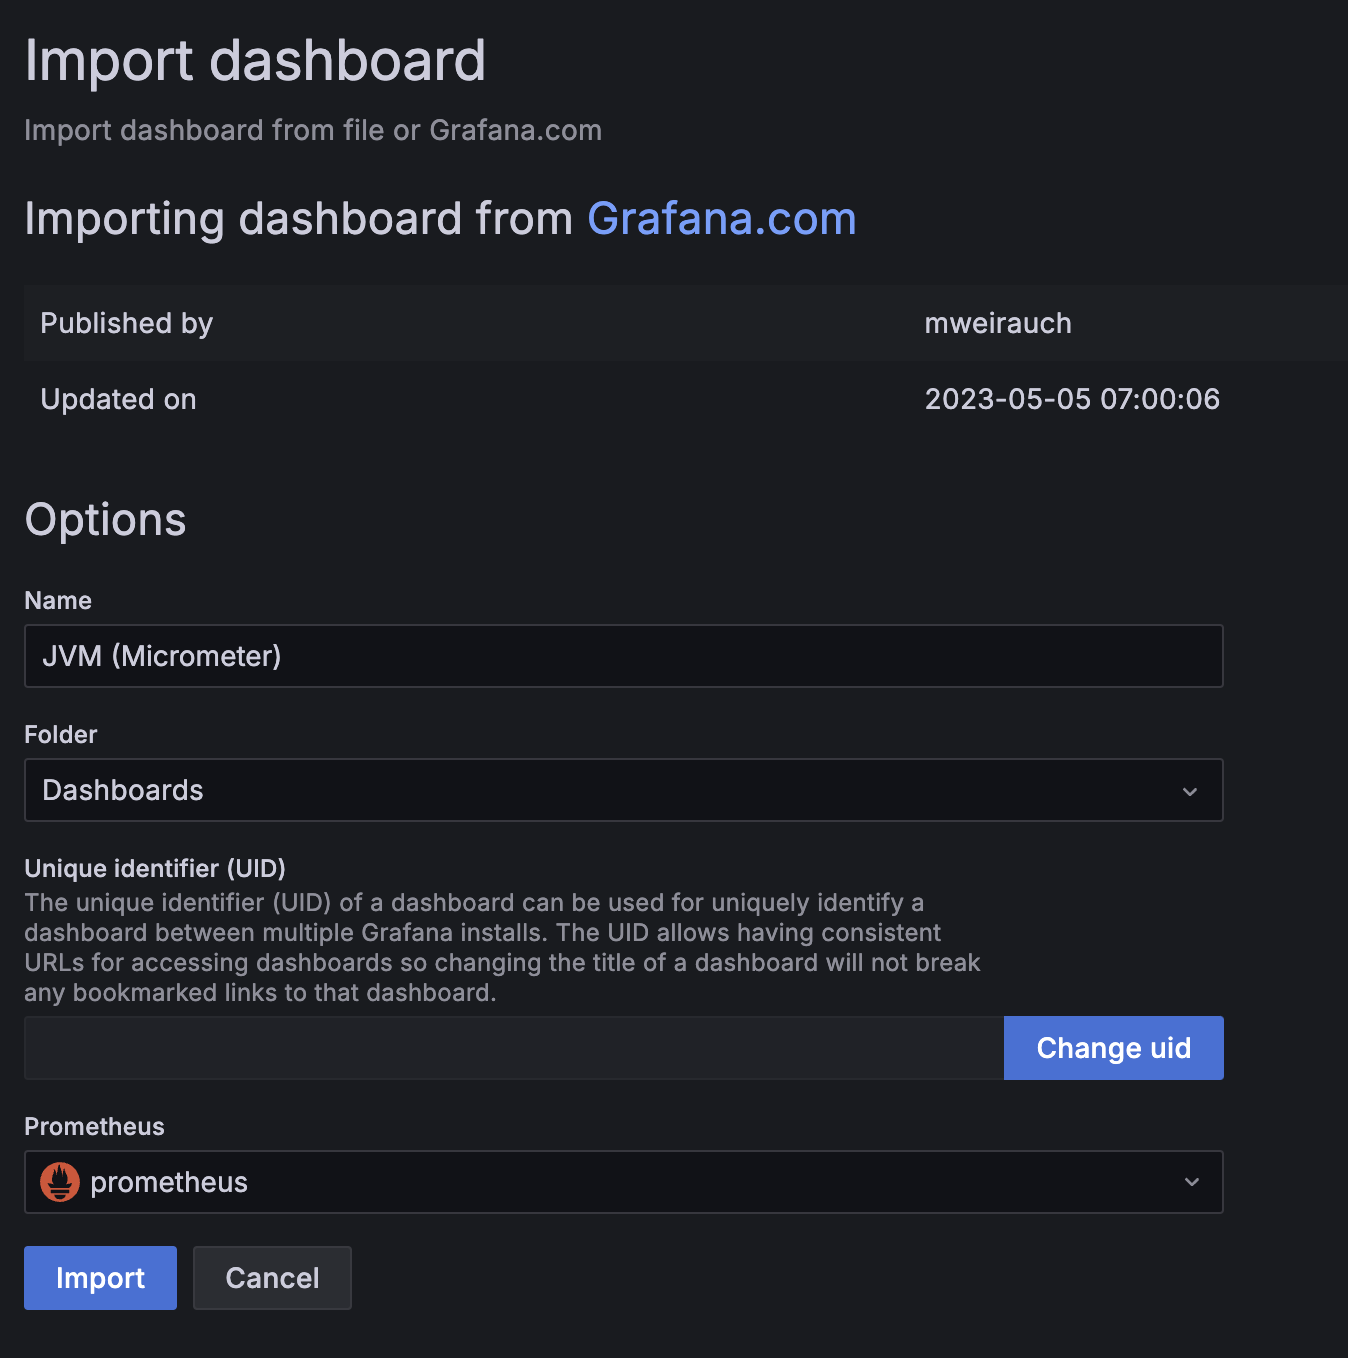
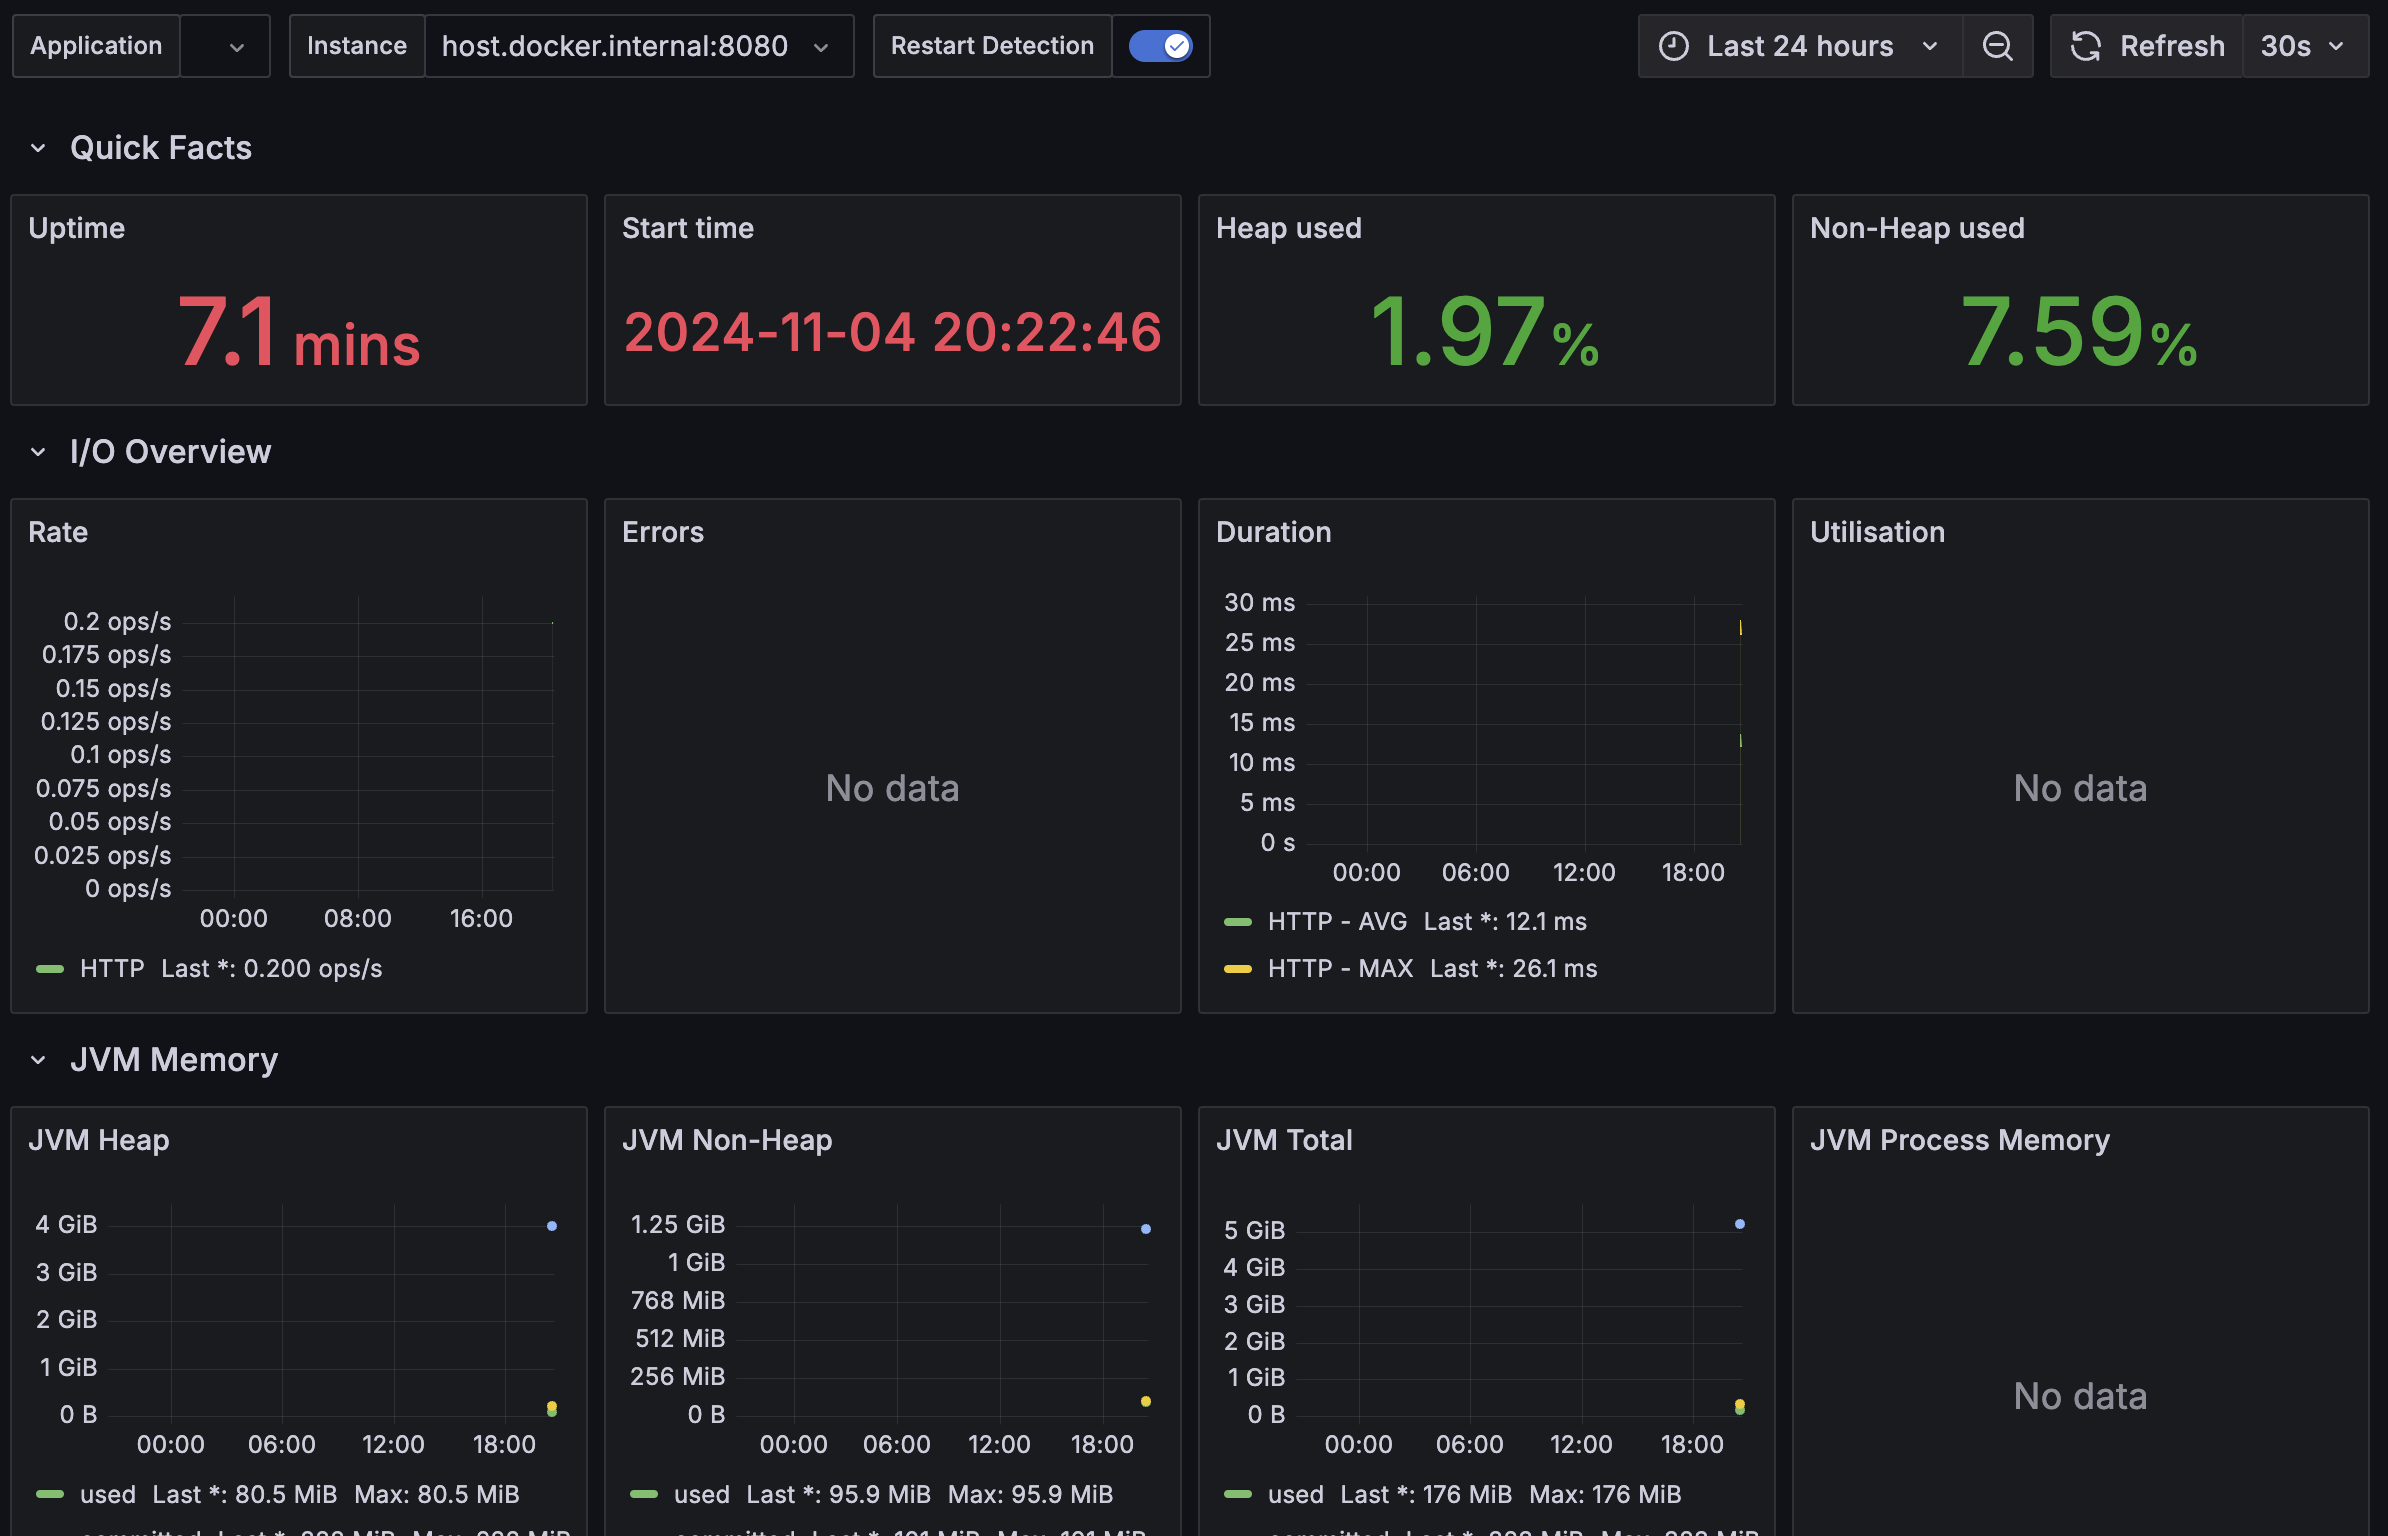
이후에 dashboard에 id칸에 4701을 입력하고 load버튼을 누른 뒤에 위에서 설정한 prometheus를 추가하면 끝
👉 추후 할 일
근데 이제 https를 설정하고 추후에 바꿔줘야한다..