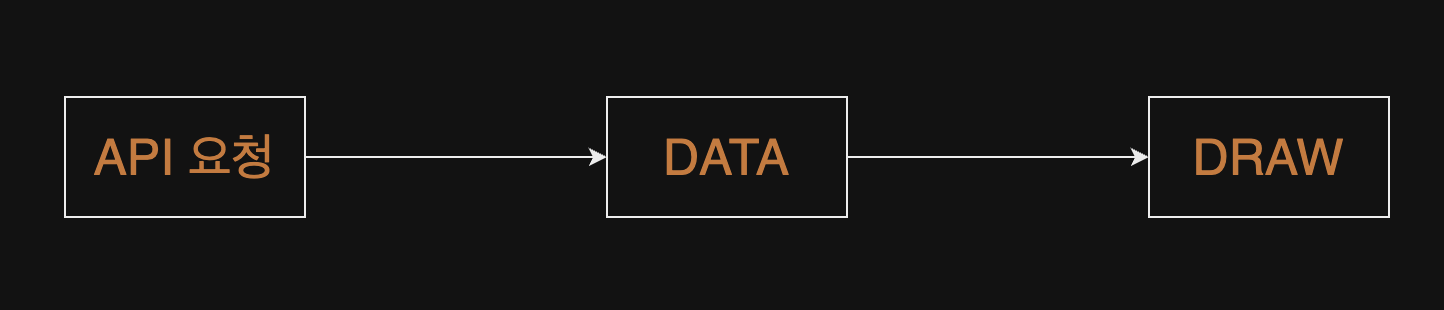
서울시 온도 예측을 인공지능 모델이나 수치 모델을 사용하지 않고 OPEN API를 이용해서 구현하기
api url
👉🏻 Charjs 링크
index.html
<!DOCTYPE html>
<html lang="en">
  <head>
    <meta charset="UTF-8" />
    <meta http-equiv="X-UA-Compatible" content="IE=edge" />
    <meta
      name="viewport"
      content="width=device-width,
initial-scale=1.0"
    />
    <title>Document</title>
    <style>
      canvas {
        width: 100% !important;
      }
    </style>
  </head>
  <body>
    <canvas id="myChart"></canvas>
  </body>
  <script src="https://cdn.jsdelivr.net/npm/chart.js"></script>
  <script>
    const OPEN_API =
      "https://open-meteo.com/en/docs#latitude=37.566&longitude=126.9784&hourly=temperature_2m&timezone=Asia%2FTokyo";
    const draw = (res) => {
      const opt = {
        year: "numeric",
        month: "numeric",
        day: "numeric",
        hour: "numeric",
      };
      res.hourly.time = res.hourly.time.map((e) => {
        return new Intl.DateTimeFormat("ko-KR", opt).format(new Date(e));
      });
      const data = {
        labels: res.hourly.time,
        datasets: [
          {
            label: "서울의 온도차트",
            data: res.hourly.temperature_2m,
            borderColor: "rgb(255, 99, 132)",
            backgroundColor: "rgba(255, 99, 132, 0.5)",
            pointStyle: "circle",
            pointRadius: 10,
            pointHoverRadius: 15,
          },
        ],
      };
      const ctx = document.getElementById("myChart").getContext("2d");
      const myChart = new Chart(ctx, { type: "line", data: data });
    };
    window.onload = async () => {
      const ret = await fetch(OPEN_API).then((res) => res.json());
      draw(ret);
    };
    /*
    load : 스타일시트 및 이미지와 같은 모든 종속 리소스를 포함하여 전체 페이지가 로드될 때를 말합니다.
    */
  </script>
</html>

HW + SW = 1