012일차 - Streamlit
Python 가상환경 - venv
$ python -m venv [가상환경이름]
$ [가상환경이름]\Scripts\activate # 맥은 source [가상환경이름]\Scripts\activate
$ python -m pip install --upgrade pip # pip 업그레이드
$ pip install streamlit # $ conda install streamlit
$ streamlit hello
$ streamlit run 파일명.py
$ pip freeze > requirements.txt
$ deactivate # 가상환경 비활성화
Streamlit
- 프론트엔드 프레임워크로 Python으로 구현되어 있다.
streamlit.text_input()형식의 모듈을 호출하여 DOM 객체를 생성할 수 있다.- 기본적인 스타일이 적용되어 있어 있다.
st.plotly_chart(fig)를 호출하여 만들어진 ployly fig 차트 객체를 페이지에 표시할 수 있다.- ./pages 디렉토리에 구성하는 streamlit 코드들을 페이지 상 사이드바에 위치하여 페이지 전환을 할 수 있게 한다.
- streamlit에서 제공하는 배포 서비스를 이용하여 정말 쉽게 배포할 수 있다.
- 무료 요금제 사용 시 RAM 1GB, GitHub을 통한 배포만 가능, 24시간 동안 접속이 없는 경우 서버 다운의 제약이 있다.
012 ~ 013일차 - Streamlit 프로젝트 진행
주제선정
- Streamlit을 이용하여 대시보드를 구축하는 것을 주제로 팀 프로젝트를 진행했다.
- 4명이 한 팀으로 이틀동안 자유롭게 주제를 정하여 개발하였다.
- 쿠팡 상품 리뷰 데이터 시각화, 주식 차트 시각화, 2024 Spotify 시각화 등의 주제가 제안되었다.
- 금융 도메인으로 주제를 선정하고 싶었고, 증권 뉴스 데이터로 자연어 분석이 가능하다는 팀원간의 의견이 합치되어 최종적으로 주식 차트 시각화를 주제로 선정하였다.
환경 구축
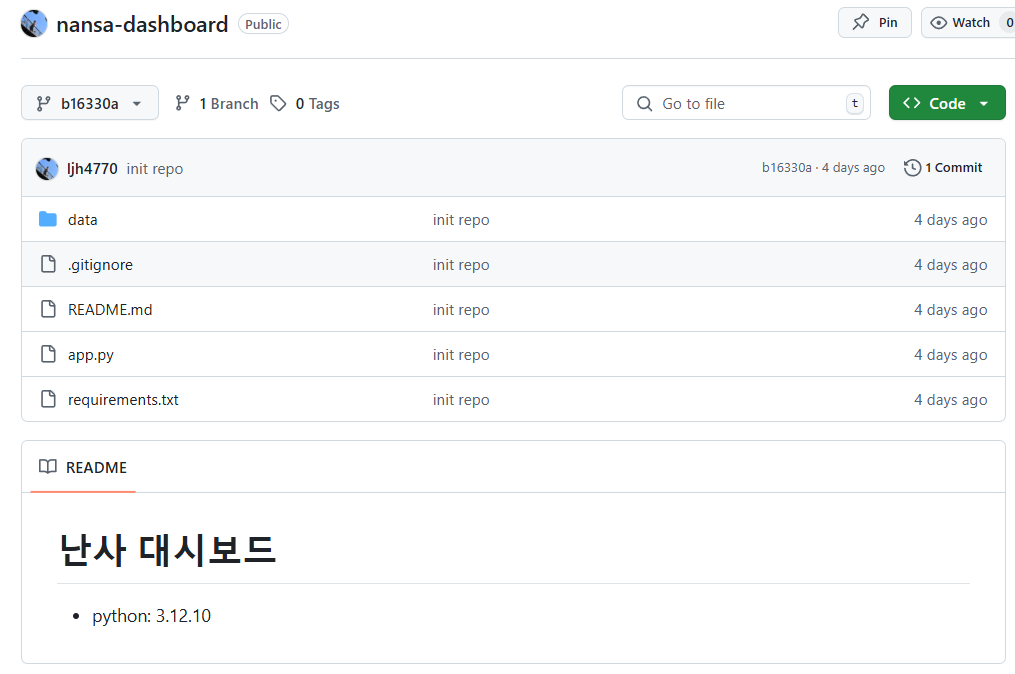
- 수업 시간에 이미 python을 3.12.10 버전으로 설치하였다.
- python venv를 이용하여 가상환경을 구축하고,
requirements.txt파일에pip freeze출력을 저장하여 버전을 통일했다.
- 짧은 기간 및 팀원간 역할이 분리되어 있다는 점, 바로 옆에서 개발을 진행한다는 점으로 단일 브랜치만을 이용하여 개발하는 것으로 결정했다.
- 최신 버전 유지 및 충돌 방지를 위해 push한다는 것을 공유해야 했다.
캔들 차트 시각화
🔗Candlestick Charts in Python - plotly
- plotly에서 ohlc 정보를 이용하여 캔들차트를 시각화하는 함수는 이미 존재하므로 추가적인 아이디어를 제안하고 싶었다.
- MA, EMA 등의 지표를 추가하는 것을 아이디어로 제안하였고, 체택되었다.
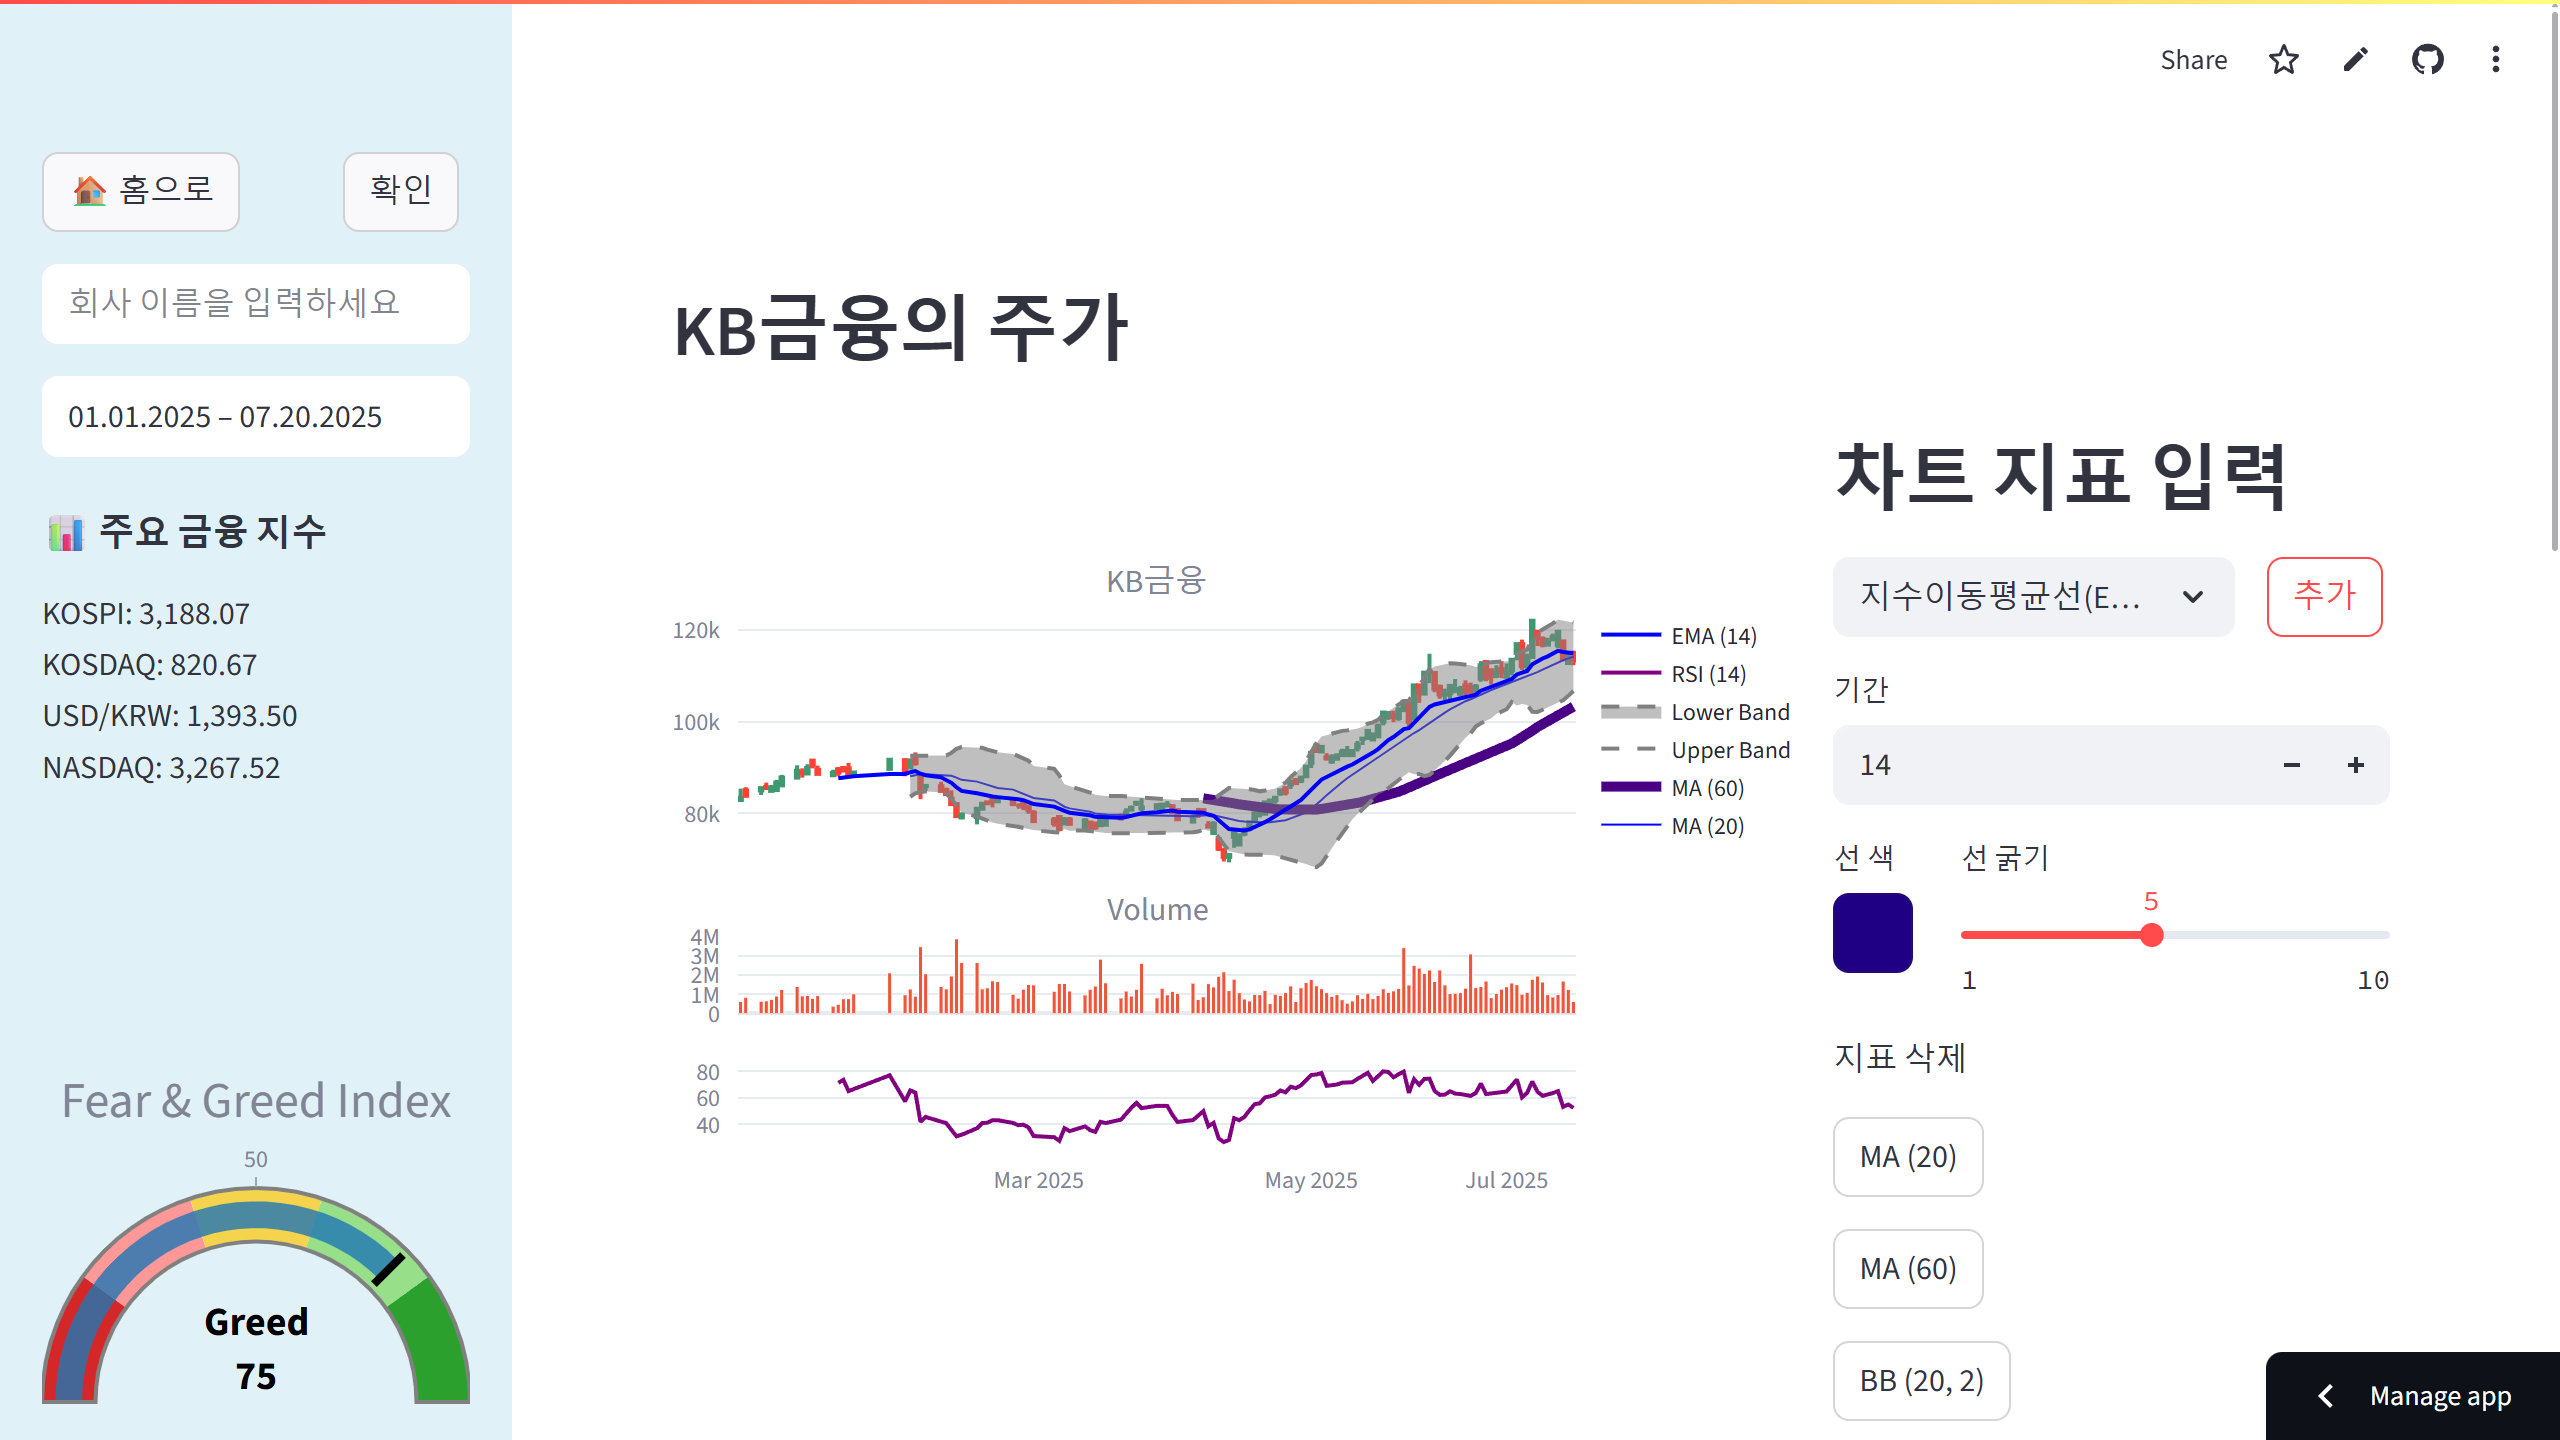
- 사이드 바의 하단 공간이 남기 때문에 종목 무관한 정보를 넣고 싶었고, 공포와 탐욕 지수, 코스피 등 주가 지수 정보를 넣었다.
- ohlcv 정보의 경우 FinanceDataReader 라이브러리를 사용했다.
- MA 등의 기술 지표를 계산하는 것은 멋져보이지만, 이틀 내에 프로젝트 결과물을 완수해야되기 때문에 기존에 존재하는 라이브러리 혹은 API를 탐색하였다.
ta(Technical Analysis) 라이브러리를 발견했고 상정한 지표인 MA, EMA, RSI, 볼린저밴드를 객체의 메서드 형태로 계산하여 반환해주는 것을 확인했다.
🔗Technical Analysis Library in Python
- 공포 탐욕 지수를 CNN에서 제공하는 값을 가져오는 python wrapper 라이브러리를 발견했다.
- 코스피 등 주가 지수는 팀원이 네이버 증권 페이지를 크롤링하여 값을 얻었다.

- 게이지 차트를 이용하여 공포와 탐욕 지수를 시각화 했다.
💡 페이지 로딩 혹은 사이드바 오픈 시 게이지 눈금을 0부터 시작하여 현재값까지 이동시키고 싶었으나, 애니메이션으로 구성해야된다는 오버헤드를 근거로 정적으로 표시했다.
-
FinanceDataReader의 GitHub를 확인하니 ohlcv정보를 요청할 때 일 단위로 요청하도록 하드코딩되어 있는 것을 확인했다.
💡 추후 yfinance 혹은 유료 API를 이용하여 분단위 ohlcv 정보를 받아와 분봉, 1시간봉 등을 제공할 수 있도록 해야겠다. -
다음과 같이 기술 지표 입력값을 받았고, streamlit의
session_state에 list of dictionary로 저장하여 시각화 모듈에서 값을 읽어 시각화하도록 로직을 구성했다.
def chart_indicator_form():
    st.header("차트 지표 입력")

    MA = '이동평균선(MA)'
    EMA = '지수이동평균선(EMA)'
    BOLLINGER = '볼린저 밴드(BB)'
    RSI = '상대강도지수(RSI)'

    indicator_list = [MA, EMA, RSI, BOLLINGER]
    selectbox, confirm = st.columns([3, 1])
    with selectbox:
        indicator_choice = st.selectbox(
            '지표선택',
            indicator_list,
            key="indicator_choice",
            label_visibility="collapsed" # 라벨 숨기기
        )
    with confirm:
        add_btn = st.button("추가")

    if indicator_choice in [MA, EMA, RSI]: # 이동평균선 & 지수이동평균선 & rsi
        period = st.number_input("기간", min_value=1, max_value=1000, value=20)
        line_color, line_width = _line_form("#0000FF", 2)

        if add_btn:
            indicator_dict = {
                'period': period,
                'line_color': line_color,
                'line_width': line_width
            }
            # 선택한 인디케이터 이름 설정
            if indicator_choice == MA:
                indicator_dict['name'] = 'ma'
            elif indicator_choice == EMA:
                indicator_dict['name'] = 'ema'
            elif indicator_choice == RSI:
                indicator_dict['name'] = 'rsi'

            # session_state에 선택한 인디케이터 저장
            st.session_state['indicators'].append(indicator_dict)

    elif indicator_choice == BOLLINGER: # 볼린저 밴드
        period = st.number_input("기간", min_value=1, max_value=100, value=20)
        std_dev = st.number_input("표준편차", min_value=1, max_value=5, value=2)
        line_color, line_width = _line_form("#0000FF", 2)

        if add_btn:
            indicator_dict = {
                'name': 'bollinger',
                'period': period,
                'std_dev': std_dev,
                'line_color': line_color,
                'line_width': line_width
            }
            # 선택한 인디케이터 저장
            st.session_state['indicators'].append(indicator_dict)

    # 삭제 버튼 추가
    if st.session_state['indicators']:
_add_delete_btn()- 기본적으로 streamlit은 상태를 유지하지 않는다.
- 버튼들을 여러 개 생성한 후 하나를 클릭할 때 마다 전체 버튼의 상태값을 출력하면, 마지막에 클릭한 버튼만 True값을 출력하는 것을 알 수 있다.
💡session_state를 이용하면 페이지 간 상태값을 전달할 수 있다.
- Dictionary와 유사하게 key-value 쌍으로 구성하여 접근할 수 있다.
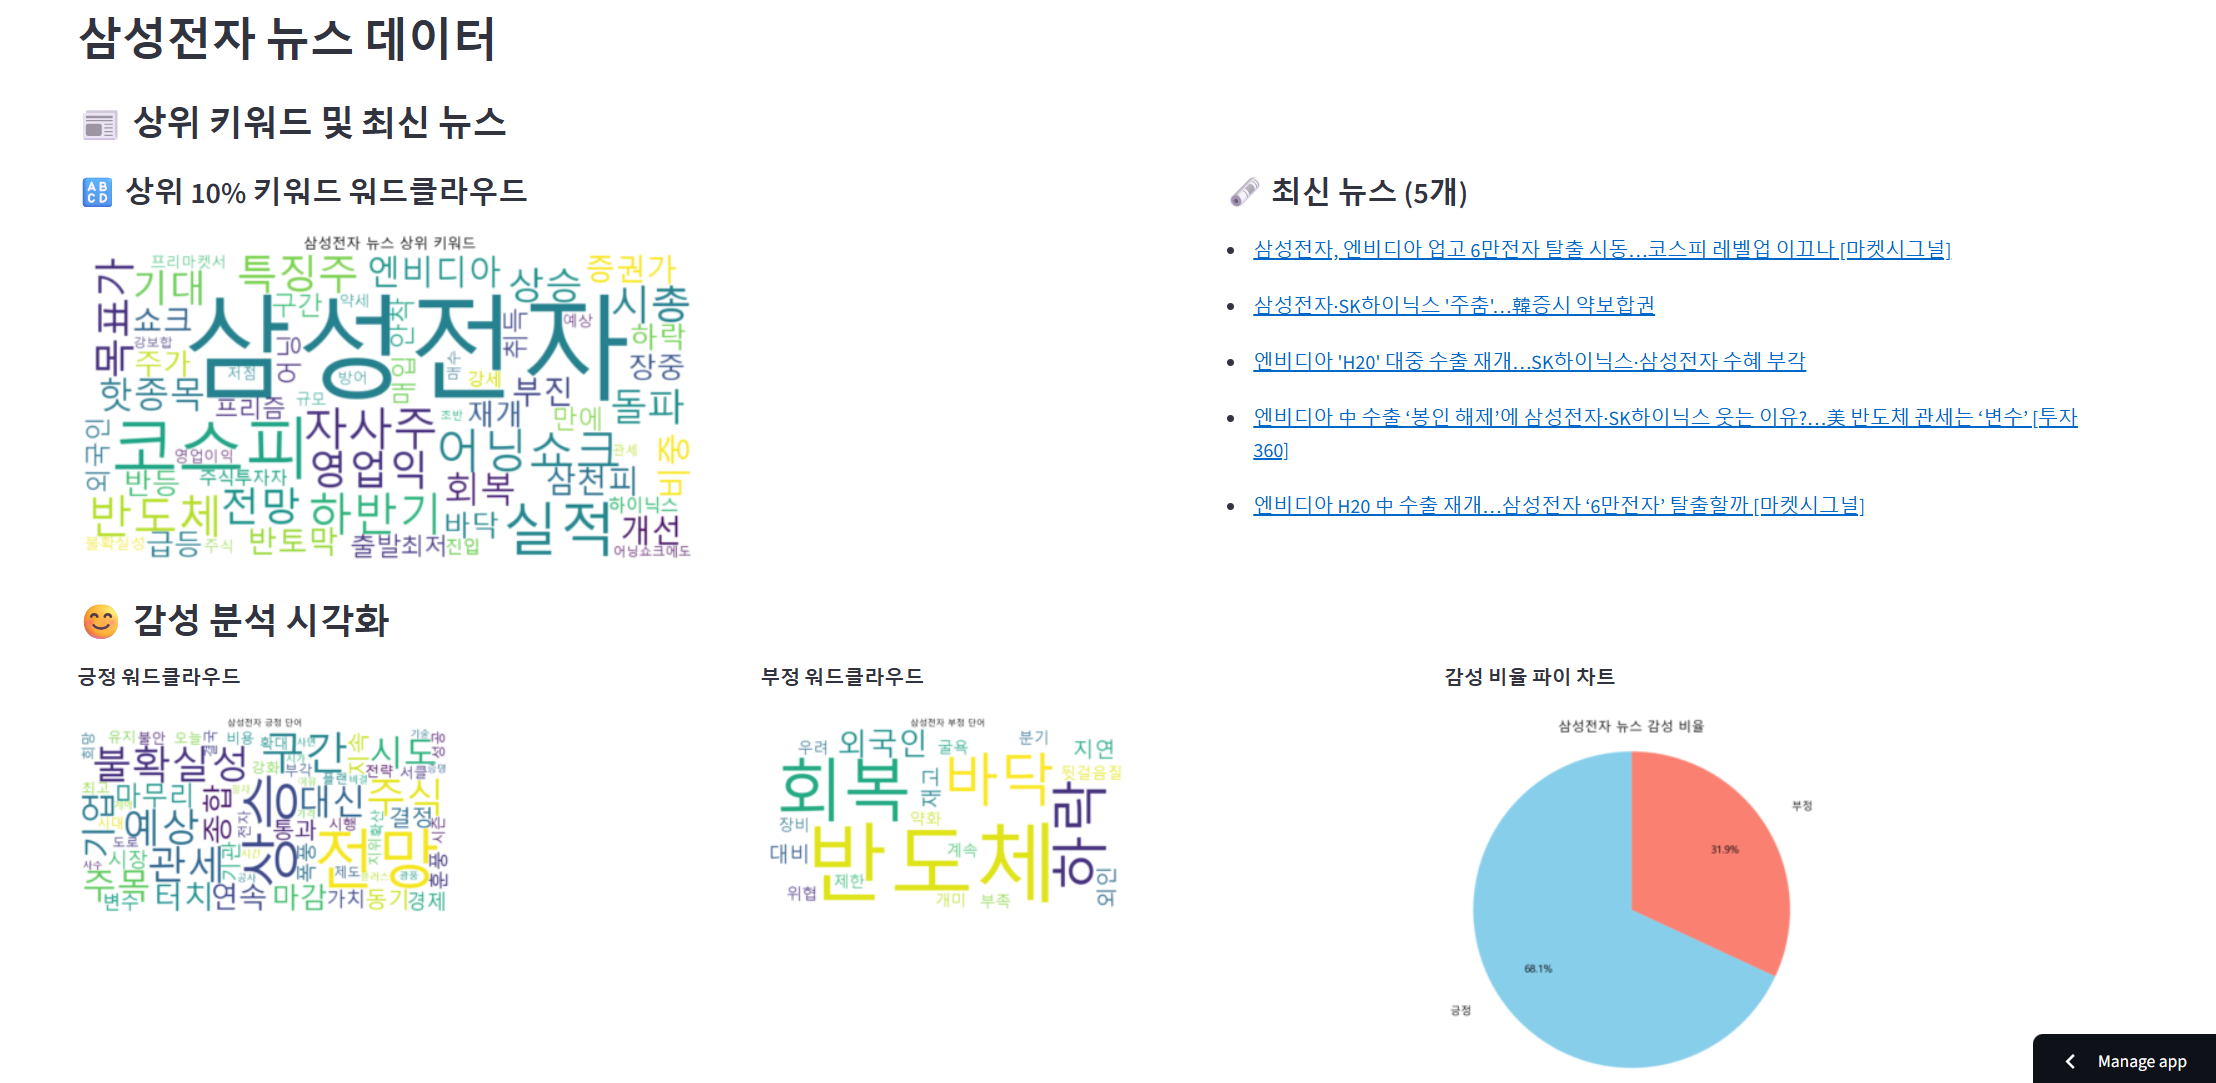
뉴스 데이터 시각화
- 팀원이 개발한 내용이다.
- 뉴스 데이터 크롤링의 경우 시간 제약으로 시각 총액 상위 50위 종목에 대하여 한 달치 네이버 뉴스를 크롤링하는 것으로 정했다.
- 워드 카운트를 통해 워드 클라우드를 구성했다.
- 이미 만들어진 긍정어/부정어 매핑 정보를 이용하여 긍정 및 부정 워드 클라우드를 구성했다.
- 사용자가 원본 뉴스에 접근할 수 있도록 네이버 뉴스 링크를 제공했다.