Monitoring Host with Grafana & Prometheus in Docker
Centos 환경에서 Grafana와 Prometheus, Node-exporter로 Hostos 자원을 모니터링하는 방법
각 구성요소
- Hostos : Centos7
- Prometheus : monitoring 도구
- Grafana : 모니터링을 위한 플랫폼
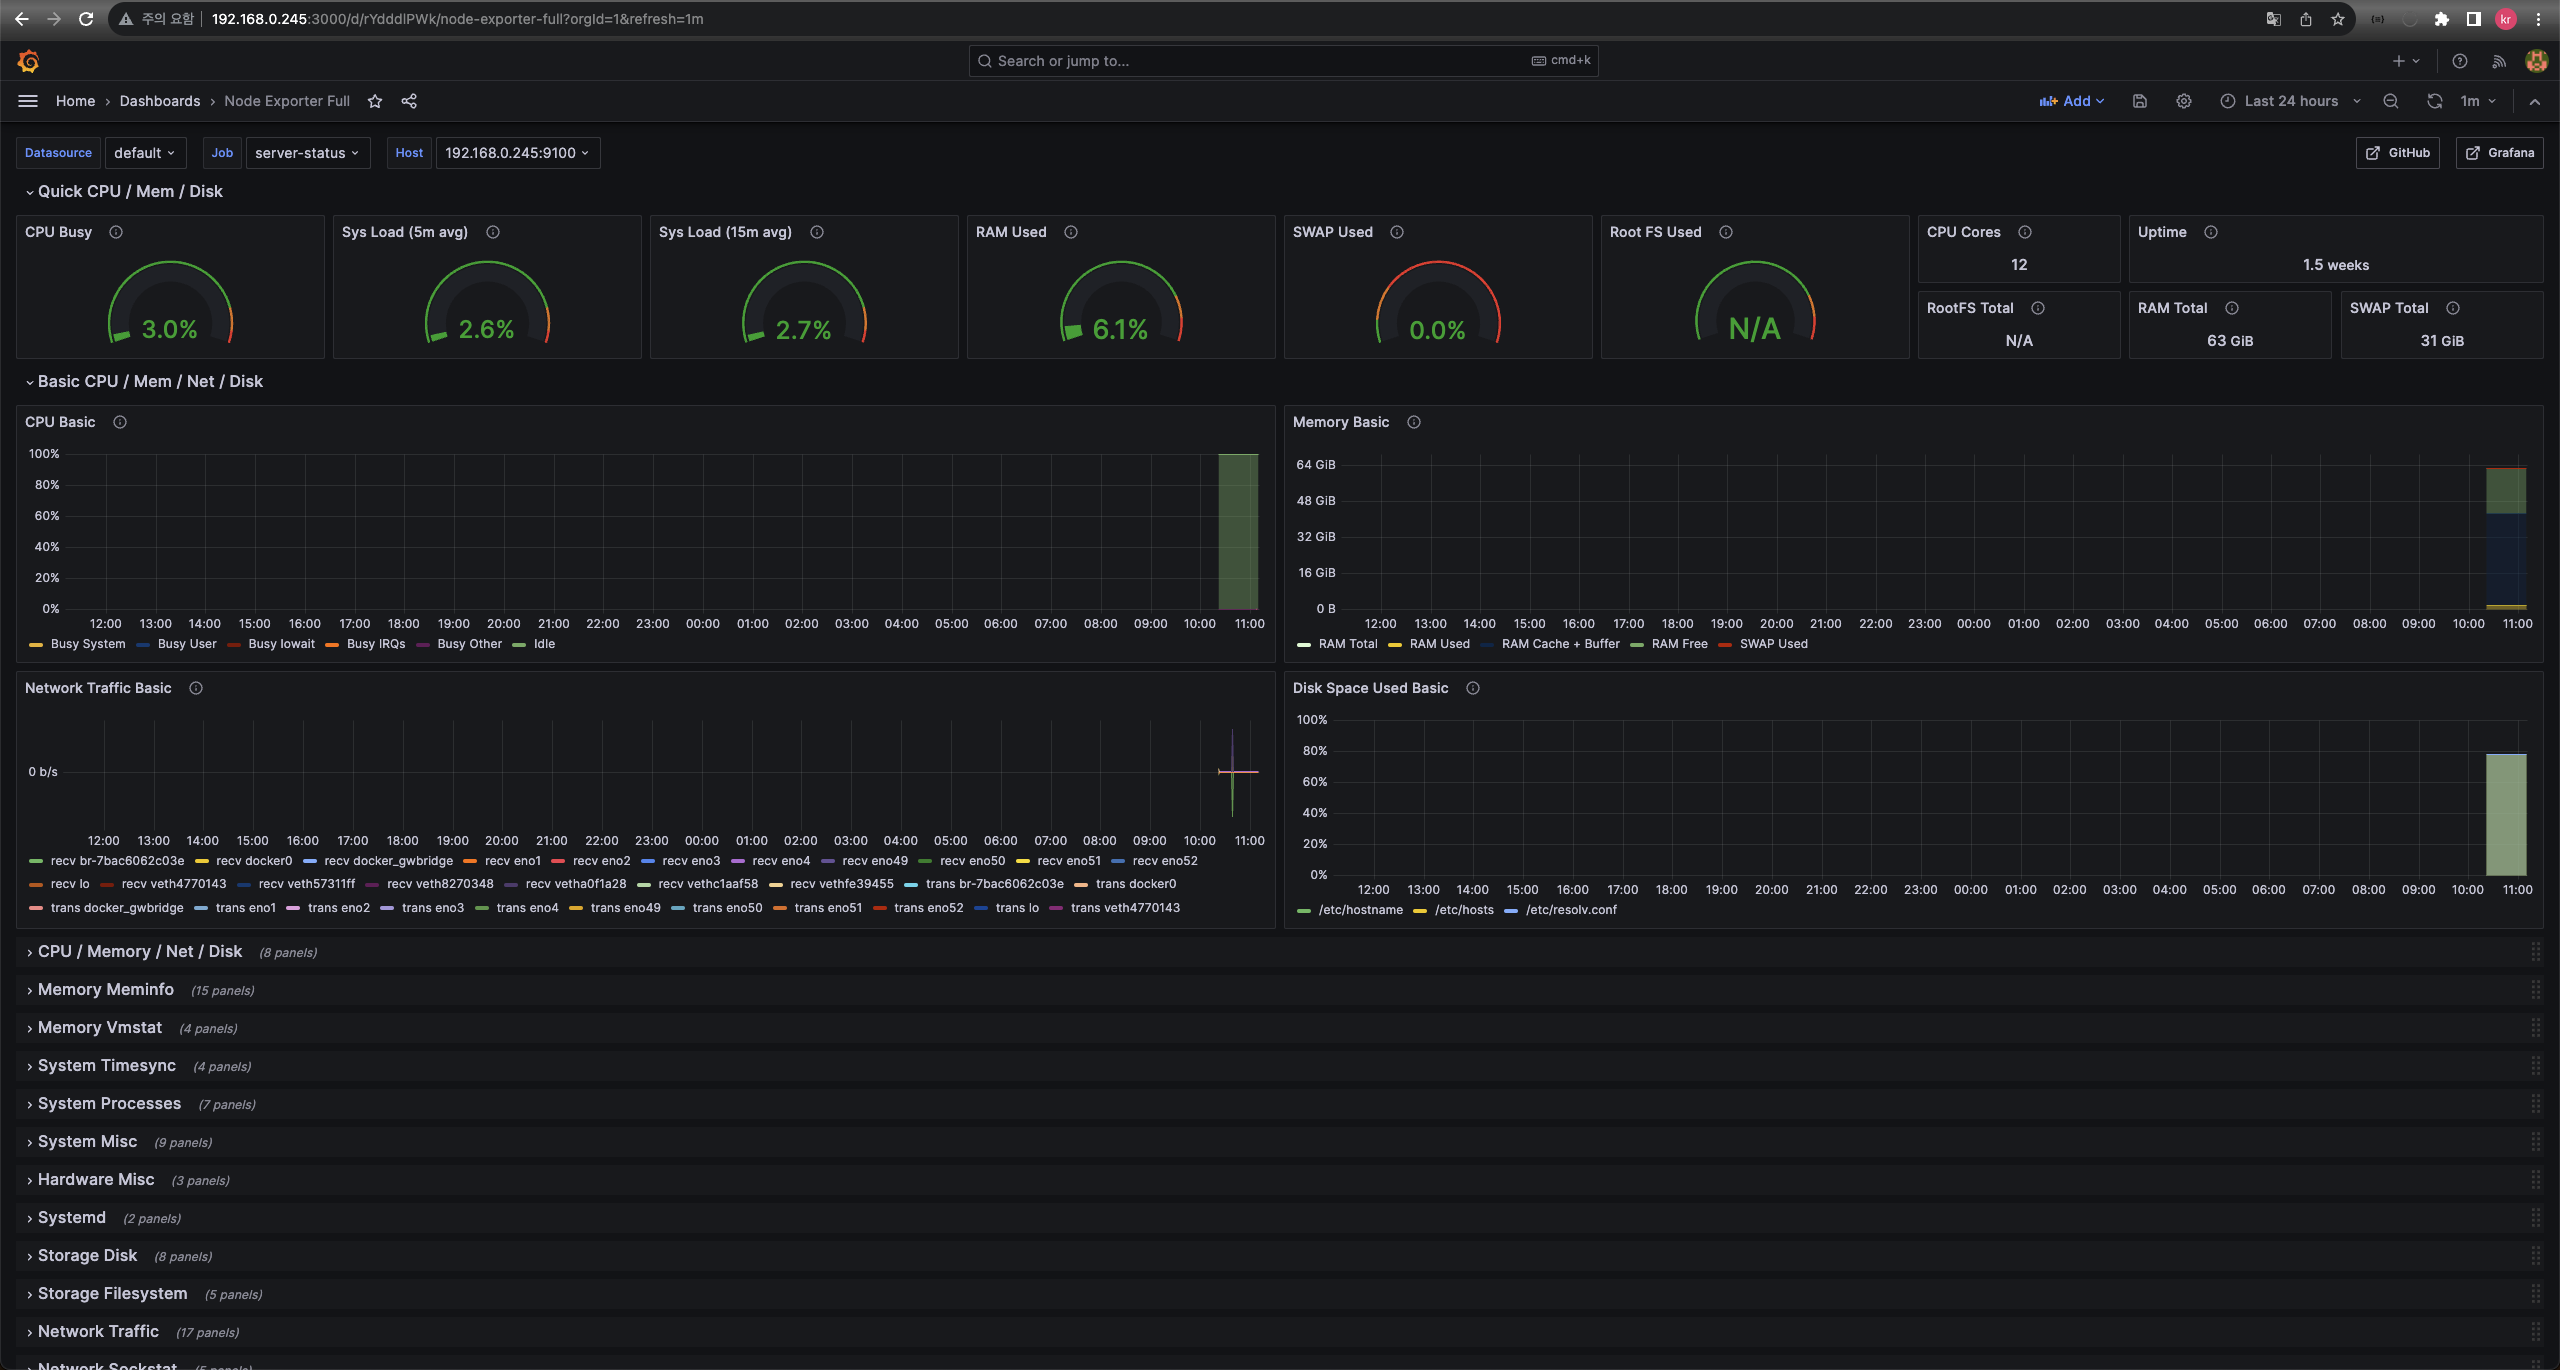
- Node Exporter : Prometheus에 시스템 자원 지표제공
Prometheus 설정
- Prometheus.yml 파일생성
vi /home/monitor/prometheus.yml

# my global config
global:
  scrape_interval: 15s # Set the scrape interval to every 15 seconds. Default is every 1 minute.
  evaluation_interval: 15s # Evaluate rules every 15 seconds. The default is every 1 minute.
  # scrape_timeout is set to the global default (10s).

# Alertmanager configuration
alerting:
  alertmanagers:
    - static_configs:
        - targets:
          # - alertmanager:9093

# Load rules once and periodically evaluate them according to the global 'evaluation_interval'.
rule_files:
  # - "first_rules.yml"
  # - "second_rules.yml"

# A scrape configuration containing exactly one endpoint to scrape:
# Here it's Prometheus itself.
scrape_configs:
  # The job name is added as a label `job=<job_name>` to any timeseries scraped from this config.
  - job_name: "prometheus"

    # metrics_path defaults to '/metrics'
    # scheme defaults to 'http'.

    static_configs:
- targets: ["localhost:9090"]- Prometheus 실행
docker run -d -p 9090:9090 -v /home/sw/monitor/prometheus.yml:/etc/prometheus/prometheus.yml prom/prometheusGrafana 설정
- Grafana 실행
docker run -d -p 3000:3000 grafana/grafana- 외부접속 확인
만약 방화벽을 사용중이라면 3000번 포트 개방해주어야 함
Node-exproter 실행
docker run -d -p 9100:9100 --net="host" quay.io/prometheus/node-exporterWith the host network mode, the Node Exporter is binding to the host’s network namespace, and it can be accessed on localhost from other containers on the same host.
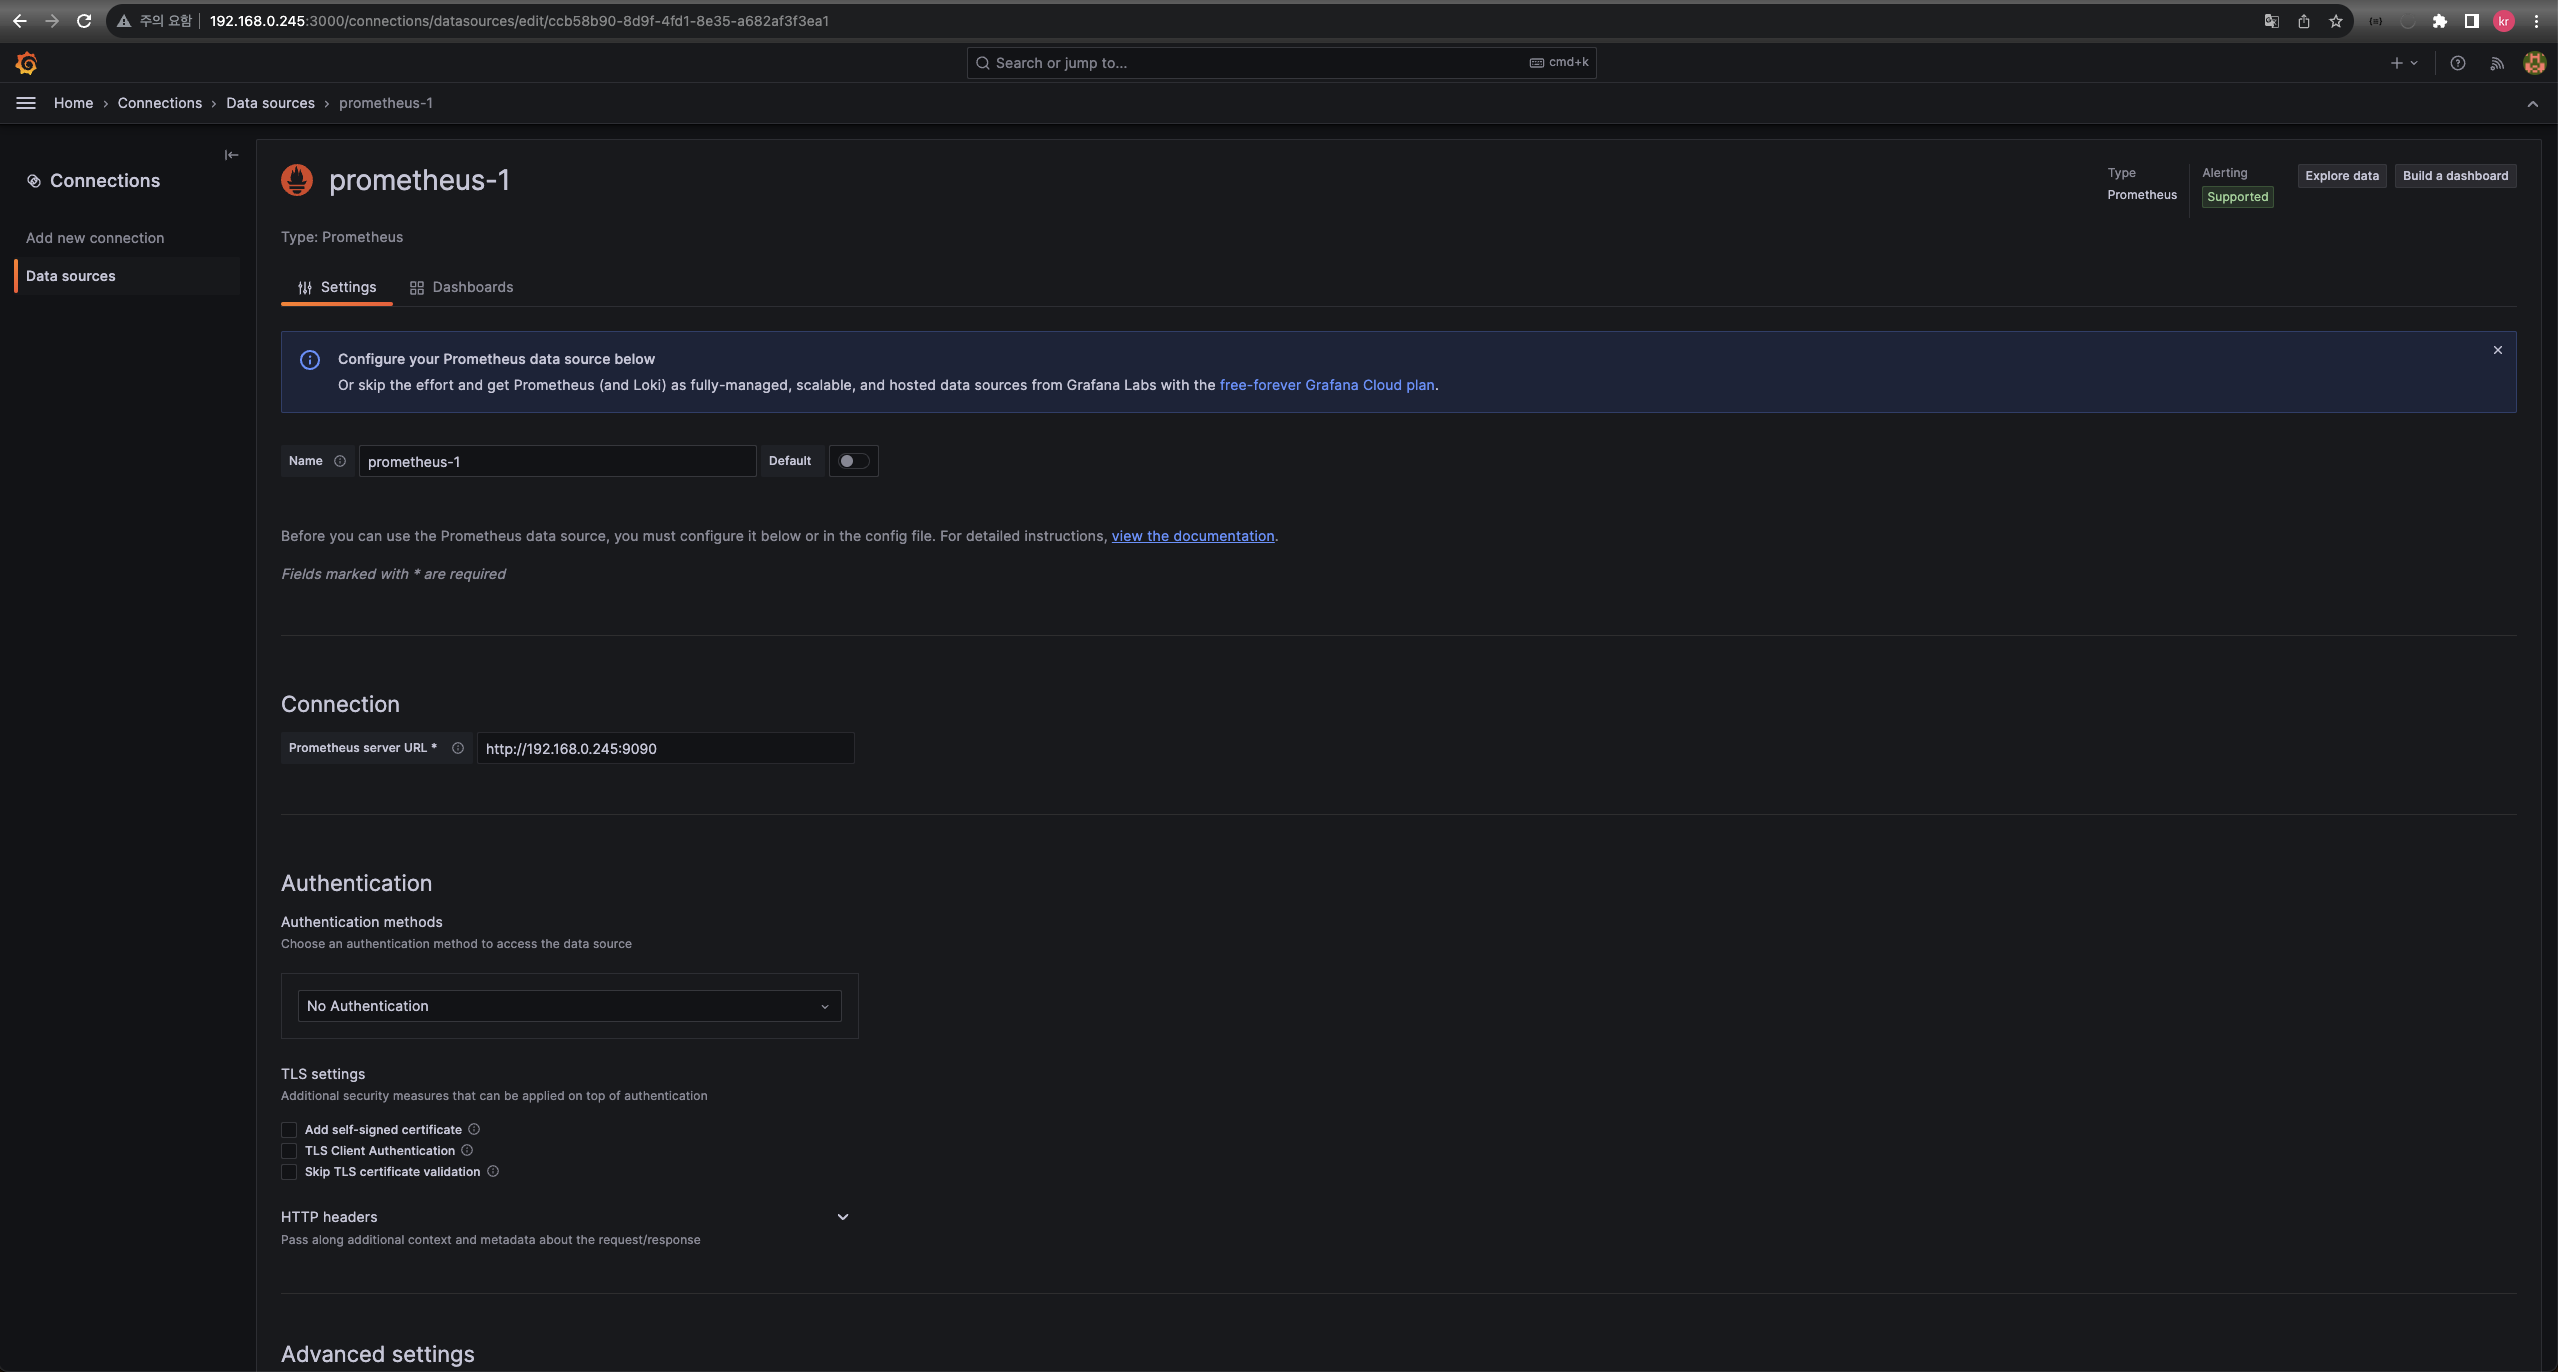
- Add a new job to Prometheus yaml
#추가
  - job_name: "server-status"

    # metrics_path defaults to '/metrics'
    # scheme defaults to 'http'.

    static_configs:
- targets: ["192.168.0.245:9100"]- Prometheus 재시작
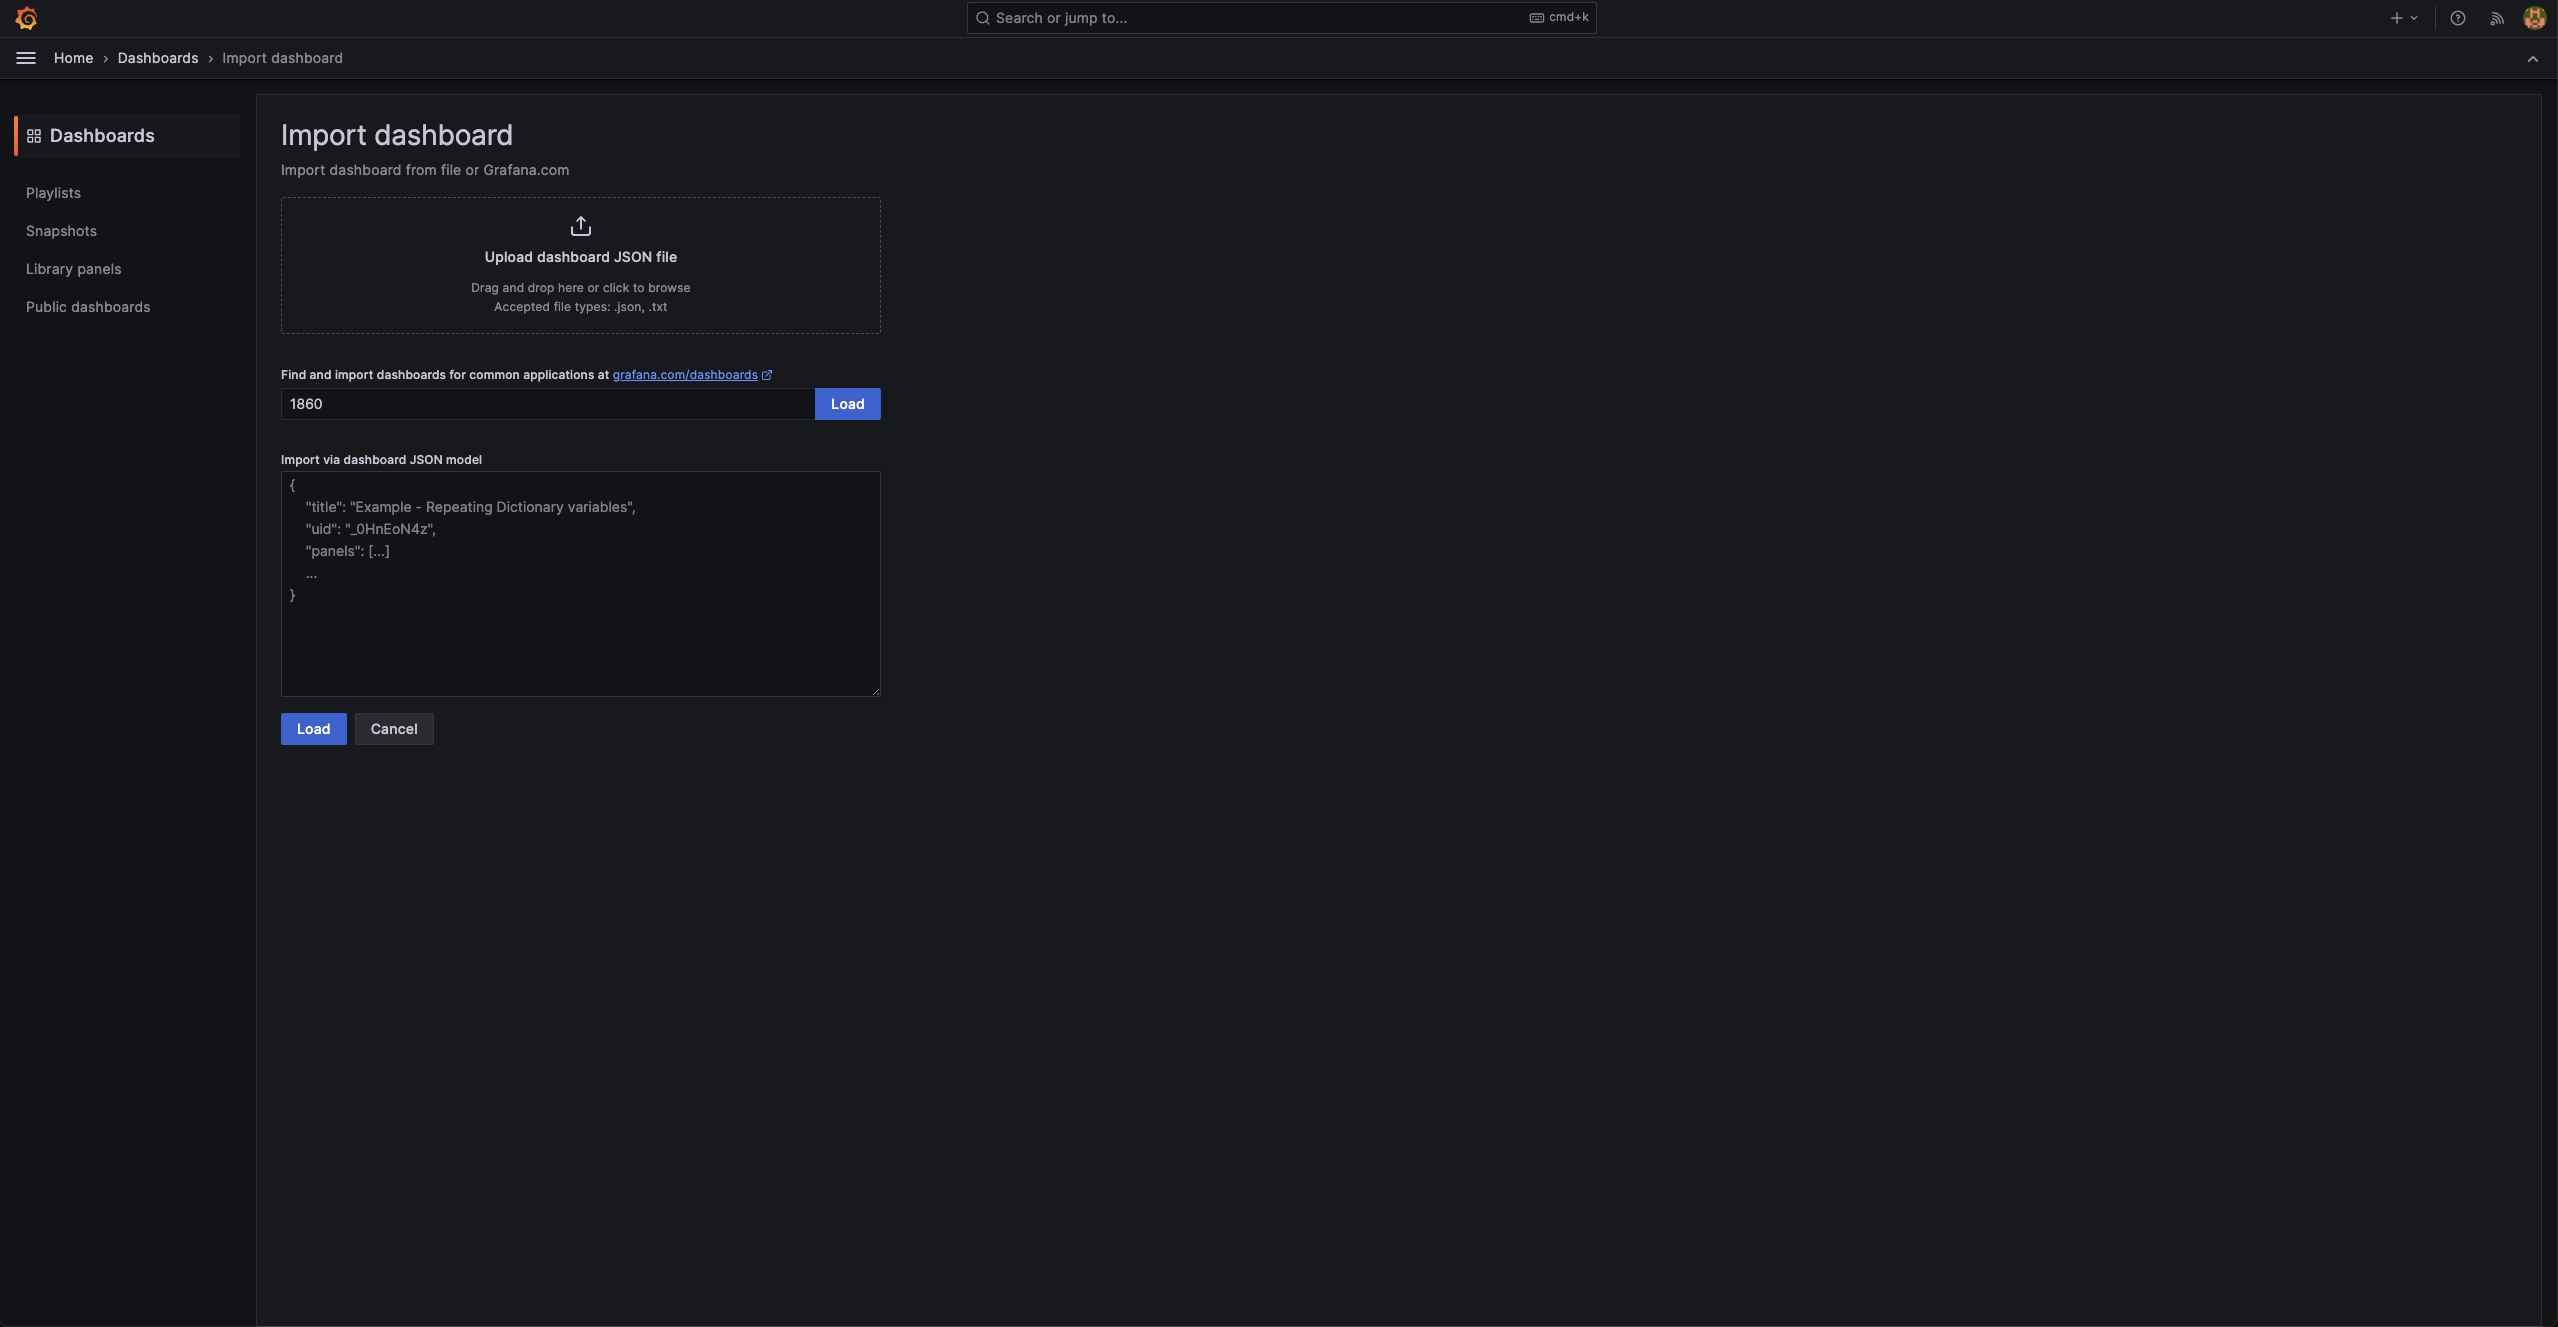
docker restart 301343b01ce3Grafana 구성

끊임없이 노력하는 개발자