모니터링과 보안
모니터링
- 시스템의 성능, 가용성, 안정성을 지속적으로 감시하여 잠재적인 문제를 빠르게 대응할 수 있게 하기 위해 필수적인 요소.
- 병목 현상이나 리소스 낭비를 식별하고 해결하여 시스템의 전체 효율을 높일 수 있다.
보안
- 다양한 위협요인에 대응하기 위해 강력한 인증 및 권한 부여 매커니즘이 필요함.
- 정기적인 보안 점검 및 취약성 테스트로 시스템의 보안 상태를 평가하고, 보안 취약점을 사전에 보강할 수 있다.
모니터링 시스템
모니터링의 중요성
- 문제 예방
- 빠른 대응
- 성능 최적화
- 사용자 경험 향상
- 비즈니스 연속성: 시스템 가용성을 보장해 비즈니스 운영의 연속성을 유지할 수 있다.
모니터링의 범위
- 서버 모니터링: CPU, 메모리, 디스크 사용량, 네트워크 트래픽 등 서버 자원 사용을 모니터링.
- 애플리케이션 모니터링: 애플리케이션의 상태, 성능, 로그 등을 모니터링.
- 네트워크 모니터링: 네트워크 트래픽, 대역폭 사용량, 네트워크 지연 등을 모니터링.
- 데이터베이스 모니터링: 쿼리 성능, 연결 수, 데이터베이스 사용량 등을 모니터링.
- 보안 모니터링: 보안 이벤트, 침입 시도, 취약점 등을 모니터링함.
Spring Boot Actuator
Spring Boot 애플리케이션의 상태와 동작을 모니터링하고 관리할 수 있도록 다양한 기능을 제공하는 모듈. 이를 통해 애플리케이션의 상태를 실시간으로 확인하거나 진단 정보를 쉽게 수집할 수 있음
주요 기능
-
엔드포인트: 다양한 엔드포인트를 통해 애플리케이션의 상태 및 메트릭을 제공함
/actuator/health: 애플리케이션의 상태를 확인함(Up/Down)/actuator/metrics: JVM, CPU, 메모리, 힙 사용량 등 다양한 메트릭 제공/actuator/env: 환경 변수 및 설정 속성 확인/actuator/loggers: 애플리케이션 로거 수준 변경 및 확인/actuator/beans: Spring 컨텍스트에서 관리되는 빈 정보/actuator/threaddump: 현재 스레드 덤프 정보 제공/actuator/mappings: 애플리케이션의 URL 매핑 정보/actuator/info: 사용자 정의 애플리케이션 정보 출력/actuator/httptrace: 최근 HTTP 요청 및 응답을 추적
-
메트릭 수집
- 기본적으로 Micrometer를 사용해 애플리케이션 메트릭을 수집하고 제공함
- 주요 메트릭: 요청 처리 시간, 데이터베이스 연결 상태, HTTP 요청 수, 오류 비율 등
- Prometheus, Graphite, InfluxDB 등과 연동해 모니터링 데이터를 시각화할 수 있음
-
상태 점검(Health Checks)
HealthIndicator인터페이스를 통해 애플리케이션의 상태를 모니터링- DB 연결 상태, 메시지 브로커 상태, 캐시 서비스 상태 등
- 커스텀
HealthIndicator를 구현하여 맞춤형 상태 점검 로직을 추가할 수도 있음
-
설정 및 커스터마이징
- 특정 엔드포인트를 활성화하거나 비활성화 가능
- 엔드포인트의 노출 범위를 설정할 수 있음
- Spring Security와 통합해 엔드포인트 접근을 보호할 수 있음
적용하기
- 의존성 추가
implementation 'org.springframework.boot:spring-boot-starter-actuator'- application.properties(.yml) 에서 필요한 엔드포인트를 활성화할 수 있음
spring.application.name=sample

server.port=8080

management.endpoints.web.exposure.include=*
management.endpoint.health.show-details=always
모든 엔드포인트를 노출하는 것은 개발 및 테스트때는 유용할 수 있으나 운영 환경에서는 보안 위험을 증가시킬 수 있음
- 확인
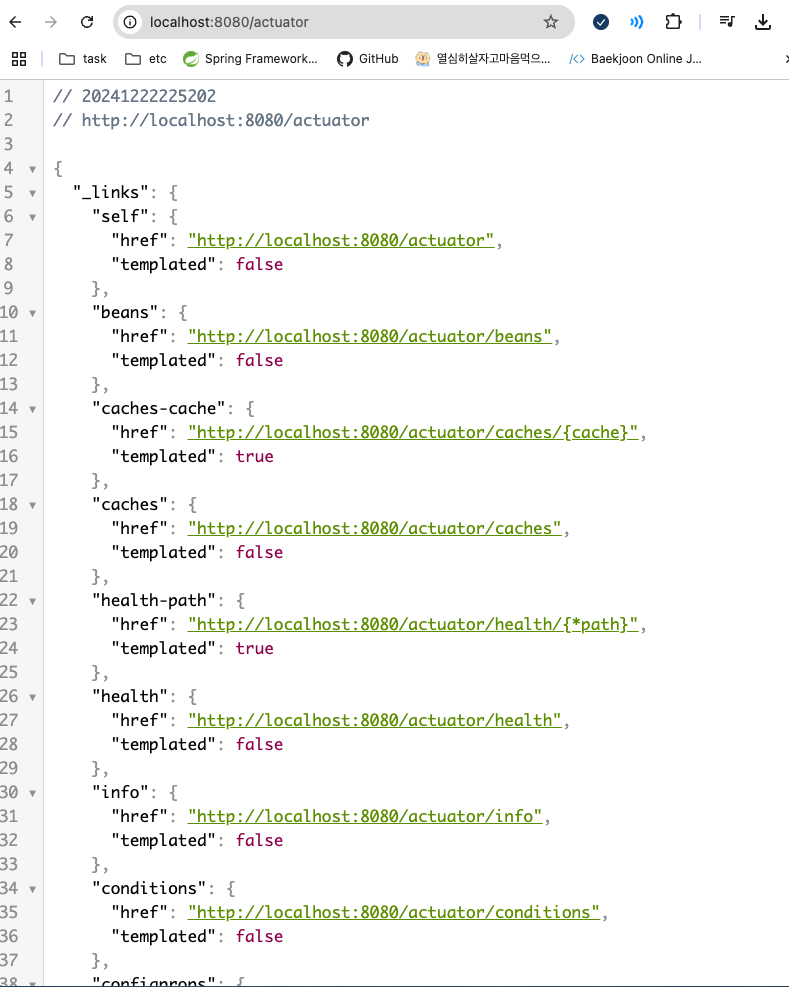
/actuator로 접근하면 내용을 확인할 수 있다.
각각의 링크에서 상세 정보 확인 가능.
Prometheus
오픈소스 시스템 모니터링 및 경고 도구.
시계열 데이터(Time-Series Data)를 수집하고 쿼리하는데 최적화되어 있음
확장성, 강력한 데이터 모델, 표현력있는 쿼리 언어(PromQL)가 장점
특징
-
시계열 데이터 저장
- 데이터를 시계열(Time-Series)로 저장함
- 데이터 구성
- Metric 이름: 측정 대상 이름
- Label: 데이터에 추가 정보를 제공하는 키-값 쌍
- Timestamp: 데이터가 수집된 시간
- Value: 데이터의 실제 측정값
-
Pull 방식 데이터 수집
- 모니터링 대상(Target)의 메트릭 데이터를 HTTP를 통해 주기적으로 가져옴
- Exporters를 통해 애플리케이션, 데이터베이스, 시스템 등 다양한 소스에서 데이터를 수집할 수 있음
-
PromQL (Prometheus Query Language)
- 데이터를 분석하거나 경고 조건을 정의할 수 있는 강력한 쿼리 언어
- 예시
rate(http_requests_total[5m]): 지난 5분동안의 HTTP 요청 속도sum by (status)(rate(http_requests_total[1m])): 상태별 HTTP 요청 속도의 합계
-
다양한 Exporter
- 다양한 Exporter를 통해 데이터를 수집할 수 있음
- Node Exporter: 서버의 CPU, 메모리, 디스크 등 리소스 정보를 수집
- Blackbox Exporter: HTTP, HTTPS, DNS 등의 외부 서비스 가용성을 체크
- MySQL Exporter, Redis Exporter: 데이터베이스 상태와 성능 지표 수집
- 다양한 Exporter를 통해 데이터를 수집할 수 있음
-
경고 및 알림
- Alertmanager와 통합해 경고를 생성하고 알림을 전송
- 이메일, Slack, PagerDuty 등의 알림 채널을 지원
-
시각화
- 자체적으로 간단한 시각화 UI를 제공
- 일반적으로 Grafana와 연동하여 더 직관적이고 사용자 정의 가능한 대시보드를 구성함
-
확장성
- 분산 아키텍처를 지원하지는 않지만, Federation(연합)을 통해 여러 Prometheus 서버를 계층적으로 구성 가능
- Prometheus Pushgateway를 사용해 Push 방식 데이터 수집도 지원(ex: 짧은 수명 작업의 메트릭)
구성 요소
- Prometheus Server: 시계열 데이터를 수집하고 저장하며, 쿼리를 처리.
- Exporters: 메트릭 데이터를 제공하는 엔드포인트. (ex: Node Exporter)
- Alertmanager: 경고를 처리하고 알림을 전송.
- Pushgateway: Push 방식으로 데이터를 수집할 때 사용.
- Service Discovery: 동적으로 모니터링 대상(Target)을 탐지.
- Grafana: Prometheus 데이터를 시각화하기 위해 많이 사용되는 대시보드 도구.
장단점
장점
- 오픈소스이면서도 강력한 기능을 제공함.
- 높은 표현력을 가진 PromQL 제공.
- 다양한 Exporter로 광범위한 모니터링 가능.
- 경고 및 알림 기능 내장.
- Grafana와 연동해 시각화를 쉽게 구현.
단점
- 분산 데이터 저장 기능이 기본적으로 지원되지 않음.
- Push 방식보다는 Pull 방식에 최적화.
- 큰 데이터 볼륨을 처리할 때 스토리지 관리가 필요함.
적용하기
- 의존성 추가
runtimeOnly 'io.micrometer:micrometer-registry-prometheus'- applictaion.properties(.yml) 수정
management.endpoint.prometheus.enabled=true강의에서 위의 방법을 제공하였지만 deprecated된 속성임.
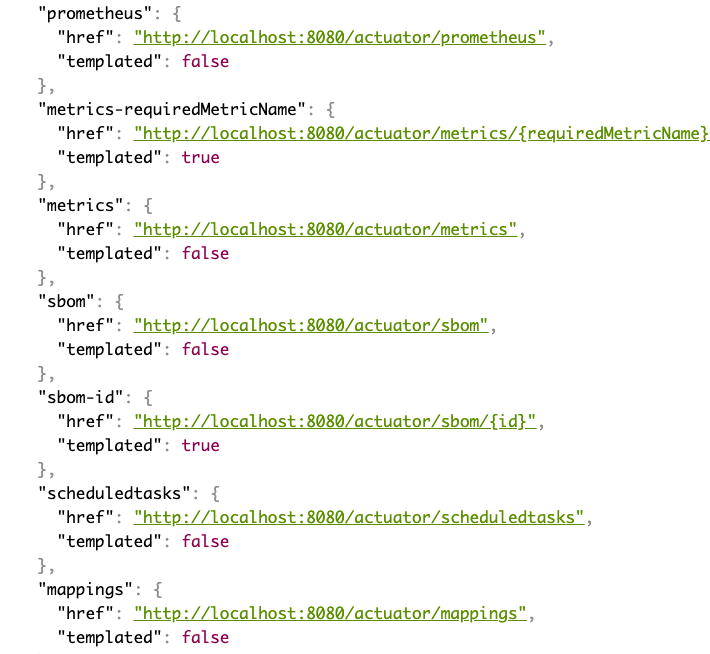
# prometheus 관련 엔드포인트만 활성화
management.endpoints.web.exposure.include=prometheus

# 모든 엔드포인트 활성화
management.endpoints.web.exposure.include=*/acutator로 접근 시 prometheus 항목을 찾아볼 수 있다.
- prometheus 설정 파일 작성
프로젝트 루트에 작성.
global:
  scrape_interval: 15s

scrape_configs:
  - job_name: 'spring-boot'
    metrics_path: '/actuator/prometheus'
    static_configs:
- targets: ['host.docker.internal:8080']- prometheus 실행
9090포트로 실행해줬다.

9090으로 접속 시 prometheus 대시보드를 확인할 수 있다.

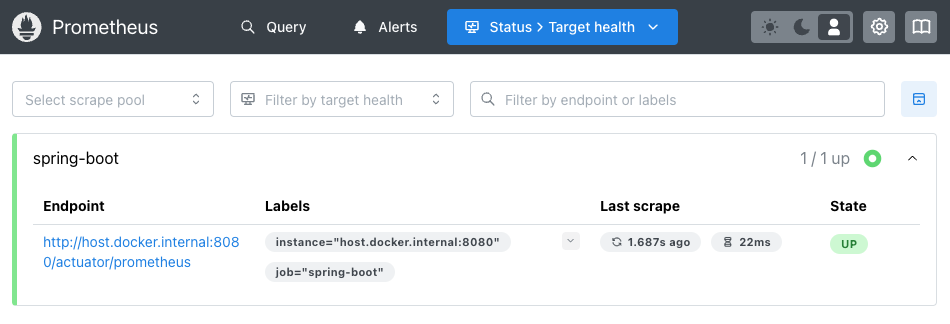
애플리케이션 상태를 확인할 수 있다.
Grafana
오픈소스 데이터 시각화 및 모니터링 플랫폼
다양한 데이터 소스를 연결하여 대시보드 형태로 데이터를 시각화하고 분석할 수 있음
Prometheus와 같은 시계열 데이터베이스와 자주 함께 사용되며 클라우드 환경이나 DevOps 도구로 많이 활용됨
특징
- 데이터 시각화
- 다양한 그래프와 차트를 제공하며, 대시보드를 통해 데이터를 직관적으로 표현 가능
- 사용자 정의 위젯, 경고 시스템, 필터 등을 활용해 데이터를 깊이 분석할 수 있음
- 다양한 데이터 소스 지원
- 여러 데이터 소스를 연결하여 통합 시각화를 제공함
- 시계열 데이터베이스: Prometheus, InfluxDB, Graphite
- 로그 관리: Elasticsearch, Loki
- 클라우드 플랫폼: AWS CloudWatch, Google Cloud Monitoring, Azure Monitor
- 일반 데이터베이스: MySQL, PostgreSQL, Microsoft SQL Server
-
대시보드
- 데이터를 실시간으로 모니터링하거나 과거 데이터를 분석하는 데 유용함
- 사용자 정의가 가능한 템플릿 및 플러그인을 제공하여 다양한 요구에 맞게 구성할 수 있음
-
경고
- 사용자 정의 경고 조건을 설정해 이메일, Slack, PagerDuty 등의 알림 채널로 알림을 전송
- 데이터 소스에 따라 PromQL(Prometheus Query Language), SQL 등의 쿼리를 사용하여 경고 조건을 설정할 수 있음
-
사용자 관리 및 권한 제어
- 팀과 프로젝트에 따라 사용자 그룹을 만들고 대시보드 접근 권한을 제어 가능
- 인증 및 권한 관리 기능이 내장되어있어 보안 강화
-
플러그인 생태계
- 플러그인으로 다양한 기능 확장 가능(데이터 소스, 시각화, 패널 플러그인)
주요 사용 사례
- 애플리케이션 및 서버 모니터링
- Prometheus와 함께 사용하여 CPU, 메모리, 디스크 사용량 등 시스템 메트릭을 모니터링.
- Kubernetes 클러스터 상태를 모니터링.
- 로그 관리
- Loki와 함께 사용하여 애플리케이션 로그를 시각화하고 분석.
- 클라우드 리소스 모니터링
- AWS, Google Cloud, Azure 등의 클라우드 리소스를 통합적으로 모니터링.
- 데이터베이스 성능 분석
- MySQL, PostgreSQL 등의 데이터베이스 성능 및 쿼리 통계를 분석.
- 비즈니스 데이터 시각화
- 비즈니스 성과 지표(KPI), 트래픽 분석, 사용자 행동 분석 등 비즈니스 관련 데이터를 시각화.
장단점
장점
- 강력한 시각화 도구: 사용자 정의 가능한 다양한 시각화 스타일 제공
- 다양한 데이터 소스 지원
- 유연성: 플러그인과 템플릿을 통해 확장 가능
- 오픈소스
단점
- 초기 설정의 복잡성
- 리소스 사용량: 대규모 데이터 소스를 처리할 때 높은 메모리와 CPU를 소모할 수 있음
적용하기
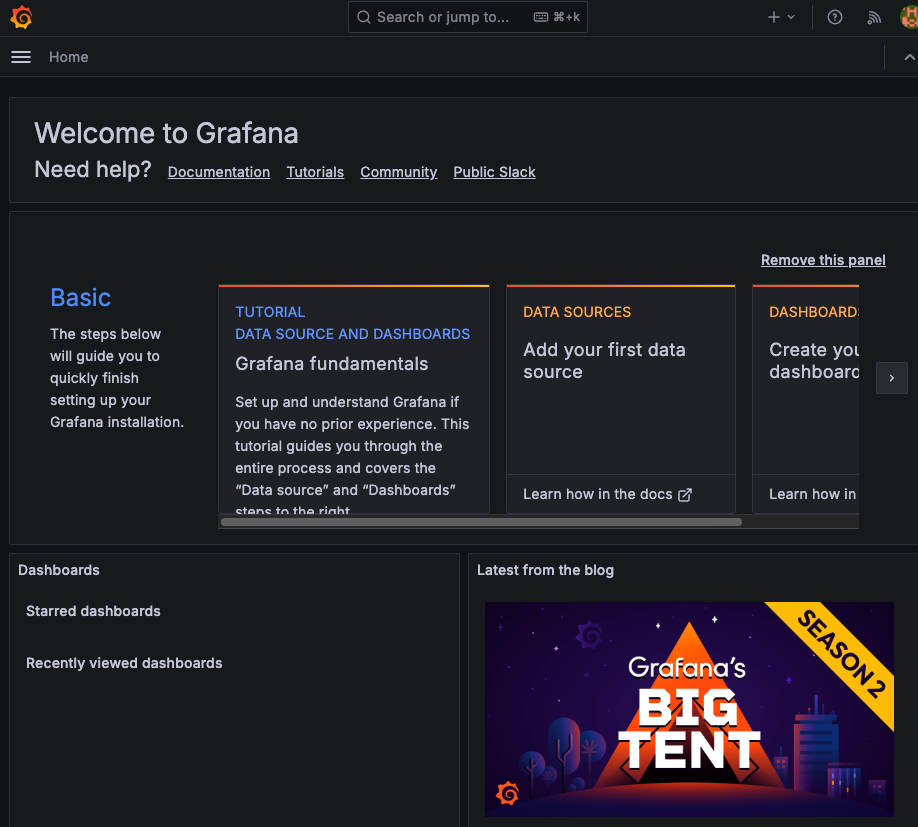
- Grafana 실행하기
Docker로 3000번 포트에서 실행함.
localhost:3000으로 접속하면 로그인 후 대시보드를 확인할 수 있다.
기본 id, password는 admin
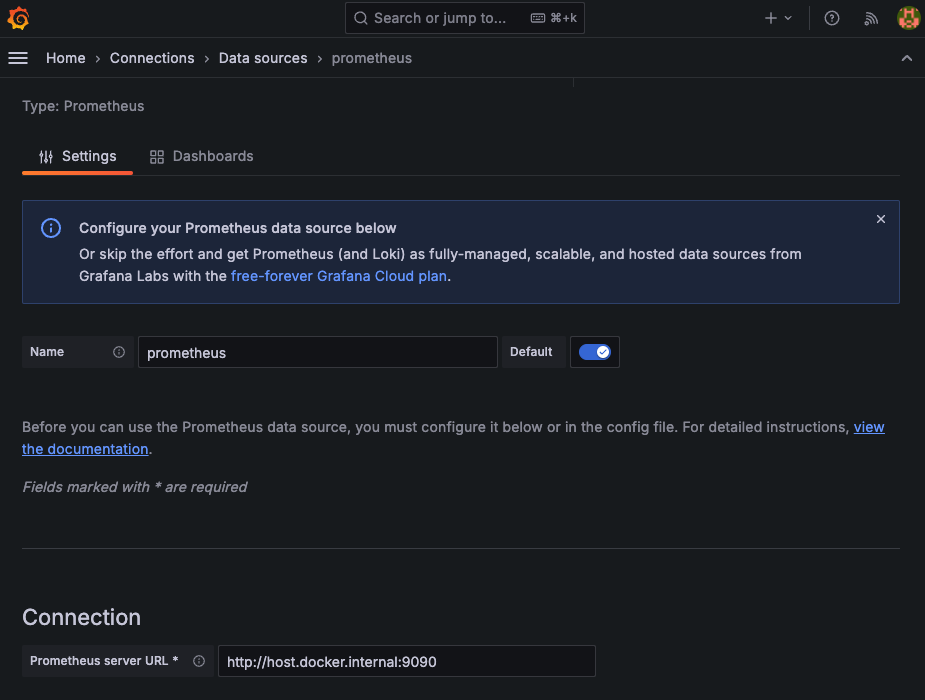
- Data source 추가
아까의 Prometheus를 추가해준다.
- 대시보드 만들기
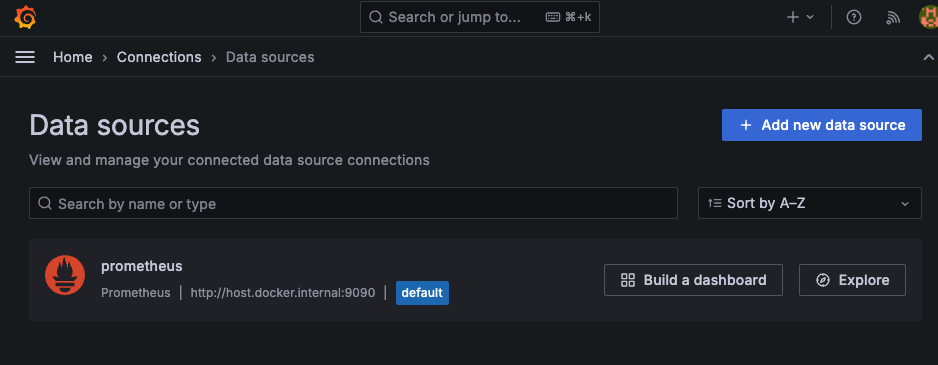
data source 목록에서 추가한 prometheus를 찾을 수 있다.
build a dashboard 클릭
https://grafana.com/grafana/dashboards/ 에서 적당한 대시보드를 골라 import해준다.
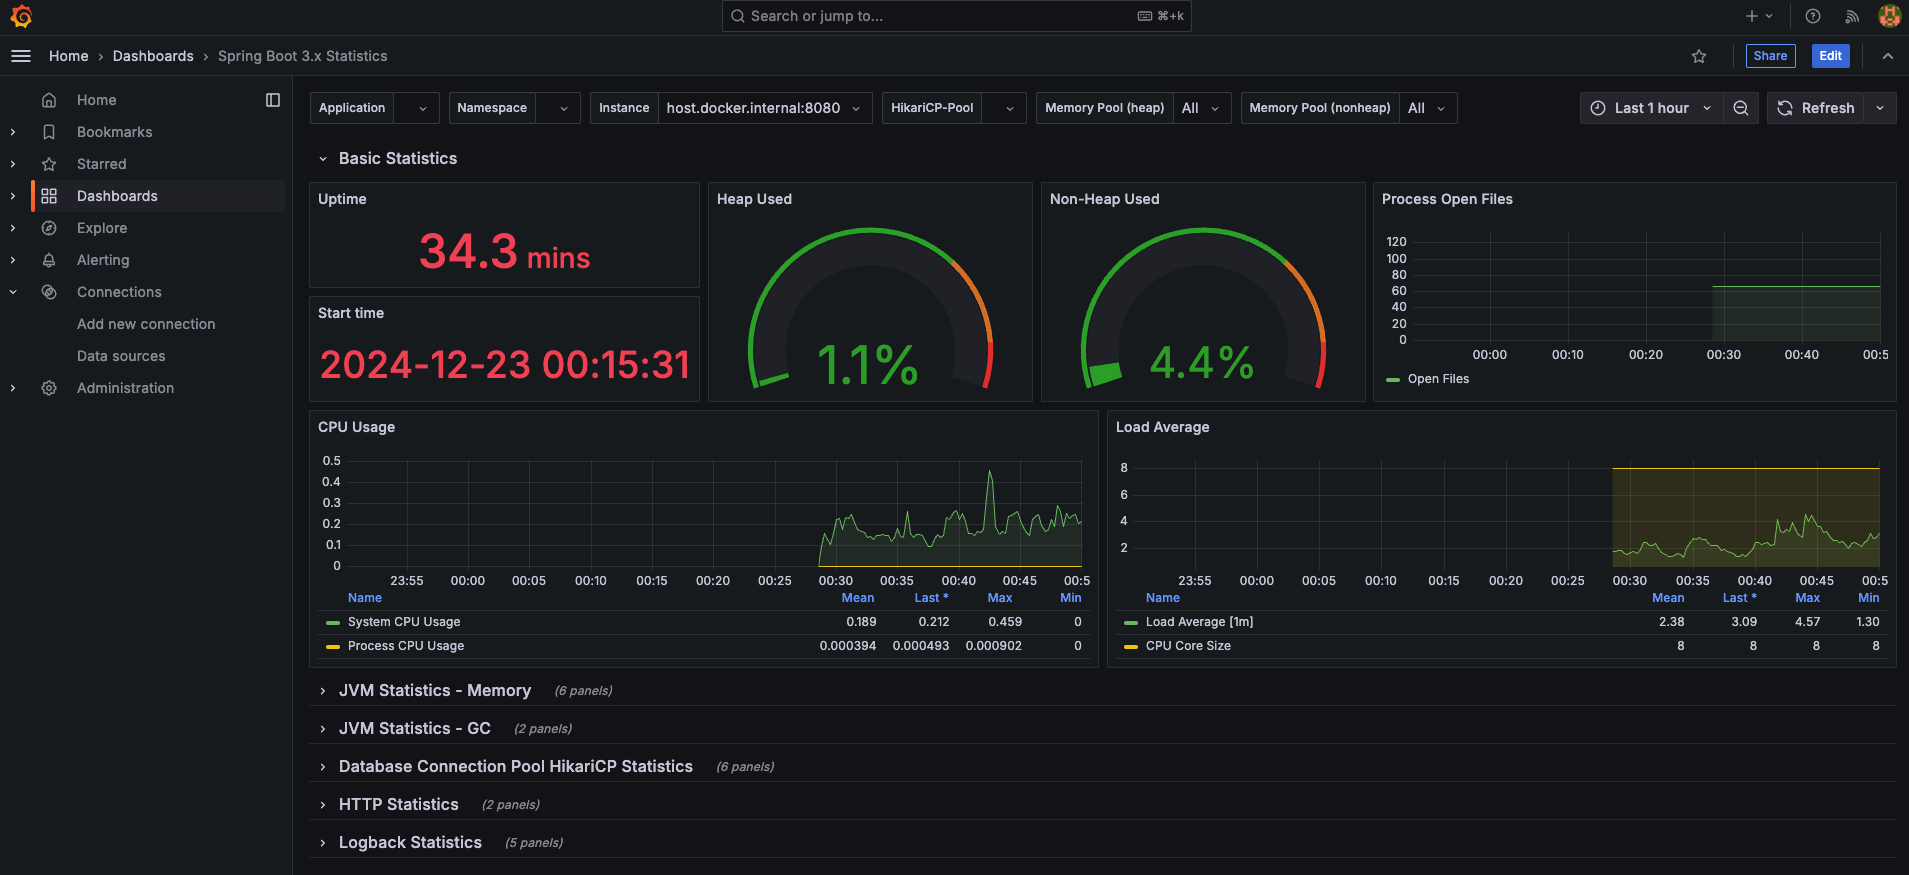
시각화된 데이터를 확인할 수 있다.
애플리케이션 로그 모니터링
Loki
Grafana Labs에서 개발한 오픈소스 로그 집계 시스템
Prometheus와 유사한 방식으로 작동하지만 로그 데이터를 위한 시스템이라는 점에서 차이가 있음
로그를 효율적으로 수집, 저장, 검색할 수 있도록 설계됨
로그의 시계열 데이터베이스
특징
-
경량 설계
- 로그를 색인화하지 않고 메타데이터만 색인화하여 운영 비용을 줄임
- 로그 메시지 자체는 저장소에 원본 그대로 저장되며, 메타데이터(라벨 기반으로 검색)만 관리
-
라벨 기반 검색
- 로그데이터를 Prometheus의 라벨(label) 개념과 유사하게 관리함
- 라벨은 다음과 같은 메타데이터를 포함할 수 있음
- job: 애플리케이션 이름
- instance: IP 주소 또는 호스트 이름
- namespace: Kubernetes 네임스페이스
-
Prometheus와의 연동
- 동일한 라벨 시스템을 사용하여 시계열 메트릭스와 로그를 쉽계 연관
-
Grafana와 통합
- Grafana와 긴밀한 통합으로 로그를 시각화하고 분석할 수 있음
- Grafana에서 Loki 데이터를 쿼리하거나 메트릭 대시보드에 로그 패널을 추가 가능
-
수집 및 저장
- 다양한 로그 소스에서 데이터를 수집할 수 있음(애플리케이션 로그, 시스템 로그, Docker 로그, Kubernetes 로그 등)
- 로그 데이터는 로컬 디스크, 클라우드 스토리지(S3, GCS) 등에 저장 가능
-
쿼리 언어 (LogQL)
- Log Query Language이라는 강력한 쿼리 언어를 사용하여 로그를 검색 및 분석함
-
분산 및 확장성
- 클러스터링과 분산 환경에서 동작 가능
- 저장소와 색인화를 분리하여 확장성 제공
구성 요소
- Loki 서버: 로그 수집 및 저장, 쿼리 처리
- Promtail: 기본 로그 수집기. 로그 파일을 읽어 Loki에 전송함. Kubenetes, Docker 등에서 로그를 자동으로 태깅
- Grafana: Loki의 로그를 시각화하고 분석하는 도구
- Fluentd/Fluent Bit: Loki와 함께 사용 가능한 서드파티 로그 수집기
주요 사용 사례
1.애플리케이션 로그 분석: Kubernetes, Docker 컨테이너, 마이크로서비스의 애플리케이션 로그 수집 및 분석
2. 문제 디버깅: 특정 시간대에 발생한 오류 로그를 검색하고 관련된 메트릭과 연관 분석
3. 운영 모니터링: CPU/메모리 메트릭과 로그 데이터를 연계하여 시스템 상태를 포괄적으로 모니터링
4. Kubernetes 환경: Kubernetes의 Pod, 네임스페이스, 애플리케이션 등에서 생성된 로그를 효율적으로 수집하고 분석
loki-logback-appender
- logback을 사용하는 Java 애플리케이션에서 로그를 Loki로 직접 전송하기 위한 라이브러리
- 별도의 Promtail 설정 없이도 로그를 Loki로 보낼 수 있게 해줌
적용하기
- 의존성 추가
implementation 'com.github.loki4j:loki-logback-appender:1.5.1'- logback.xml 작성
<configuration>
    <appender name="LOKI" class="com.github.loki4j.logback.Loki4jAppender">
        <http>
            <url>http://localhost:3100/loki/api/v1/push</url>
        </http>
        <format>
            <label>
                <pattern>app=my-app,host=${HOSTNAME}</pattern>
            </label>
            <message class="com.github.loki4j.logback.JsonLayout" />
        </format>
    </appender>

    <root level="DEBUG">
    <appender-ref ref="LOKI" />
    </root>
</configuration>- loki 설정 파일 작성
auth_enabled: false

server:
  http_listen_port: 3100
  grpc_listen_port: 9096

common:
  instance_addr: 127.0.0.1
  path_prefix: /tmp/loki
  storage:
    filesystem:
      chunks_directory: /tmp/loki/chunks
      rules_directory: /tmp/loki/rules
  replication_factor: 1
  ring:
    kvstore:
      store: inmemory

query_range:
  results_cache:
    cache:
      embedded_cache:
        enabled: true
        max_size_mb: 100

schema_config:
  configs:
    - from: 2020-10-24
      store: tsdb
      object_store: filesystem
      schema: v13
      index:
        prefix: index_
        period: 24h

ruler:
  alertmanager_url: http://localhost:9093

# By default, Loki will send anonymous, but uniquely-identifiable usage and configuration
# analytics to Grafana Labs. These statistics are sent to https://stats.grafana.org/
#
# Statistics help us better understand how Loki is used, and they show us performance
# levels for most users. This helps us prioritize features and documentation.
# For more information on what's sent, look at
# https://github.com/grafana/loki/blob/main/pkg/analytics/stats.go
# Refer to the buildReport method to see what goes into a report.
#
# If you would like to disable reporting, uncomment the following lines:
#analytics:
# reporting_enabled: false- Docker로 loki 실행
3100 포트로 실행해줬다.
3100으로 접속 시 ready 상태를 확인할 수 있다.

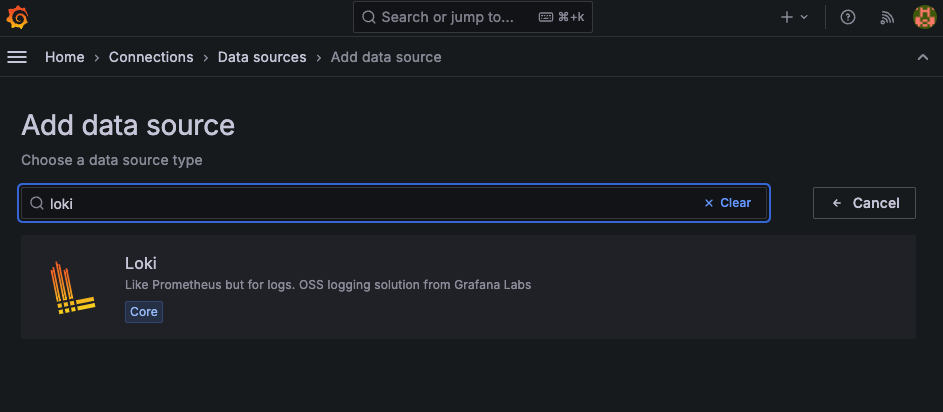
- Grafana data source 추가
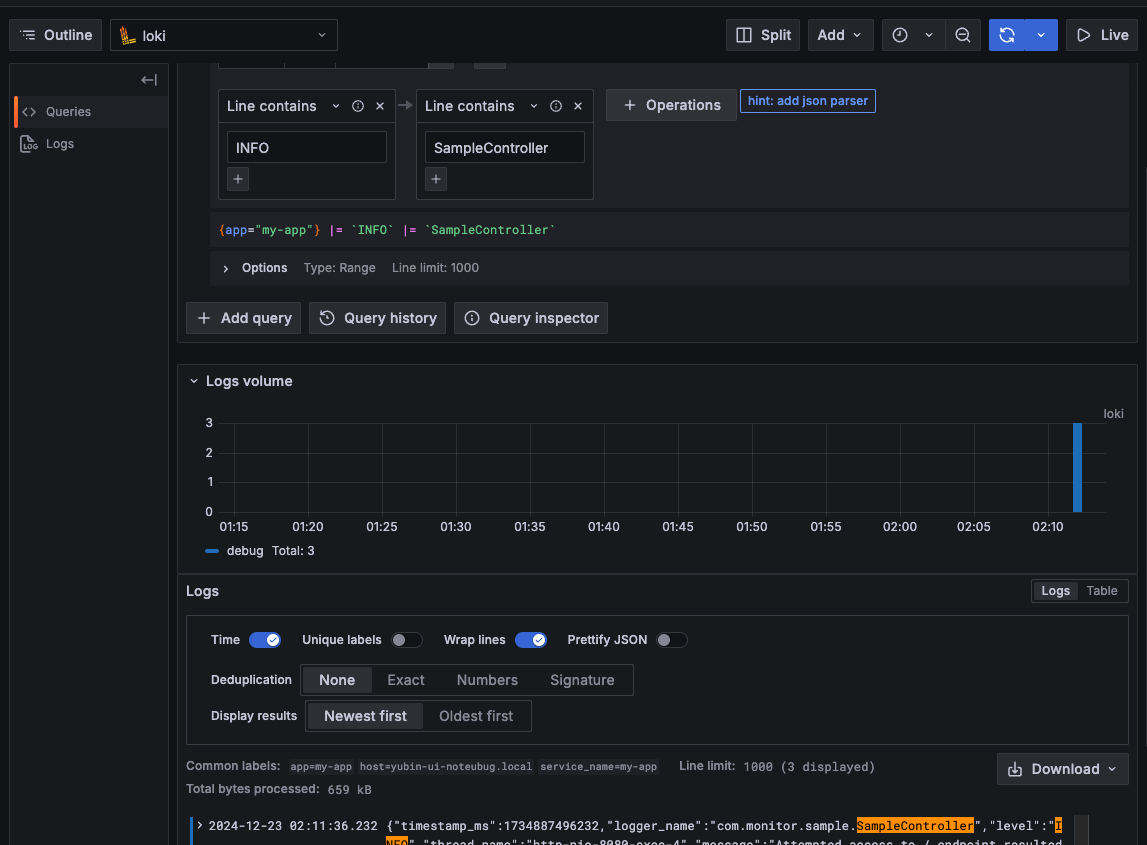
- 확인
대시보드 없이도 Explore에서 쿼리로 데이터를 필터링 해 볼 수 있다