1. 프로파일링
1.1 프로파일링(Profiling)이란?
프로그램의 성능(시간 및 공간 복잡도, 함수 호출의 주기와 빈도 등)을 분석하는 과정
- 숨겨진 병목 지점을 찾아 프로그램을 최적화할 수 있음
- 특히, 동적 타이핑 언어인 Python은 예상되는 지연 구간과 실제 지연이 일어나는 부분이 다를 수 있음 (타입 변환이나 객체 생성 비용이 어디선가 커질 수 있음)
1.2 Python 프로파일링 도구
1. time, datetime 모듈
- 현재 시간을 return 해주는 함수를 사용해 특정 코드의 소요 시간을 빠르게 측정해볼 수 있음
- 매번 print를 코드마다 추가해 다시 빌드하는 과정이 필요하고, 세부적인 성능 분석이 불가능함
2. profile 모듈
- 코드 실행 중 각 함수의 실행 시간과 호출 횟수 기록
- Python 코드로만 작성된 기본 프로파일러
→ 동적 타입, 인터프리터 언어이기 때문에 오버헤드 존재
→ CPython으로 작성된5. cProfile보다 더 느려서 잘 사용되지 않음
3. line_profiler
- 함수 내 개별 코드 라인의 실행 시간을 측정
4. memory_profiler
- 함수 내 개별 코드 라인의 메모리 사용량 측정
5. cProfile 모듈
- Python 표준 라이브러리에 포함된 프로파일링 도구로, 함수 호출 횟수 및 실행 시간을 분석하는 데 유용
- Python 코드 실행 흐름을 추적하는 방식으로 동작하며, C 언어로 구현된 lsprof 모듈을 기반으로 함
→profile보다 빠름
1.3 Sample Code
import random

def generate_data(n):
    """랜덤 숫자 리스트 생성"""
    return [random.randint(1, 10000000) for _ in range(n)]

def sort_data(data):
    """데이터를 정렬"""
    sorted_data = sorted(data)
    return sorted_data

def get_sum_from_data(data):
    """데이터 합계 구하기"""
    total = sum(data)
    return total

def test_func():
    """데이터 생성 → 처리 → 결과 출력"""
    data = generate_data(100000)
    sorted_data = sort_data(data)
    total = get_sum_from_data(sorted_data)

    print(f"총합: {total}, 최대값: {sorted_data[-1]}")
1.4 line_profiler, memory_profiler로 프로파일링 해보기
line_profiler
pip install line_profiler

from line_profiler import LineProfiler
@profile # 프로파일링 원하는 함수 위에 데코레이터 작성
def test_func():

kernprof -l -v test_code.py # 터미널에서 실행
# -l : line_profiler를 사용하여 코드의 각 라인별 성능을 추적
# -v : 프로파일링 결과를 화면에 출력

# Hits: 각 코드 라인이 실행된 횟수
# Time: 해당 라인에서 소요된 시간 (마이크로초 단위)
# Per Hit: 각 호출당 소요된 시간
# % Time: 해당 라인이 전체 함수에서 차지하는 비율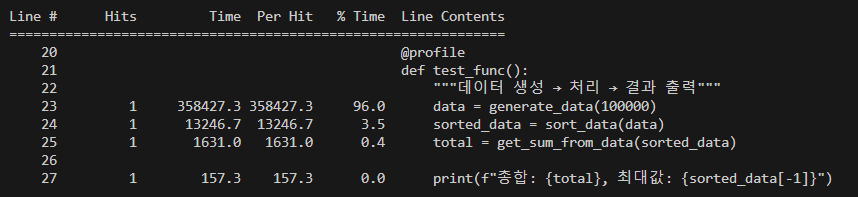
memory_profiler
pip install memory_profiler

@profile # 프로파일링 원하는 함수 위에 데코레이터 작성
def test_func():

python -m memory_profiler test_code.py # 터미널에서 실행
# -m: 모듈 모드(Python 스크립트를 memory_profiler 모듈로 실행)

# Mem usage: 해당 라인에서 함수가 실행될 때 전체 메모리 사용량
# Increment: 해당 라인에서 메모리가 얼마나 증가했는지
# Occurrences: 해당 라인에서 메모리 사용량이 발생한 횟수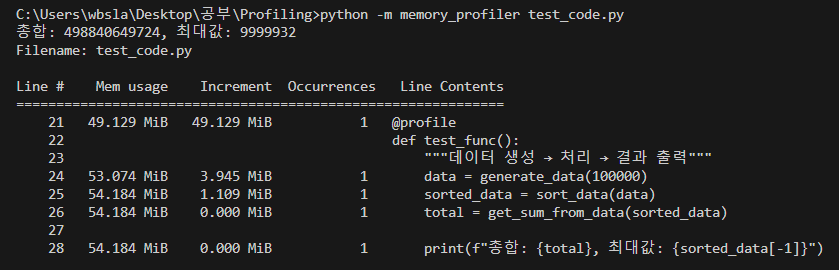
1.5 cProfile, pstats로 프로파일링 해보기
cProfile.Profile
Python 코드의 실행 시간을 프로파일링하는 데 사용
주요 메서드:
- run(statement)
- statement: 프로파일링 할 함수를 string type으로 작성
- 지정한 함수 코드를 실행하고, 프로파일링 데이터를 수집
- ex) profiler.run("test_func(arg1, arg2)")
- enable() / disable()
- 프로파일링 구간을 정하고 싶을 때 사용
- ex) profiler.enable(): 프로파일링 시작, profiler.disable(): 프로파일링 중지
pstats.Stats
cProfile.Profile로부터 생성된 프로파일링 데이터를 분석하고 출력하는 데 사용
주요 메서드:
- strip_dirs()
- 프로파일링 결과에서 디렉토리 경로를 제거하여, 파일명만 남김
- ex) stats.strip_dirs()
- sort_stats(*args)
- 프로파일링 결과를 정렬
- *args: 'cumulative', 'time', 'calls', 'name'
- ex) stats.sort_stats('cumulative')
- print_stats()
- 프로파일링 결과를 콘솔에 출력
- 인자를 통해 출력 개수를 제한할 수 있음
- ex) stats.print_stats(20)
- dump_stats(filename)
- 프로파일링 결과를 파일에 저장
- ex) stats.dump_stats('profile_results.prof')
Example
from cProfile import Profile
from pstats import Stats

profiler = Profile()
profiler.run("test_func()")
stats = Stats(profiler)
stats.strip_dirs()
stats.sort_stats('cumulative')
stats.print_stats(20)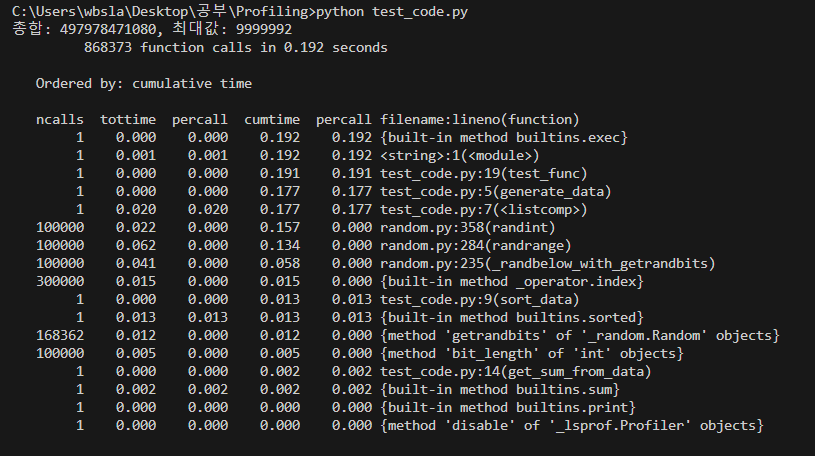
SnakeViz로 cProfile 결과 시각화 하기
pip install snakeviz
snakeviz test_code.prof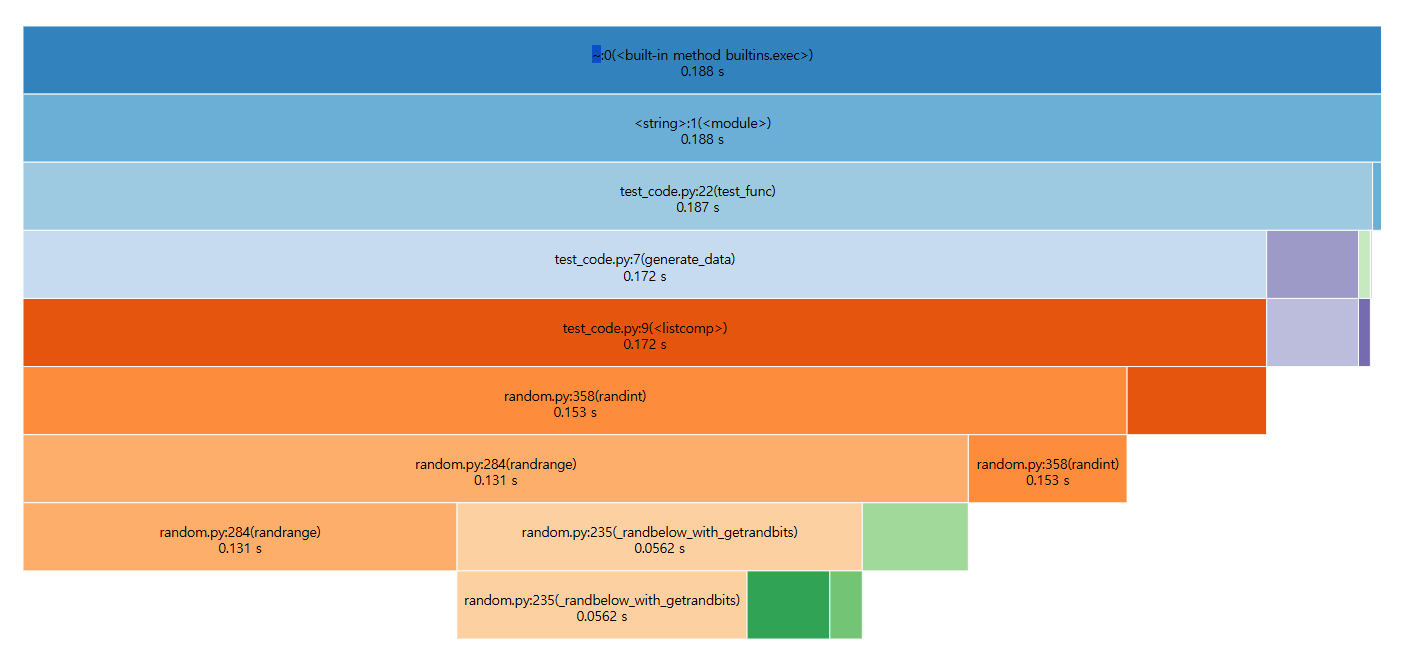

만두는 목말라