
In the first part, we ran the freqtrade service on an EC2 server, but since it takes time for actual trades to be executed in an automated trading strategy, we can't just wait around indefinitely. Fortunately, freqtrade provides backtesting, analysis of results, and visualization within its module. Therefore, in this part, before creating our own strategy, we will conduct backtesting, result analysis, and visualization using the sample strategy provided by freqtrade. We will also compare the results when some modifications are made to the sample strategy to see how much they differ.
1
we need to make a configuration file. You can create the configuation file interactively by this command.
freqtrade new-config --config user_data/config.json
2
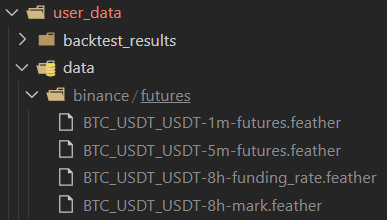
we need to download the kline data for backtesting. You can easily download the data using the command below. There are several options available, but for simplicity, we'll execute the basic command without any options to download the BTC/USDT futures data. (If you don't specify a download directory option, it will default to the datadir specified in the config.)
freqtrade download-data --exchange binance --pairs BTC/USDT:USDT
Directory structure after the download is complete:
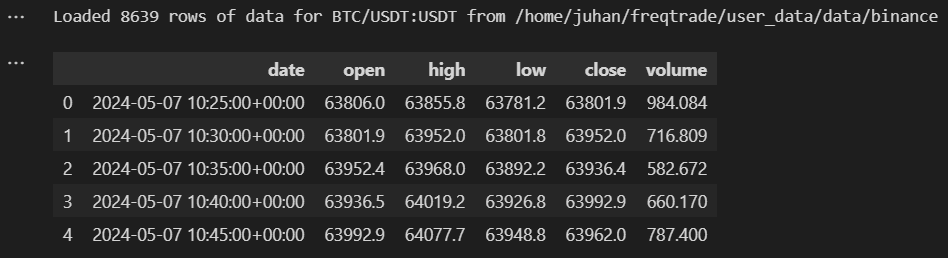
# Load data using values set above
from freqtrade.data.history import load_pair_history
from freqtrade.enums import CandleType
candles = load_pair_history(datadir=data_location,
                            timeframe=config["timeframe"],
                            pair=pair,
                            data_format = "feather",  # Make sure to update this to your data
                            candle_type=CandleType.FUTURES,
                            )
# Confirm success
print(f"Loaded {len(candles)} rows of data for {pair} from {data_location}")
candles.head()
3
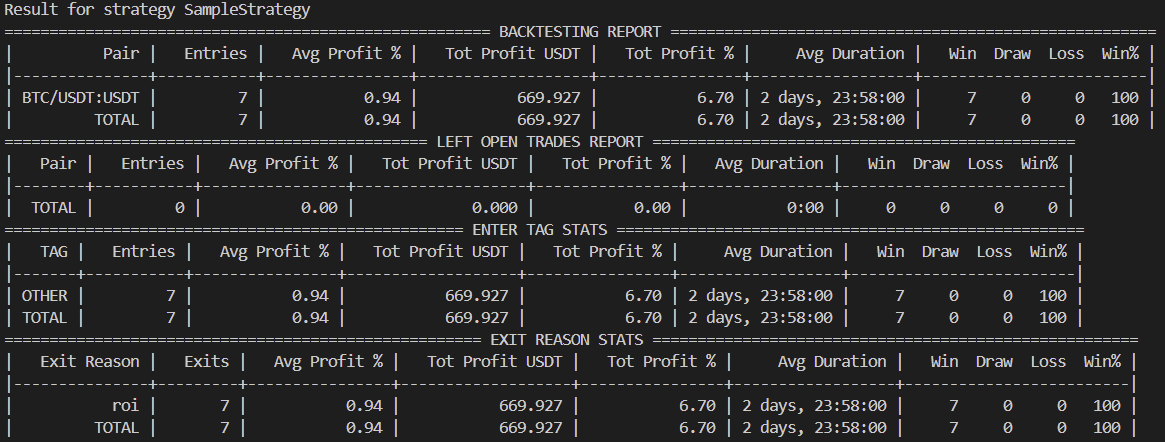
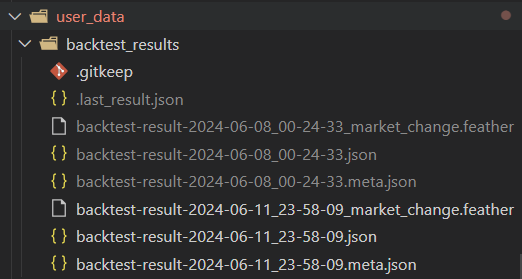
we've done all the preparation for backtesting. Run backtesting by this command(config, strategy option are mandatory). Freqtrade is kind enough to report the result and also save it into a file!
freqtrade backtesting --config user_data/config.json --strategy SampleStrategy
4
Let's analyze the backtesting results and visualize the analysis.
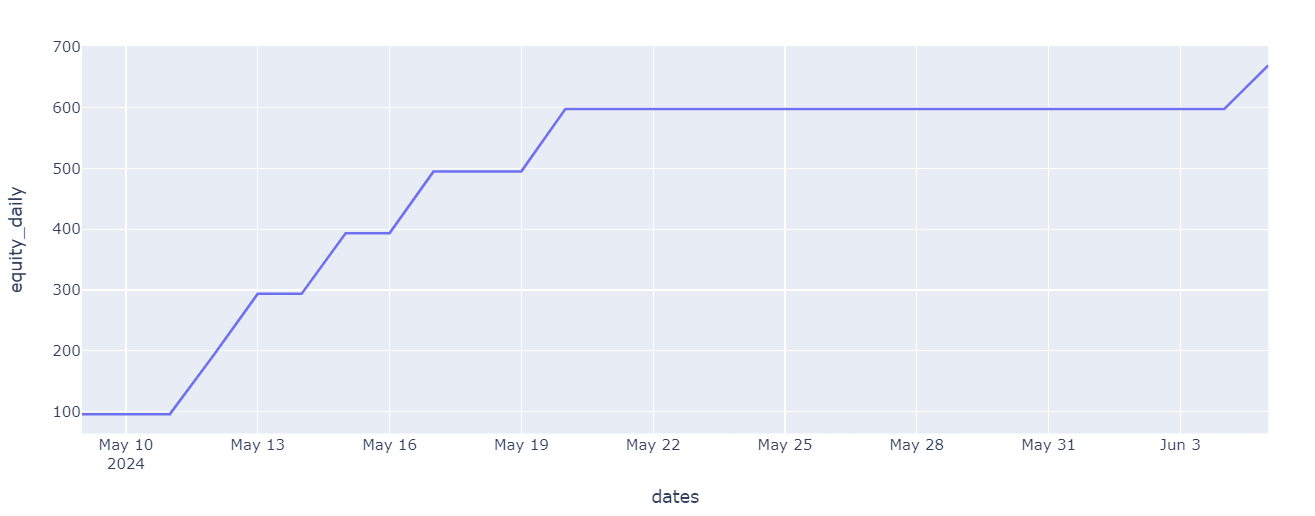
#Plotting equity line (starting with 0 on day 1 and adding daily profit for each backtested day)
from freqtrade.configuration import Configuration
from freqtrade.data.btanalysis import load_backtest_stats
import plotly.express as px
import pandas as pd
strategy = 'SampleStrategy'
config = Configuration.from_files(["user_data/config.json"])
backtest_dir = config["user_data_dir"] / "backtest_results"
stats = load_backtest_stats(backtest_dir)
strategy_stats = stats['strategy'][strategy]
df = pd.DataFrame(columns=['dates','equity'], data=strategy_stats['daily_profit'])
df['equity_daily'] = df['equity'].cumsum()
fig = px.line(df, x="dates", y="equity_daily")
fig.show()
Not bad result considering it's just the sample strategy?
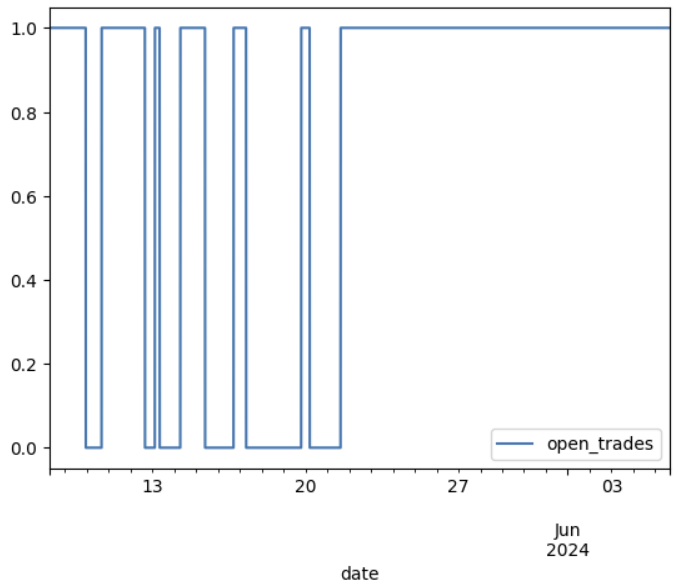
If I set the max_open_trade variable on configuration file to be more than 1, it can open position as long as the value of it. And we can simply see the flow of changing position by this.
from freqtrade.data.btanalysis import analyze_trade_parallelism
# Analyze the above
parallel_trades = analyze_trade_parallelism(trades, '5m')
parallel_trades.plot()
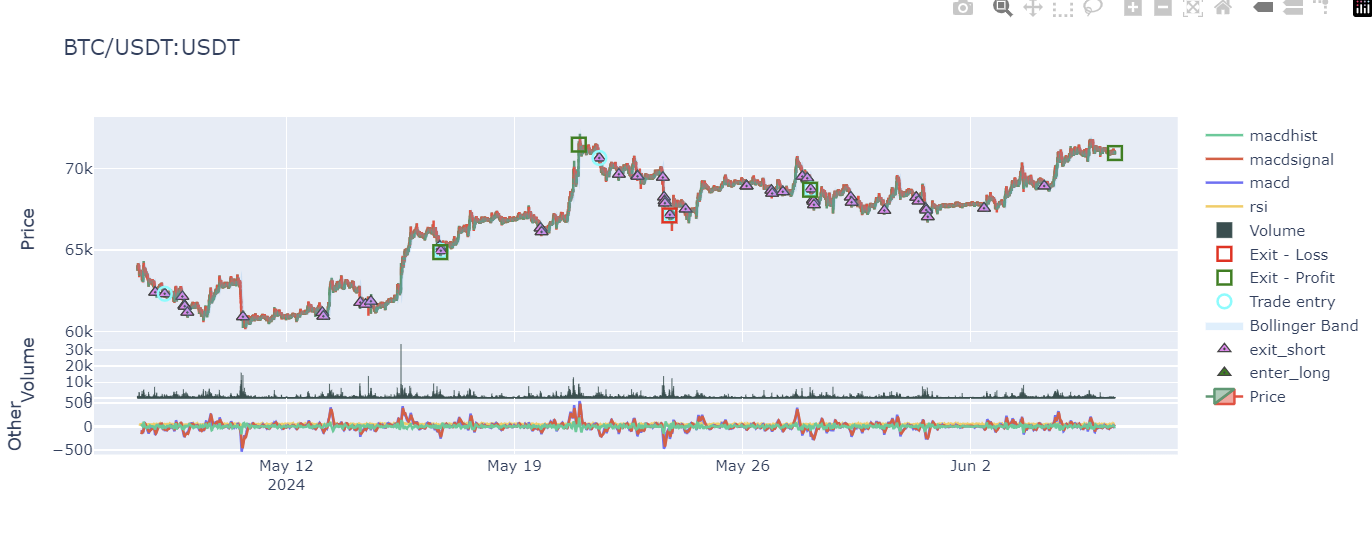
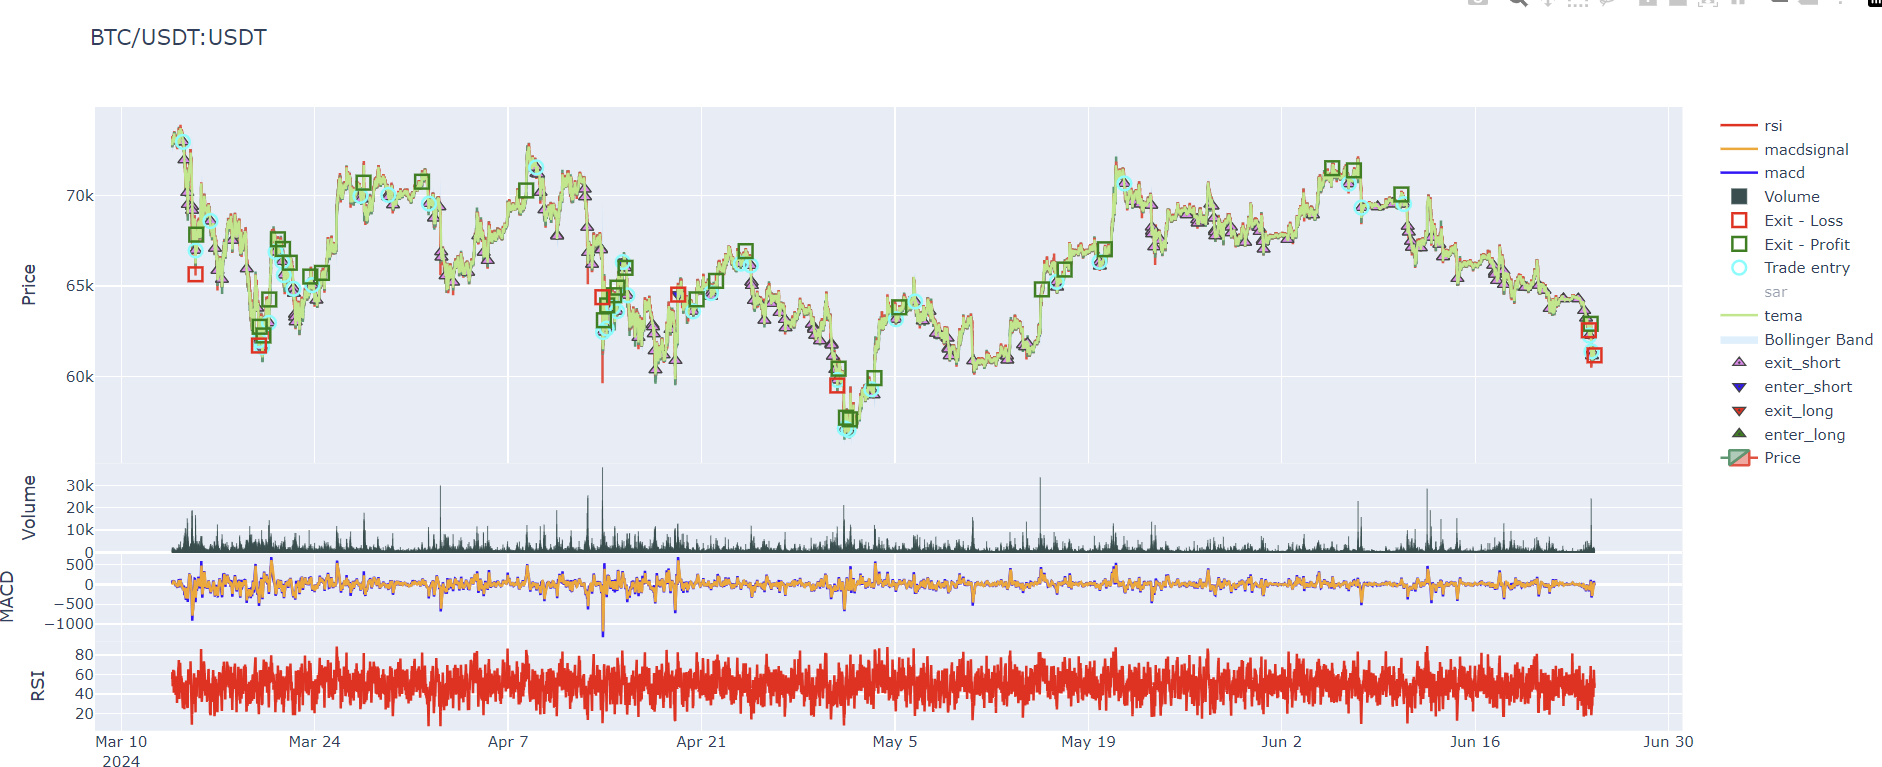
#Filter trades to one pair
trades_red = trades.loc[trades['pair'] == pair]
#if you want for just simple plot with candle use this
#from freqtrade.data import history
#data = history.load_pair_history(pair=pair, timeframe='5m',
#datadir= Path(config["user_data_dir"], 'data', 'binance'),
#candle_type=CandleType.FUTURES)
#if you want for more sophisticated plot with indicators use this
from freqtrade.resolvers import StrategyResolver
from freqtrade.data.dataprovider import DataProvider
strategy = StrategyResolver.load_strategy(config)
strategy.dp = DataProvider(config, None, None)
strategy.ft_bot_start()
#Generate buy/sell signals using strategy
df = strategy.analyze_ticker(candles, {'pair': pair})
data = df.set_index('date', drop=False)
from freqtrade.plot.plotting import  generate_candlestick_graph
#Generate candlestick graph
graph = generate_candlestick_graph(pair=pair,
                                   data=data,
                                   trades=trades_red,
                                   indicators1=['sma20', 'ema50', 'ema55'],
                                   indicators2=['rsi', 'macd', 'macdsignal', 'macdhist']
                                  )
graph.show()
If you conduct backtesting over a short period, the results might appear favorable. Therefore, it's essential to gather data from various market conditions and perform backtesting. The effectiveness of an objective strategy can only be analyzed by setting a long backtesting period or by examining profits and losses in rising, falling, and sideways markets.
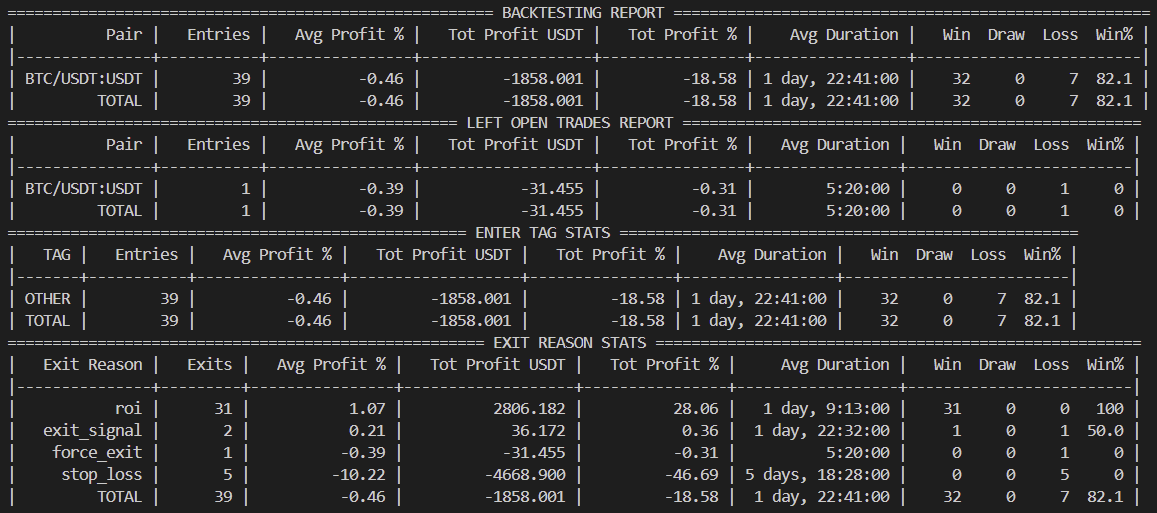
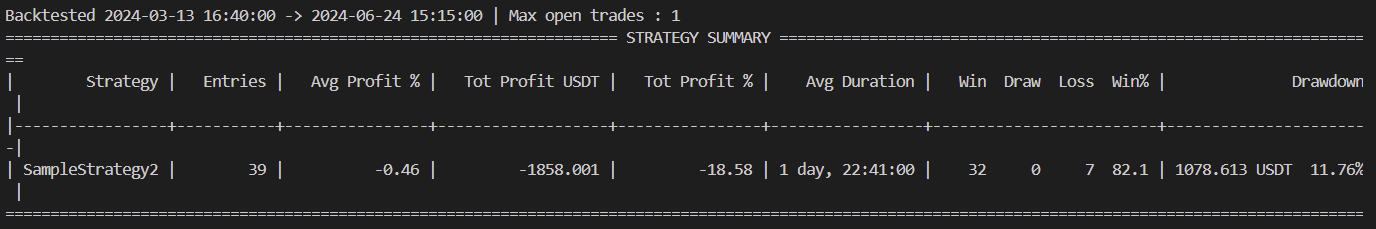
The performance according to the set ROI strategy is very good, but since the stop loss is set to -10%, frequent stop-loss occurrences will significantly reduce profits. In a real trading scenario rather than a simulated investment, the drawdown would be enormous, making it a strategy that needs improvement. You might think that simply lowering the stop loss ratio could help, but doing so actually lowers the win rate of the ROI strategy. Therefore, it's crucial to optimize the appropriate stop loss and trailing stop according to the strategy. Freqtrade has an API that even supports variable optimization.