
인구분석
인구소멸지역 계산
import pandas as pd
import numpy as np
import matplotlib.pyplot as plt
import warnings
warnings.filterwarnings(action="ignore")
%matplotlib inline

import platform
from matplotlib import font_manager, rc

path = "C:/Windows/Fonts/malgun.ttf"

if platform.system() == "Darwin":
    rc("font", family="Arial Unicode MS")
elif platform.system() == "Windows":
    font_name = font_manager.FontProperties(fname=path).get_name()
    rc("font", family=font_name)
else :
    print("Unknown system. sorry")
population = pd.read_excel("../data/07_population_raw_data.xlsx", header=1)
population.fillna(method="pad", inplace=True)
# 컬럼 이름 변경
population.rename(
columns={
"행정구역(동읍면)별(1)":"광역시도",
"행정구역(동읍면)별(2)":"시도",
"계":"인구수",
}, inplace=True
)
# 소계 제거
population = population[population["시도"] != "소계"]
population.is_copy = False
population.rename(
columns={
"항목":"구분"
}, inplace=True
)
population.loc[population["구분"] == "총인구수 (명)", "구분"] = "합계"
population.loc[population["구분"] == "남자인구수 (명)", "구분"] = "남자"
population.loc[population["구분"] == "여자인구수 (명)", "구분"] = "여자"
# 소멸 지역을 조사하기 위한 데이터
population["20 - 39세"] = (
population["20 - 24세"]
+ population["25 - 29세"]
+ population["30 - 34세"]
+ population["35 - 39세"]
)
population["65세 이상"] = (
population["65 - 69세"]
+ population["70 - 74세"]
+ population["75 - 79세"]
+ population["80 - 84세"]
+ population["85 - 89세"]
+ population["90 - 94세"]
+ population["95 - 99세"]
+ population["100+"]
)
pop = pd.pivot_table(
data=population,
index=["광역시도", "시도"],
columns=["구분"],
values=["인구수","20 - 39세", "65세 이상"]
)
#소멸비율 계산
pop["소멸비율"] = pop["20 - 39세", "여자"] / (pop["65세 이상", "합계"] / 2)
# 소멸위기지역 컬럼 생성
pop["소멸위기지역"] = pop["소멸비율"] < 1.0
# 소멸위기지역 조회
pop[pop["소멸위기지역"] == True].index.get_level_values(1)
pop.reset_index(inplace=True)
tmp_colums = [
pop.columns.get_level_values(0)[n] + pop.columns.get_level_values(1)[n]
for n in range(0, len(pop.columns.get_level_values(0)))
]
pop.columns = tmp_colums지역별 ID 만들기
si_name = [None] * len(pop)

tmp_gu_dict = {
    "수원":["장안구", "권선구", "팔달구", "영통구"],
    "성남":["수정구", "중원구", "분당구"],
    "안양":["만안구", "동안구"],
    "안산":["상록구", "단원구"],
    "고양":["덕양구", "일산동구", "일산서구"],
    "용인":["처인구", "기흥구", "수지구"],
    "청주":["상당구", "서원구", "흥덕구", "청원구"],
    "천안":["동남구", "서북구"],
    "전주":["완산구", "덕진구"],
    "포항":["남구", "북구"],
    "창원":["의창구", "성산구", "진해구", "마산합포구", "마산회원구"],
    "부천":["오정구", "원미구", "소사구"]
}

# 광역시도
for idx, row in pop.iterrows():
    if row["광역시도"][-3:] not in ["광역시", "특별시", "자치시"]:
        si_name[idx] = row["시도"][:-1]

    elif row["광역시도"] == "세종특별자치시":
        si_name[idx] = "세종"

    else:
        if len(row["시도"]) == 2:
            si_name[idx] = row["광역시도"][:2] + " " + row["시도"]
        else:
            si_name[idx] = row["광역시도"][:2] + " " + row["시도"][:-1]

# 행정구
for idx, row in pop.iterrows():
    if row["광역시도"][-3:] not in ["광역시", "특별시", "자치시"]:
        for keys, values in tmp_gu_dict.items():
            if row["시도"] in values:
                if len(row["시도"]) == 2:
                    si_name[idx] = keys + " " + row["시도"]

                elif row["시도"] in ["마산합포구", "마산회원구"]:
                    si_name[idx] = keys + " " + row["시도"][2:-1]

                else:
                    si_name[idx] = keys + " " + row["시도"][:-1]

# 고성군
for idx, row in pop.iterrows():
    if row["광역시도"][-3:] not in ["광역시", "특별시", "자치시"]:
        if row["시도"][:-1] == "고성" and row["광역시도"] == "강원도":
            si_name[idx] = "고성(강원)"
        elif row["시도"][:-1] == "고성" and row["광역시도"] == "경상남도":
            si_name[idx] = "고성(경남)"

# ID 컬럼 추가
pop["ID"] = si_name
# 필요없는 컬럼 삭제
del pop["20 - 39세남자"]
del pop["65세 이상남자"]
del pop["65세 이상여자"]
# 데이터 검증작업
set(draw_korea["ID"].unique()) - set(pop["ID"].unique())
set(pop["ID"].unique()) - set(draw_korea["ID"].unique())
tmp_list = list(set(pop["ID"].unique()) - set(draw_korea["ID"].unique()))
for tmp in tmp_list:
pop = pop.drop(pop[pop["ID"] == tmp].index)
set(pop["ID"].unique()) - set(draw_korea["ID"].unique())
# merge
pop = pd.merge(pop, draw_korea, how="left", on="ID")지도그리기(카르토그램)
draw_korea_raw = pd.read_excel("../data/07_draw_korea_raw.xlsx")

draw_korea_raw_stacked = pd.DataFrame(draw_korea_raw.stack())
draw_korea_raw_stacked.reset_index(inplace=True)
draw_korea_raw_stacked.rename(
    columns={
        "level_0":"y",
        "level_1":"x",
        0:"ID"
    }, inplace=True
)

draw_korea = draw_korea_raw_stacked

BORDER_LINES = [
    [(5,1), (5,2), (7,2), (7,3), (11,3), (11,0)], # 인천
    [(5,4), (5,5), (2,5), (2,7), (4,7), (4,9), (7,9), (7,7), (9,7), (9,5), (10,5), (10,4), (5,4)], # 서울
    [(1,7), (1,8), (3,8), (3,10), (10,10), (10,7), (12,7), (12,6), (11,6), (11,5), (12,5), (12,4), (11,4), (11,3)], # 경기도
    [(8,10), (8,11), (6,11), (6,12)], # 강원도
    [(12,5), (13,5), (13,4), (14,4), (14,5), (15,5), (15,4), (16,4), (16,2)], # 충청북도
    [(16,4), (17,4), (17,5), (16,5), (16,6), (19,6), (19,5), (20,5), (20,4), (21,4), (21,3), (19,3), (19,1)], # 전라북도
    [(13,5), (13,6), (16,6)],
    [(13,5), (14,5)], # 대전시 #세종시
    [(21,2), (21,3), (22,3), (22,4), (24,4), (24,2), (21,2)], # 광주
    [(20,5), (21,5), (21,6), (23,6)], # 전라남도
    [(10,8), (12,8), (12,9), (14,9), (14,8), (16,8), (16,6)], # 충청북도
    [(14,9), (14,11), (14,12), (13,12), (13,13)], # 경상북도
    [(15,8), (17,8), (17,10), (16,10), (16,11), (14,11)], # 대구
    [(17,9), (18,9), (18,8), (19,8), (19,9), (20,9), (20,10), (21,10)], # 부산
    [(16,11), (16,13)],
    [(27,5), (27,6), (25,6)]
]
def get_data_info(targetData, blockedMap):
whitelabelmin = (
max(blockedMap[targetData]) - min(blockedMap[targetData])
) * 0.25 + min(blockedMap[targetData])
vmin = min(blockedMap[targetData])
vmax = max(blockedMap[targetData])
mapdata = blockedMap.pivot_table(index="y", columns="x", values=targetData)
return mapdata, vmax, vmin, whitelabelmin
def get_data_info_for_zero_center(targetData, blockedMap):
whitelabelmin = 5
tmp_max = max(
[np.abs(min(blockedMap[targetData])), np.abs(max(blockedMap[targetData]))]
)
vmin, vmax = -tmp_max, tmp_max
mapdata = blockedMap.pivot_table(index="y", columns="x", values=targetData)
return mapdata, vmax, vmin, whitelabelmin
def plot_text(targetData, blockedMap, whitelabelmin):
for idx, row in blockedMap.iterrows():
if len(row["ID"].split()) == 2:
dispname = "{}\n{}".format(row["ID"].split()[0], row["ID"].split()[1])
elif row["ID"][:2] == "고성":
dispname = "고성"
else:
dispname = row["ID"]
if len(dispname.splitlines()[-1]) >=3:
fontsize, linespacing = 9.5, 1.5
else:
fontsize, linespacing = 11, 1.2
annocolor = "white" if np.abs(row[targetData]) > whitelabelmin else "black"
# 주석 달기
plt.annotate(
dispname,
(row["x"]+0.5, row["y"]+0.5),
weight="bold",
color=annocolor,
fontsize=fontsize,
linespacing=linespacing,
ha="center", # 수평정렬
va="center" # 수직정렬
)
def drawKorea(targetData, blockedMap, cmapname, zeroCenter=False):
if zeroCenter:
masked_mapdata, vmax, vmin, whitelabelmin = get_data_info_for_zero_center(targetData, blockedMap)
if not zeroCenter:
masked_mapdata, vmax, vmin, whitelabelmin = get_data_info(targetData, blockedMap)
plt.figure(figsize=(8,11))
plt.pcolor(masked_mapdata, vmin=vmin, vmax=vmax, cmap=cmapname, edgecolor="#aaaaaa", linewidth=0.5)
plot_text(targetData, blockedMap, whitelabelmin)
for path in BORDER_LINES:
ys, xs = zip(*path)
plt.plot(xs, ys, c="black", lw=1.5)
plt.gca().invert_yaxis()
plt.axis("off")
plt.tight_layout()
cb = plt.colorbar(shrink=0.1, aspect=10)
cb.set_label(targetData)
plt.show()drawKorea("인구수합계", pop, "Blues")
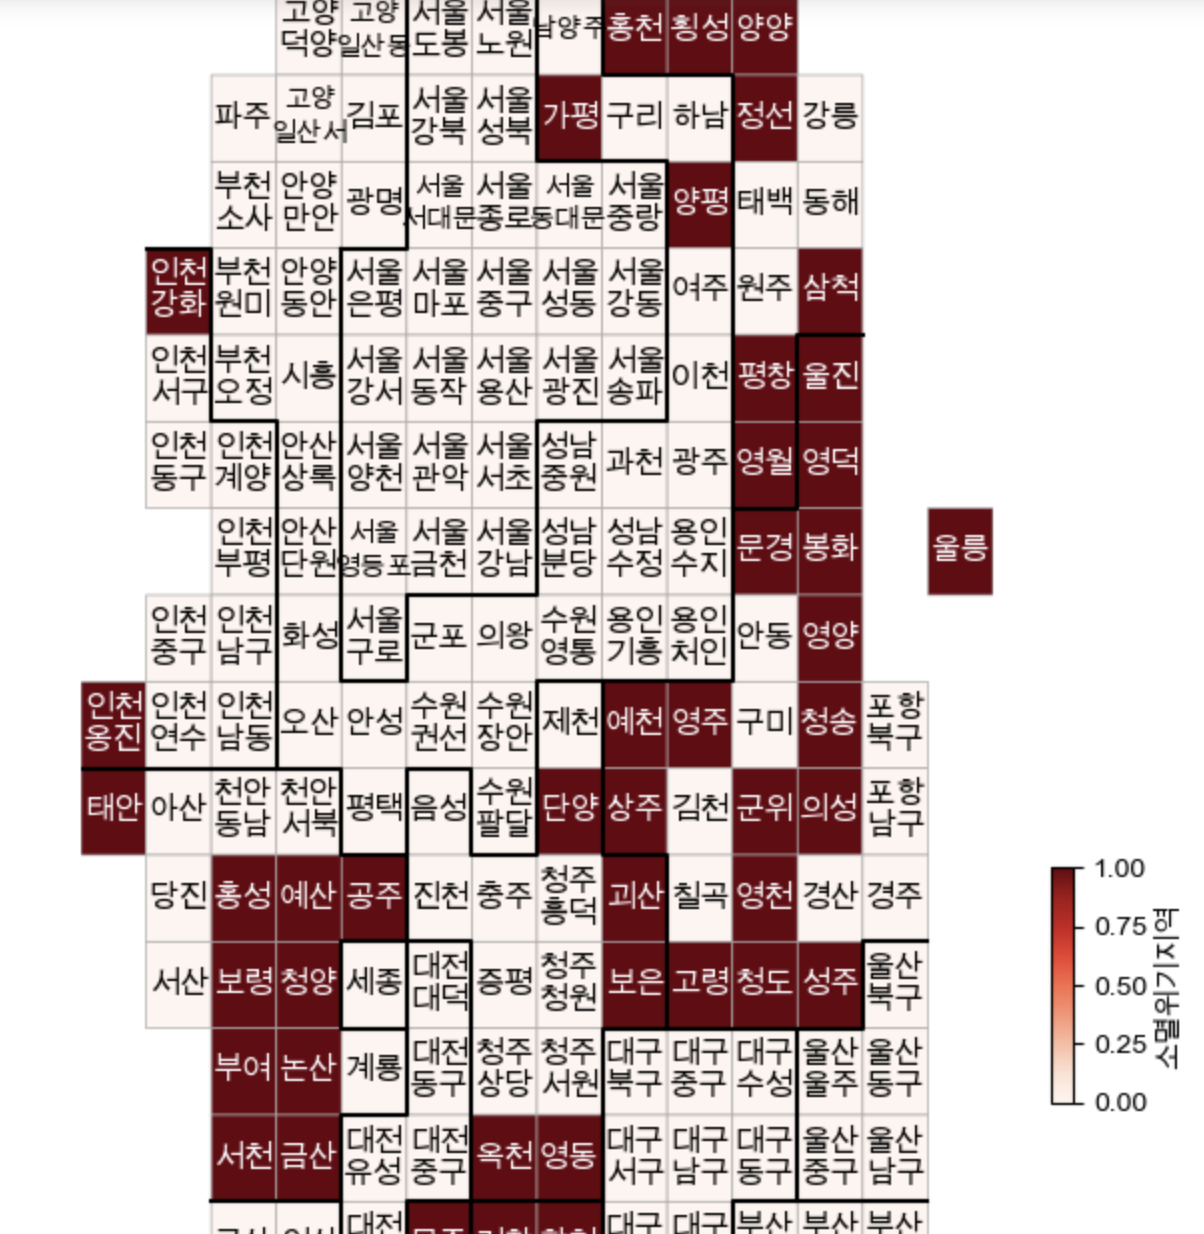
pop["소멸위기지역"] = [1 if con else 0 for con in pop["소멸위기지역"]]
drawKorea("소멸위기지역", pop, "Reds")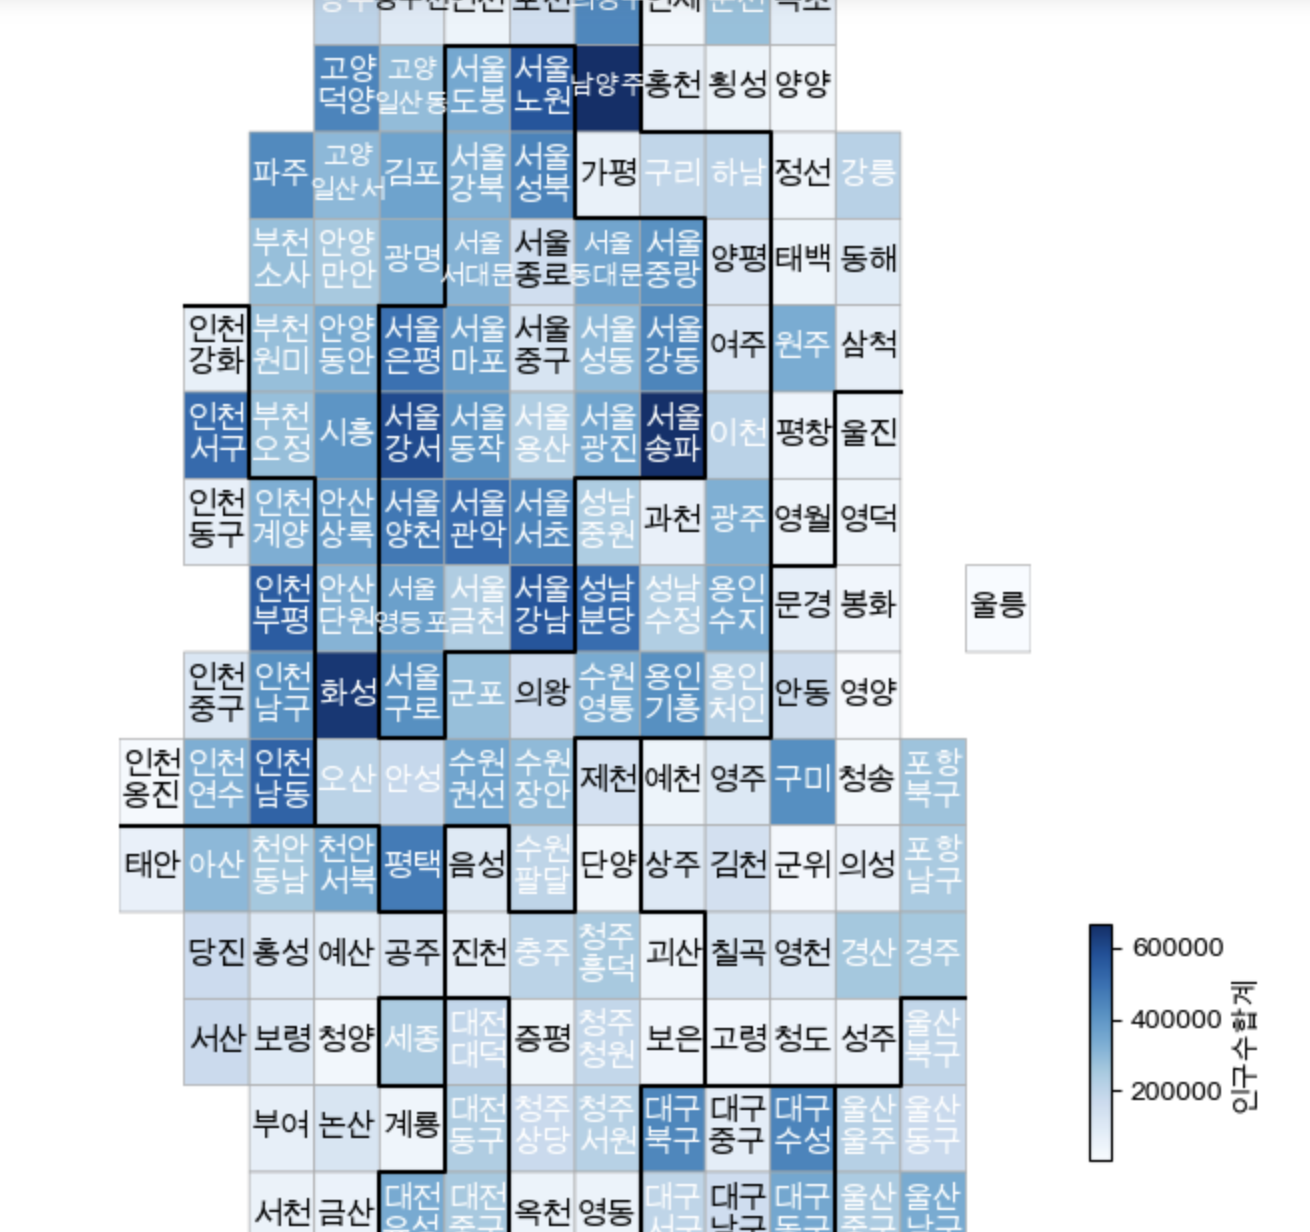
지도그리기(folium)
import folium
import json
pop_folium = pop.set_index("ID")
geo_path = "../data/07_skorea_municipalities_geo_simple.json"
geo_str = json.load(open(geo_path, encoding="utf-8"))
mymap = folium.Map(location=[36.2002, 127.054], zoom_start=7)
mymap.choropleth(
geo_data=geo_str,
data=pop_folium["인구수합계"],
key_on="feature.id",
columns=[pop_folium.index, pop_folium["인구수합계"]],
fill_color="YlGnBu"
)
mymap
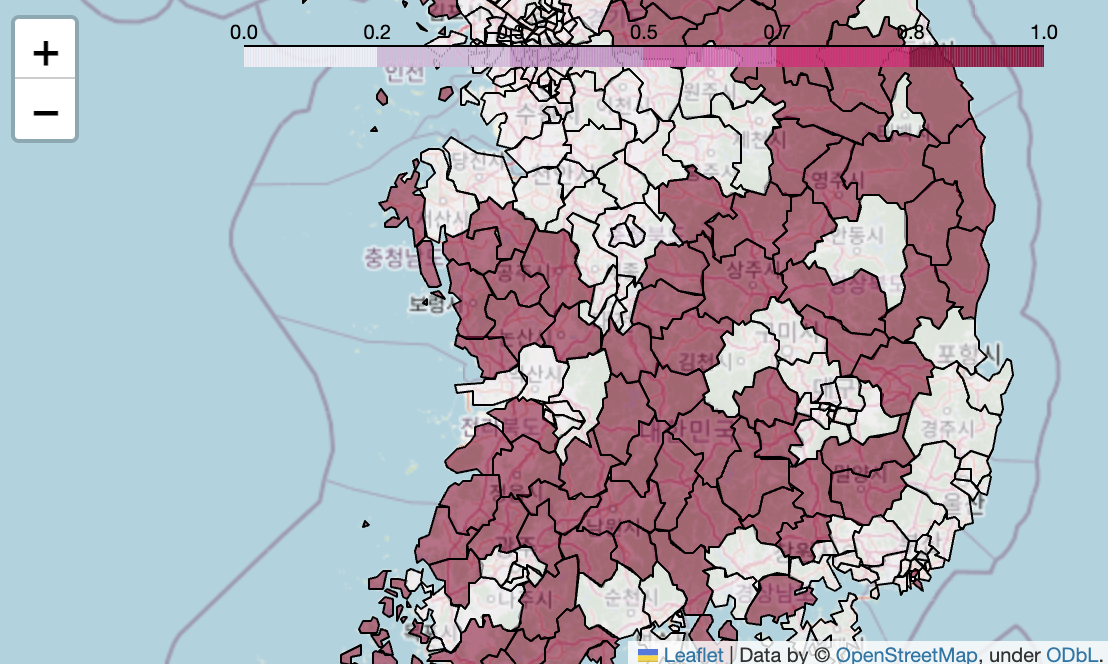
mymap = folium.Map(location=[36.2002, 127.054], zoom_start=7)
mymap.choropleth(
geo_data=geo_str,
data=pop_folium["소멸위기지역"],
key_on="feature.id",
columns=[pop_folium.index, pop_folium["소멸위기지역"]],
fill_color="PuRd"
)
mymap
draw_korea.to_csv("../data/07_draw_korea.csv", encoding="utf-8", sep=",")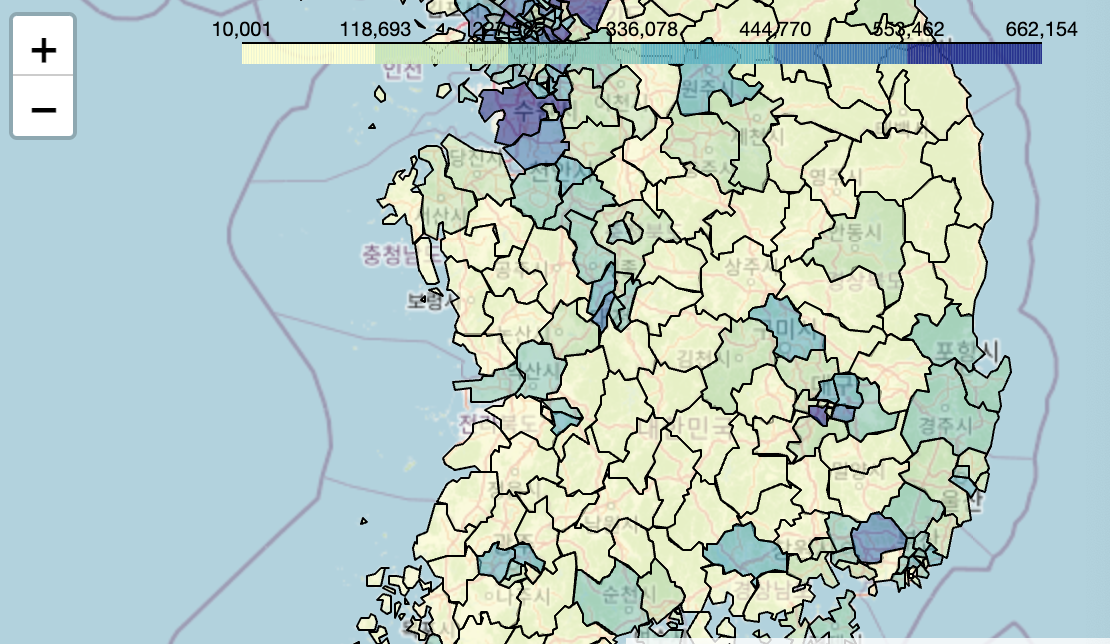

21세기 주인공