
Memory leak 코드 작성
"use strict";
Object.defineProperty(exports, "__esModule", { value: true });
// const dump = heapdump({
//   path: join(__dirname, Date.now().toString())
// })
var theThing = null;
function replaceThing() {
    //FIXME: originalThing  and theThing are not used.
    // So these are targets of gc
    var originalThing = theThing;

    var unused = function () {
        if (originalThing)  console.log("hi");
    };

    theThing = {
        longStr: new Array(10_000_000).join('*'),
        someMethod: function () {
            console.log('someMessage');
        }
    };
}
// lexical scope 넘어가는 일은 허용하지 않아야한다.
setInterval(replaceThing, 100);
inspect option 으로 실행
$ node --inspect .\gc-test.js자동으로 localhost:9229 포트가 열리게되고 chrome 으로 메모리 현황을 알 수 있음.
Debugger listening on ws://127.0.0.1:9229/13ad1216-96a0-41a7-b515-92dce2e1b1ed
For help, see: https://nodejs.org/en/docs/inspector
Debugger attached.
Chrome inspect 접속
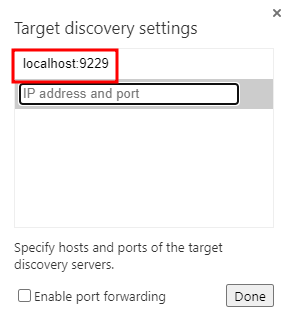
chrome://inspect 접속
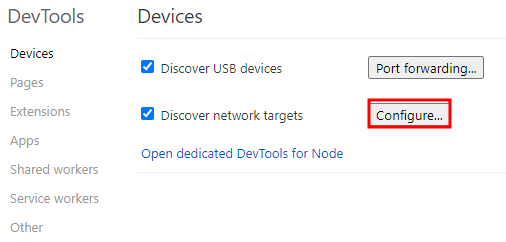
9229 기본 포트 설정
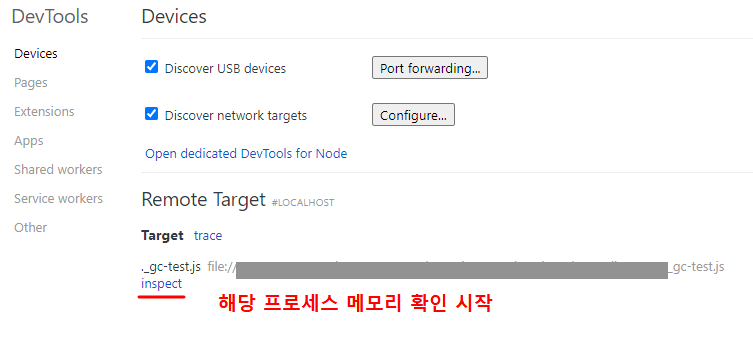
Snapshot 으로 추이 분석
Heap 영역의
string사용량이 증가하고 있는 것을 알 수 있다.
GC에 의해 수집되지 않아, 메모리 누수가 일어나고있다.
Chrome:inspector 다른 옵션
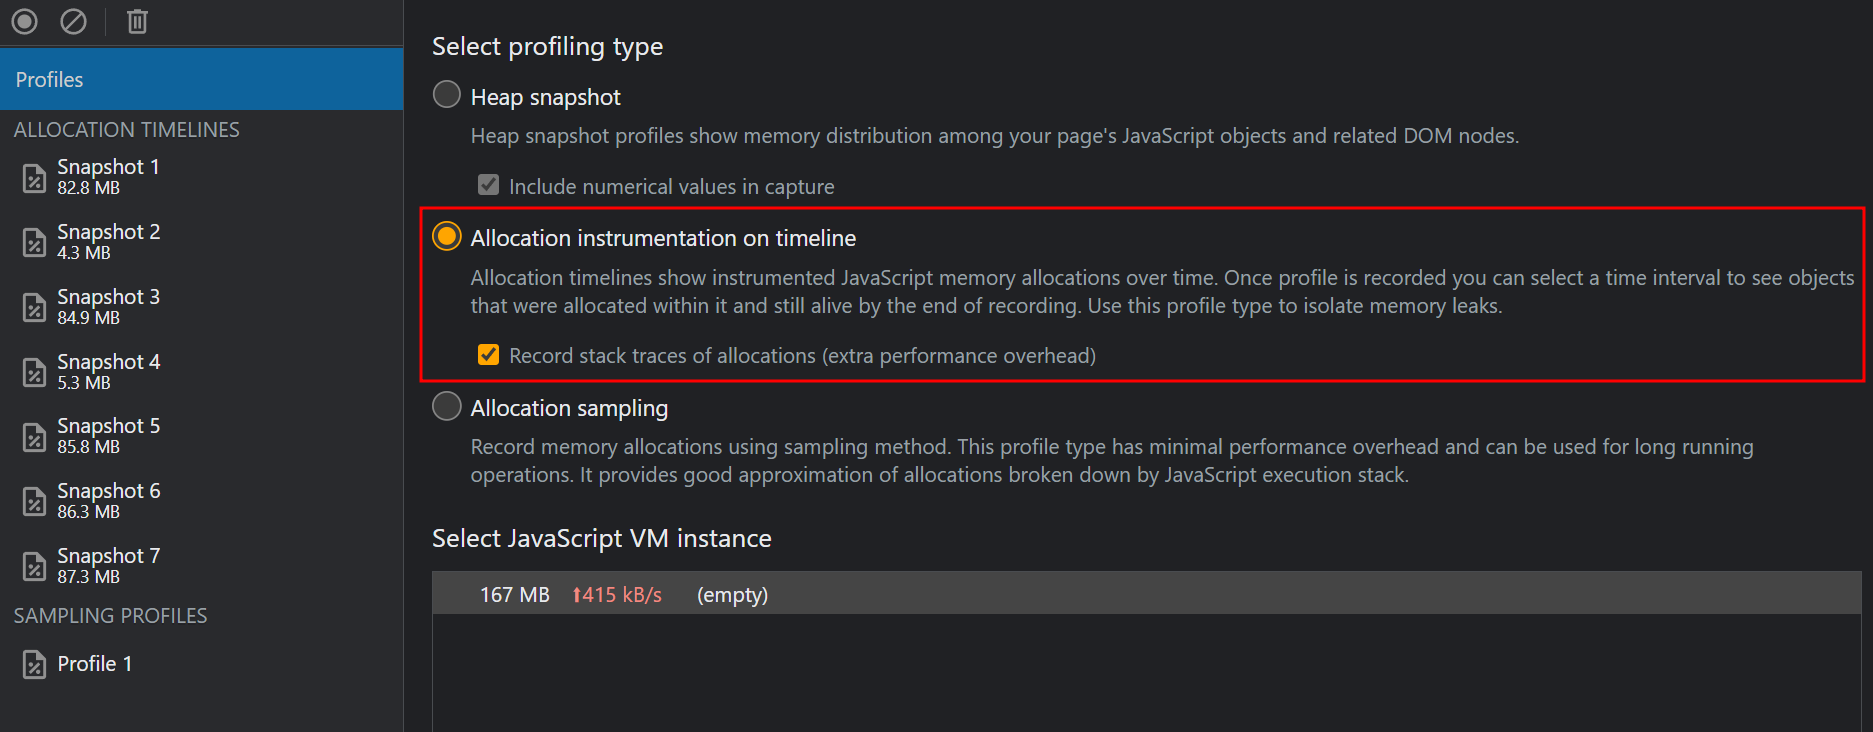
Allocation instrumentation on timeline 옵션을 택하면 일정 시간동안 메모리 할당을 기록한다.
Memory leak 을 검증하기에 최적의 옵션이다.
예시
예제 코드 실행중에 Snapshot 을 찍어 추이를 확인해봤다.
array 와 concatenated string 이 가장 큰 사이즈를 차지하고 있음을 알 수 있는데
array 는 크기에 변화가 없고 concatenated string 은 단조증가하고있다.
변수 타입은 물론 실제 값까지 확인 가능하다.
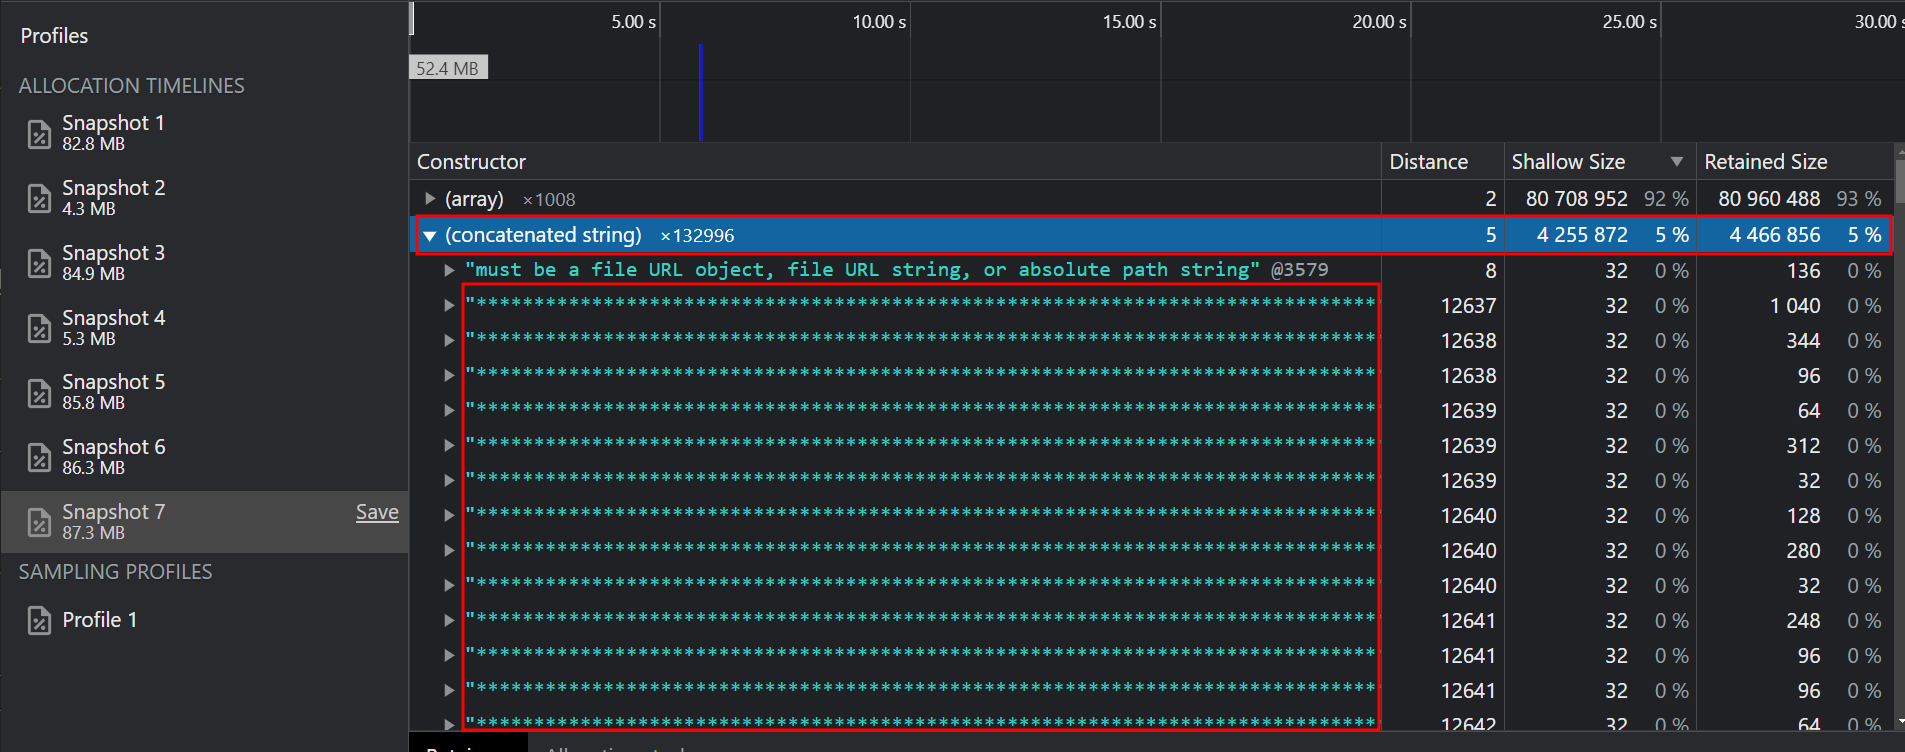
1천만개 '*' 스트링이 쌓이고있다.
실험 결과
| Constructor | Concatenated string | Array |
|---|---|---|
| Snapshot 1 | 0.5MB | 8MB |
| Snapshot 2 | 1.7MB | 0.7MB |
| Snapshot 3 | 2.2MB | 8MB |
| Snapshot 4 | 2.6MB | 0.7MB |
| Snapshot 5 | 3MB | 8MB |
| Snapshot 6 | 3.4MB | 8MB |
| Snapshot 7 | 4MB | 8MB |
| Snapshot 8 | 7.3MB | 0.7MB |
Array는 GC 대상이나, string(****)은 해제되지 않는다.
🔗 Reference

I'm still hungry