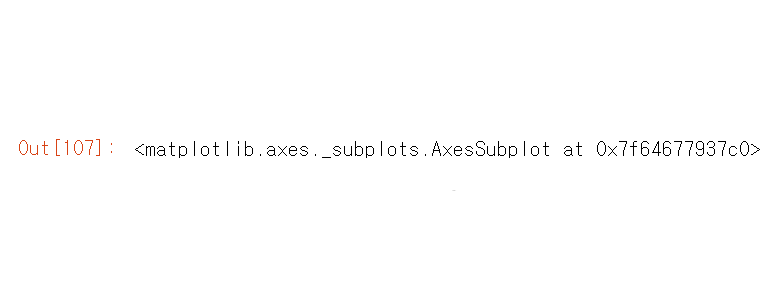
그래프 위에
<matplotlib.axes._subplots.AxesSubplot at 0x7f64677937c0>
이런걸 없애려면...
그래프 출력 마지막 line에
;를 찍는다.
예시
change
sns.histplot(train_df, x = 'name')into
sns.histplot(train_df, x = 'name');
그래프 위에
<matplotlib.axes._subplots.AxesSubplot at 0x7f64677937c0>
이런걸 없애려면...
그래프 출력 마지막 line에
;를 찍는다.
change
sns.histplot(train_df, x = 'name')into
sns.histplot(train_df, x = 'name');