scikit-image 정리
scikit-image
scikit-image는 이미지처리에 특화된 Python 라이브러리이며 Numpy 배열로 이미지 객체를 다룹니다.
1. Install
# 터미널
pip install scikit-image

# Anaconda
conda install -c conda-forge scikit-image
기본적으로 이미지를 자른다던가 단순한 필터링 등의 이미지 조작이 가능 Numpy 배열로 동작하기 때문에 Numpy를 활용한 연산이 쉽다.또한 픽셀 값이 0과 1사이에 있는 float 이미지를 다룰 수도 있습니다.
테스트를 위한 폴더를 만들어 줍니다.
from skimage import io
import os

result_dir = "result"

# Make Directory
if not os.path.exists(result_dir):
    os.makedirs(result_dir)
2. Open Image
imshow() 함수는 Matplotlib을 사용하여 이미지를 표시합니다.
image = io.imread("skimage_logo.png")
io.imshow(image)
2. Image Properties
imread() 함수로 이미지를 읽어온 이미지는 numpy array 입니다. 따라서 속성 정보는 크기와 채널 정보만 알 수 있습니다.
print('이미지 사이즈 : {}'.format(image.shape))
print('이미지 Width : {}'.format(image.shape[0]))
print('이미지 Height : {}'.format(image.shape[1]))
이미지 사이즈 : (140, 568, 3)
이미지 Width : 140
이미지 Height : 5683. Change image size
from skimage.transform import rescale, resize, downscale_local_mean

# 크기를 1/2 size로 변경
image_resized = resize(image, (image.shape[0] // 2, image.shape[1] // 2), anti_aliasing=True)

print("Resize {} -> {}".format(image.shape, image_resized.shape))
io.imshow(image_resized)
Resize (140, 568, 3) -> (70, 284, 3)
4. Image rotation
from skimage.transform import rotate

# 90도 회전
rotate_image = rotate(image, 90, resize=True)

io.imshow(rotate_image)
5. Up-down, left-right symmetry (Flip)
import numpy as np

# 좌우
filp_lr_image = np.fliplr(image)
io.imshow(filp_lr_image)
# 상하
filp_ud_image = np.flipud(image)
io.imshow(filp_ud_image)
6. Crop image
# image[y1 : y2, x1 : x2]
cropped_image = image[0:150, 0:150]
io.imshow(cropped_image)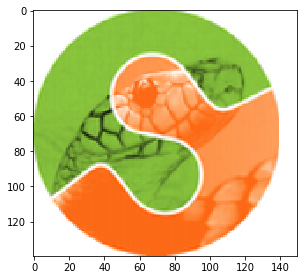
7. Draw Box
import numpy as np
from skimage import io, draw

image_resized = resize(image, (image.shape[0] // 2, image.shape[1] // 2), anti_aliasing=True)

color = np.array([0, 255, 0], dtype=np.uint8)

# x1, y1, w, h
bounding_box = (80, 12, 85, 33)

image_resized[bounding_box[1], bounding_box[0]:bounding_box[0] + bounding_box[2]] = color
image_resized[bounding_box[1]:bounding_box[1] + bounding_box[3], bounding_box[0]] = color

image_resized[bounding_box[1] + bounding_box[3], bounding_box[0]:bounding_box[0] + bounding_box[2]] = color
image_resized[bounding_box[1]:bounding_box[1] + bounding_box[3], bounding_box[0] + bounding_box[2]] = color

io.imshow(image_resized)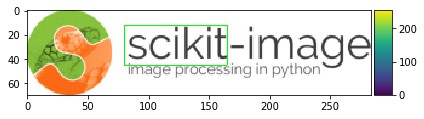
8. Image filtering
from skimage import filters
from skimage import io

gaussian_filter_image = filters.gaussian(image, sigma=10)

io.imshow(gaussian_filter_image)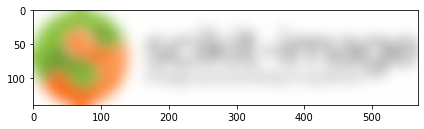
9. Merge images
merge_image = np.concatenate((filp_lr_image, filp_ud_image), axis=1)
io.imshow(merge_image)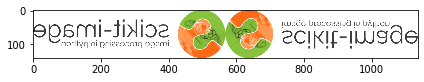
10. Color module
from skimage import io
from skimage import color
import matplotlib.pyplot as plt
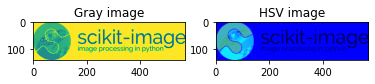
gray_image = color.rgb2gray(image)
hsv_image = color.rgb2hsv(image)
fig, axes = plt.subplots(nrows=1, ncols=2)
ax = axes.ravel()
ax[0].imshow(gray_image)
ax[0].set_title("Gray image")
ax[1].imshow(hsv_image)
ax[1].set_title("HSV image")Text(0.5, 1.0, 'HSV image')
11. ORB feature detector and binary descriptor
필요 하다면 더 찾아볼것
from skimage import transform
from skimage.color import rgb2gray
from skimage.feature import (match_descriptors, corner_harris, corner_peaks, ORB, plot_matches)
import matplotlib.pyplot as plt

image1 = io.imread("skimage_logo.png")
image1 = rgb2gray(image1)
image2 = rotate(image1, 180, resize=True)

descriptor_extractor = ORB(n_keypoints=200)
descriptor_extractor.detect_and_extract(image1)
keypoints1 = descriptor_extractor.keypoints
descriptors1 = descriptor_extractor.descriptors

descriptor_extractor.detect_and_extract(image2)
keypoints2 = descriptor_extractor.keypoints
descriptors2 = descriptor_extractor.descriptors

matches12 = match_descriptors(descriptors1, descriptors2, cross_check=True)

fig, ax = plt.subplots(nrows=1, ncols=1)
plt.gray()

ax.axis('off')
ax.set_title("Original Image vs. Transformed Image")
plot_matches(ax, image1, image2, keypoints1, keypoints2, matches12)
12. BRIEF binary descriptor
from skimage import transform
from skimage.feature import (match_descriptors, corner_peaks, corner_harris, plot_matches, BRIEF)
from skimage.color import rgb2gray
import matplotlib.pyplot as plt

image1 = io.imread("skimage_logo.png")
image1 = rgb2gray(image1)
image2 = rotate(image1, 60, resize=True)

keypoints1 = corner_peaks(corner_harris(image1), min_distance=5, threshold_rel=0.1)
keypoints2 = corner_peaks(corner_harris(image2), min_distance=5, threshold_rel=0.1)

extractor = BRIEF()

extractor.extract(image1, keypoints1)
keypoints1 = keypoints1[extractor.mask]
descriptors1 = extractor.descriptors

extractor.extract(image2, keypoints2)
keypoints2 = keypoints2[extractor.mask]
descriptors2 = extractor.descriptors

matches12 = match_descriptors(descriptors1, descriptors2, cross_check=True)

fig, ax = plt.subplots(nrows=1, ncols=1)
plt.gray()

ax.axis('off')
ax.set_title("Original Image vs. Transformed Image")
plot_matches(ax, image1, image2, keypoints1, keypoints2, matches12)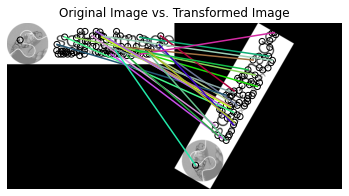

공부한 내용 정리