분류 알고리즘 선택
-
모든 경우에 뛰어난 성능을 낼 수 있는 분류 모델은 없다
-
최소한 몇 개의 학습 알고리즘 성능을 비교하고 해당 문제에 최선인 모델을 선택하는 것이 항상 권장
-
분류 모델의 예측 성능과 계산 성능은 학습에 사용하려는 데이터에 크게 의존한다
- 특성이나 샘플의 개수
- 데이터셋에 있는 잡음 데이터의 양
- 클래스가 선형적으로 구분되는지 아닌지에 따라
-
머신러닝 알고리즘을 훈련하기 위한 다섯 가지 주요 단계
- 특성을 선택하고 훈련 샘플을 모은다
- 성능 지표를 선택
- 분류 모델과 최적화 알고리즘을 선택
- 모델의 성능을 평가
- 알고리즘을 튜닝
퍼셉드론 훈련
from sklearn import datasets
import numpy as np

iris = datasets.load_iris()
X = iris.data[:, [2, 3]] #꽃잎 길이와 꽃잎 너비 특성
y = iris.target # 꽃 품종


print('클래스 레이블:', np.unique(y))

from sklearn.model_selection import train_test_split

X_train, X_test, y_train, y_test = train_test_split(
    X, y, test_size=0.3, random_state=1, stratify=y)
 # 위 함수를 사용하여 x와 u 배열을 랜덤하게 나눈다. 30%는 테스트 데이터 , 70%는 훈련 데이터가 된다.
 # 데이터셋 분할 전 무작위로 섞기 위해 사용되는 유사 난수 생성기에 random_state 매개변수로 고정된 랜덤 시드를 전달.
 # stratify=y를 통해 계층화 기능을 사용한다.
print('y의 레이블 카운트:', np.bincount(y))
print('y_train의 레이블 카운트:', np.bincount(y_train))
print('y_test의 레이블 카운트:', np.bincount(y_test))
y의 레이블 카운트: [50 50 50]
y_train의 레이블 카운트: [35 35 35]
y_test의 레이블 카운트: [15 15 15]
random_state=1을 통해 랜덤 시드를 고정
stratify=y를 통해 계층화 기능을 사용
계층화란 데이터셋과 테스트 데이터셋의 클래스 레이블 비율을 입력 데이터셋과 동일하게 만드는 것
표준화
#StandardScaler 클래스를 사용하여 특성을 표준화
from sklearn.preprocessing import StandardScaler

sc = StandardScaler()
sc.fit(X_train)
X_train_std = sc.transform(X_train)
X_test_std = sc.transform(X_test)- 특성 차원마다 샘플 평균과 표준 편차를 계산해 훈련 데이터셋을 표준화
- 훈련 데이터셋과 테스트 데이터셋의 샘플이 서로 같은 비율로 이동되도록 동일한 샘플 평균과 표준 편차를 사용하여 테스트 데이터셋을 표준화
- StandardScaler의 fit 매소드는 훈련 데이터셋의 각 특성 차원마다 샘플평균과 표준편차를 계산한다.
-transform 메소드를 호출하면 게산된 샘플평균과 표쥰편차를 사용하여 데스트 데이터셋을 표준화한다.
from sklearn.linear_model import Perceptron

ppn = Perceptron(eta0=0.1, random_state=1)
ppn.fit(X_train_std, y_train)
사이킷런의 알고리즘은 대부분 기본적으로 OvR (One-versus-Rest) 방식을 사용하여 다중 분류를 지원합니다 .
y_pred = ppn.predict(X_test_std)
print('잘못 분류된 샘플 개수: %d' % (y_test != y_pred).sum())
잘못 분류된 샘플 개수: 1
- 45개의 샘플에서 한 개를 잘못 분류
- 테스트 데이터셋에 대한 분류 오차는 약 0.022 또는 2.2%(1/45)
from sklearn.metrics import accuracy_score

print('정확도: %.3f' % accuracy_score(y_test, y_pred))
print('정확도: %.3f' % ppn.score(X_test_std, y_test))
'''
1234
from sklearn.metrics import accuracy_score

print('정확도: %.3f' % accuracy_score(y_test, y_pred))
print('정확도: %.3f' % ppn.score(X_test_std, y_test))
정확도: 0.978
정확도: 0.978
시각화
from matplotlib.colors import ListedColormap
import matplotlib.pyplot as plt


def plot_decision_regions(X, y, classifier, test_idx=None, resolution=0.02):

    # 마커와 컬러맵을 설정합니다.
    markers = ('s', 'x', 'o', '^', 'v')
    colors = ('red', 'blue', 'lightgreen', 'gray', 'cyan')
    cmap = ListedColormap(colors[:len(np.unique(y))])

    # 결정 경계를 그립니다.
    x1_min, x1_max = X[:, 0].min() - 1, X[:, 0].max() + 1
    x2_min, x2_max = X[:, 1].min() - 1, X[:, 1].max() + 1
    xx1, xx2 = np.meshgrid(np.arange(x1_min, x1_max, resolution),
                           np.arange(x2_min, x2_max, resolution))
    Z = classifier.predict(np.array([xx1.ravel(), xx2.ravel()]).T)
    Z = Z.reshape(xx1.shape)
    plt.contourf(xx1, xx2, Z, alpha=0.3, cmap=cmap)
    plt.xlim(xx1.min(), xx1.max())
    plt.ylim(xx2.min(), xx2.max())

    for idx, cl in enumerate(np.unique(y)):
        plt.scatter(x=X[y == cl, 0],
                    y=X[y == cl, 1],
                    alpha=0.8,
                    c=colors[idx],
                    marker=markers[idx],
                    label=cl,
                    edgecolor=None if idx==1 else 'black')

    # 테스트 샘플을 부각하여 그립니다.
    if test_idx:
        # 모든 샘플을 그립니다.
        X_test, y_test = X[test_idx, :], y[test_idx]

        plt.scatter(X_test[:, 0],
                    X_test[:, 1],
                    facecolor='none',
                    edgecolor='black',
                    alpha=1.0,
                    linewidth=1,
                    marker='o',
                    s=100,
                    label='test set')


# 수정된 plot_Decision_reigons 함수에 결과 그래프에 표시할 테스트 샘플 인덱스를 지정할 수 있습니다.

X_combined_std = np.vstack((X_train_std, X_test_std))
y_combined = np.hstack((y_train, y_test))

plot_decision_regions(X=X_combined_std, y=y_combined,
                      classifier=ppn, test_idx=range(105, 150))
plt.xlabel('petal length [standardized]')
plt.ylabel('petal width [standardized]')
plt.legend(loc='upper left')

plt.tight_layout()
# plt.savefig('images/03_01.png', dpi=300)
plt.show()
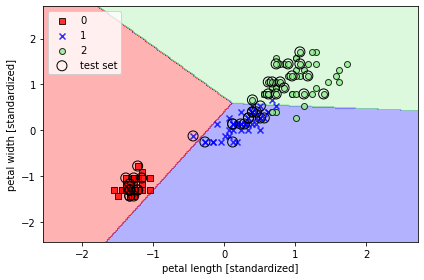
완벽하게 선형으로 분류되지 못한다.
로지스틱 회귀를 사용한 클래스 확률 모델링
- 퍼셉트론 규칙의 큰 단점은 클래스가 선형적으로 구분되지 않을 때 수렴할 수 없다는 것
- 선형 이진 분류 문제에 더 강력한 다른 알고리즘인 로지스틱 회귀( logistic regression ) 을 사용하는것이 더 현명한 방법
로지스틱 회귀
- 손쉽게 다중 클래스 설정으로 일반화할 수 있다.
- 오즈비에 로그 함수( 로그 오즈 )를 취해 로짓( logit )함수를 정의
logit(P)=log (1−p) p
- logit 함수는 0과 1 사이의 입력값을 받아 실수 범위 값으로 변환
오즈비(특정 이벤트가 발생할 확률) , (는 양성 샘플에 대한 확률)
로짓 함수 :
이면, 이고, 이므로
처럼 쓸 수 있다.
따라서 양성 샘플일 확률
import matplotlib.pyplot as plt
import numpy as np


def sigmoid(z):
    return 1.0 / (1.0 + np.exp(-z))

z = np.arange(-7, 7, 0.1)
phi_z = sigmoid(z)

plt.plot(z, phi_z)
plt.axvline(0.0, color='k')
plt.ylim(-0.1, 1.1)
plt.xlabel('z')
plt.ylabel('$\phi (z)$')

# y 축의 눈금과 격자선
plt.yticks([0.0, 0.5, 1.0])
ax = plt.gca()
ax.yaxis.grid(True)

plt.tight_layout()
# plt.savefig('images/03_02.png', dpi=300)
plt.show()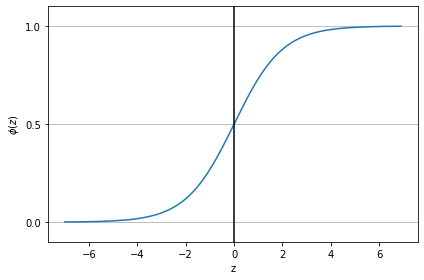
예측 확률 :
로지스틱 비용 함수의 가중치 학습하기
가능도 :
로그 가능도 :
로지스틱 비용 함수 :
손실 계산 :
def cost_1(z):
    return - np.log(sigmoid(z))


def cost_0(z):
    return - np.log(1 - sigmoid(z))

z = np.arange(-10, 10, 0.1)
phi_z = sigmoid(z)

c1 = [cost_1(x) for x in z]
plt.plot(phi_z, c1, label='J(w) if y=1')

c0 = [cost_0(x) for x in z]
plt.plot(phi_z, c0, linestyle='--', label='J(w) if y=0')

plt.ylim(0.0, 5.1)
plt.xlim([0, 1])
plt.xlabel('$\phi$(z)')
plt.ylabel('J(w)')
plt.legend(loc='best')
plt.tight_layout()

plt.show()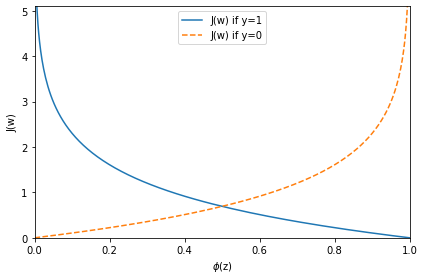
아달린 구현을 로지스틱 회귀 알고리즘으로 변경
이 함수로 에포크마다 모든 훈련 샘플을 분류하는 비용을 계산합니다. 선형 활성화 함수를 시그모이드 활성화로 바꾸고 임계 함수가 클래스 레이블 -1 과 1이 아니고 0과 1 을 반환하도록 변경합니다. 아달린 코드에 이런 변경 사항을 반영하면 로지스틱 회귀 모델을 얻을 수 있습니다.
class LogisticRegressionGD(object):
    """경사 하강법을 사용한 로지스틱 회귀 분류기

    매개변수
    ------------
    eta : float
      학습률 (0.0과 1.0 사이)
    n_iter : int
      훈련 데이터셋 반복 횟수
    random_state : int
      가중치 무작위 초기화를 위한 난수 생성기 시드

    속성
    -----------
    w_ : 1d-array
      학습된 가중치
    cost_ : list
      에포크마다 누적된 로지스틱 비용 함수 값

    """
    def __init__(self, eta=0.05, n_iter=100, random_state=1):
        self.eta = eta
        self.n_iter = n_iter
        self.random_state = random_state

    def fit(self, X, y):
        """훈련 데이터 학습

        매개변수
        ----------
        X : {array-like}, shape = [n_samples, n_features]
          n_samples 개의 샘플과 n_features 개의 특성으로 이루어진 훈련 데이터
        y : array-like, shape = [n_samples]
          타깃값

        반환값
        -------
        self : object

        """
        rgen = np.random.RandomState(self.random_state)
        self.w_ = rgen.normal(loc=0.0, scale=0.01, size=1 + X.shape[1])
        self.cost_ = []

        for i in range(self.n_iter):
            net_input = self.net_input(X)
            output = self.activation(net_input)
            errors = (y - output)
            self.w_[1:] += self.eta * X.T.dot(errors)
            self.w_[0] += self.eta * errors.sum()

            # 오차 제곱합 대신 로지스틱 비용을 계산합니다.
            cost = -y.dot(np.log(output)) - ((1 - y).dot(np.log(1 - output)))
            self.cost_.append(cost)
        return self

    def net_input(self, X):
        """최종 입력 계산"""
        return np.dot(X, self.w_[1:]) + self.w_[0]

    def activation(self, z):
        """로지스틱 시그모이드 활성화 계산"""
        # 대신 from scipy.special import expit; expit(z) 을 사용할 수 있습니다.
        return 1. / (1. + np.exp(-np.clip(z, -250, 250)))

    def predict(self, X):
        """단위 계단 함수를 사용하여 클래스 레이블을 반환합니다"""
        return np.where(self.net_input(X) >= 0.0, 1, 0)
        # 다음과 동일합니다.
        # return np.where(self.activation(self.net_input(X)) >= 0.5, 1, 0)

        X_train_01_subset = X_train_std[(y_train == 0) | (y_train == 1)]
y_train_01_subset = y_train[(y_train == 0) | (y_train == 1)]

lrgd = LogisticRegressionGD(eta=0.05, n_iter=1000, random_state=1)
lrgd.fit(X_train_01_subset,
         y_train_01_subset)

plot_decision_regions(X=X_train_01_subset,
                      y=y_train_01_subset,
                      classifier=lrgd)

plt.xlabel('petal length [standardized]')
plt.ylabel('petal width [standardized]')
plt.legend(loc='upper left')

plt.tight_layout()
# plt.savefig('images/03_05.png', dpi=300)
plt.show()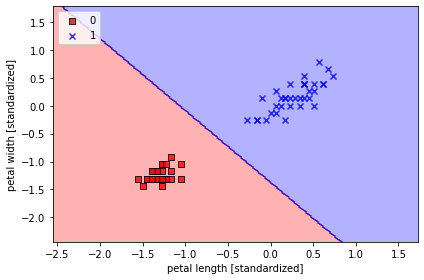
사이킷런을 사용하여 로지스틱 회귀 모델 훈련
- sklearn.linear_model.LogisticRegression의 fit 메서드를 사용하여 표준화 처리된 붓꽃 데이터셋의 클래스 세개를 대상으로 모델 훈련
from sklearn.linear_model import LogisticRegression

lr = LogisticRegression(C=100.0, random_state=1)
lr.fit(X_train_std, y_train)

plot_decision_regions(X_combined_std, y_combined,
                      classifier=lr, test_idx=range(105, 150))
plt.xlabel('petal length [standardized]')
plt.ylabel('petal width [standardized]')
plt.legend(loc='upper left')
plt.tight_layout()
# plt.savefig('images/03_06.png', dpi=300)
plt.show()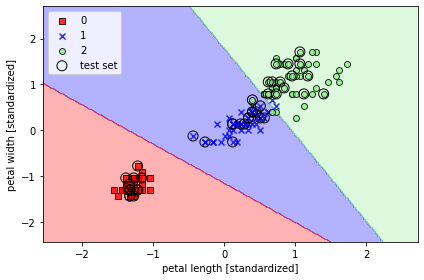
훈련 샘플이어떤 클래스에 속할 확률은 predict_proba 메서드를 사용하여 계산 합니다. 예를 들어 테스트 데이터셋에 있는 처음 새게의 샘플 확률을 다음과 같이 예측할수 있습니다.
lr.predict_proba(X_test_std[:3, :])array([[1.52213484e-12, 3.85303417e-04, 9.99614697e-01],
[9.93560717e-01, 6.43928295e-03, 1.14112016e-15],
[9.98655228e-01, 1.34477208e-03, 1.76178271e-17]])
첫번째 행: 첫번째 붓꽃 클래스 소속확률
두번째 행: 두번째 붓꽃 클래스 소속확률
세번째 행: 세번째 붓꽃 클래스 소속확률
행을 다 더하면 당연하게 1이 나온다.
lr = LogisticRegression(C=100.0 ∙∙∙) 에서 C를 통해 규제 강도를 조절
훈련 샘플이 어떤 클래스에 속할 확률은 predict_proba 메서드를 사용하여 계산
이탤릭체 텍스트## 규제를 사용하여 과대적합 피하기
과대적합
- 모델이 훈련 데이터로는 잘 동작하지만 본 적 없는 데이터로는 잘 일반화되지 않는 현상
- 모델이 과대적합일 때 분산이 크다고 말한다
- 모델 파라미터가 너무 많아 주어진 데이터에서 너무 복잡한 모델을 만든 것
과소적합
- 훈련 데이터에 있는 패턴을 감지할 정도로 충분히 모델이 복잡하지 않다는 것을 의미
- 새로운 데이터에서도 성능이 낮다
분산
- 모델을 여러번 훈련했을 떄 특정 샘플에 대한 예측의 일관성 또는 변동성을 측정합니다.
- 높은 분산은 과대적합
편향
- 다른 훈련 데이터셋에서 여러번 훈련했을 때 예특이 정확한 값에서 얼마나 벗어났는지를 측정합니다.
- 높은 편향은 과소적합
weights, params = [], []
for c in np.arange(-5, 5):
    lr = LogisticRegression(C=10.**c, random_state=1, multi_class='ovr')
    lr.fit(X_train_std, y_train)
    weights.append(lr.coef_[1])
    params.append(10.**c)

weights = np.array(weights)
plt.plot(params, weights[:, 0],
         label='petal length')
plt.plot(params, weights[:, 1], linestyle='--',
         label='petal width')
plt.ylabel('weight coefficient')
plt.xlabel('C')
plt.legend(loc='upper left')
plt.xscale('log')
# plt.savefig('images/03_08.png', dpi=300)
plt.show()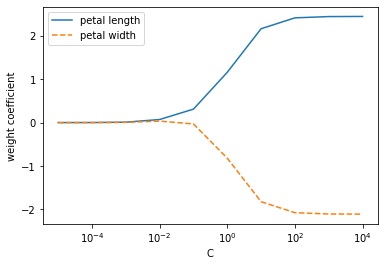
규제는 과도한 파라미터 (가중치) 값을 제한하기 위해 추가적인 정보 (편향)를 주입하는 개념입니다.
L2 규제(L2 노름의 제곱) :
L1 규제(L1 노름) :
규제가 추가된 비용 함수 :
C는 의 역수로 증가시키면 규제가 작아지고, 감소시키면 규제가 커짐. 기본값은 1.0penalty매개변수 기본값'l2', L1 규제를 위해'l1'을 지정할 수 있음.
최대마진
마진 : 클래스를 구분하는 초평면( 결정 경계 )과 이 초평편이 가장 가까운 훈련 샘플 사이의 거리로 정의
최대 마진
- 일반화 오차가 낮아지는 경향이 있기 때문에 큰 마진의 결정 경계를 알아야 한다
- 작은 마진의 모델은 과대적합이되기 쉽다
서포트 벡터 머신
-
서포트 벡터 머신(이하 SVM)은 결정 경계(Decision Boundary), 즉 분류를 위한 기준 선을 정의하는 모델이다. 그래서 분류되지 않은 새로운 점이 나타나면 경계의 어느 쪽에 속하는지 확인해서 분류 과제를 수행할 수 있게 된다.
-
만약 데이터에 2개의 속성만이 있다면 결정경계는 간단한 선 형태가 될 것이다.
-
그러나 속성이 3개로 늘어난다면 결정경계를 3차원으로 그려야 한다.
그리고 이 때의 결정 경계는 선이 아닌 평면이 된다. -
속성의 개수가 늘어날수록 복잡해 지는데, 이를 초평면 (hyperplane)이라고 한다.
최적의 결정 경계는 마진을 최대화 한다.
- 큰 마진의 결정 경계를 원하는 이유는 일반화 오차가 낮아지는 경향이 있기 때문
- 작은 마진의 모델은 과대적합되기 쉽다.
슬랙 변수를 사용하여 비선형 분류 문제 다루기
슬랙 변수 : 선형적으로 구분되지 않는 데이터에서 선형 제약 조건을 완화할 필요가 있기 때문에 도입
- 이를 통해 적절히 비용을 손해 보면서 분류 오차가 있는 상황에서 최적화 알고리즘이 수렴함.
from sklearn.svm import SVC

svm = SVC(kernel='linear', C=1.0, random_state=1)
svm.fit(X_train_std, y_train)

plot_decision_regions(X_combined_std,
                      y_combined,
                      classifier=svm,
                      test_idx=range(105, 150))
plt.xlabel('petal length [standardized]')
plt.ylabel('petal width [standardized]')
plt.legend(loc='upper left')
plt.tight_layout()
# plt.savefig('images/03_11.png', dpi=300)
plt.show()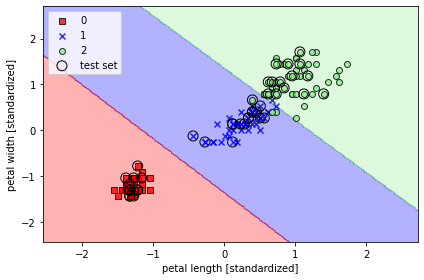
- 규제가 있는 로지스틱 회귀 모델은 C값을 줄이면 편향이 늘고 모델 분산이 줄어든다
- 사이킷런을 사용할 경우 데이터셋이 너무 커서 컴퓨터 메모리 용량에 맞지 않는 경우가 있다 -> 이에 대한 대안으로 SGDClassifier 클래스를 제공
from sklearn.linear_model import SGDClassifier

ppn = SGDClassifier(loss='perceptron')
lr = SGDClassifier(loss='log')
svm = SGDClassifier(loss='hinge')
커널 SVM을 사용하여 비선형 문제 풀기
선형적으로 구분되지 않은 데이터를 위한 커널 방법
# 넘파이 LOGICAL_XOR 함수를 사용하여 xor 형태의 간단한 데이터셋을 만든다.
#대략 100개의 샘플은 클래스 레이블 1로 할당되고 나머지 100개의 샘플은 클래스레이블 -1로 할당.

import matplotlib.pyplot as plt
import numpy as np

np.random.seed(1)
X_xor = np.random.randn(200, 2)
y_xor = np.logical_xor(X_xor[:, 0] > 0,
                       X_xor[:, 1] > 0)
y_xor = np.where(y_xor, 1, -1)

plt.scatter(X_xor[y_xor == 1, 0],
            X_xor[y_xor == 1, 1],
            c='b', marker='x',
            label='1')
plt.scatter(X_xor[y_xor == -1, 0],
            X_xor[y_xor == -1, 1],
            c='r',
            marker='s',
            label='-1')

plt.xlim([-3, 3])
plt.ylim([-3, 3])
plt.legend(loc='best')
plt.tight_layout()
# plt.savefig('images/03_12.png', dpi=300)
plt.show()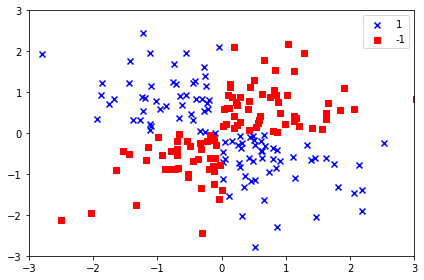
코드를 실행하면 위와같이 랜덤한 잡음이 섞인 XOR 데이터셋 생성됨
선형적으로 구분되지 않는 데이터를 다루는 커널 방법의 기본 아이디어는 매핑 함수( ϕ )를 사용하여 고차원 공간에 투영하는 것
- SVM으로 비선형 문제를 풀기 위해 매핑 함수를 사용하여 훈련 데이터를 고차원 특성 공간으로 변환
- 새로운 특성 공간에서 데이터를 분류하는 선형 SVM 모델을 훈련
- 새로운 특성을 만드는 계산 비용이 매우 비싸다
- 고차원 공간에서 두 클래스를 구분하는 선형 초평면은 원본 특성 공간으로 되돌리면 비선형 결정 경계가 된다.
커널 기법을 사용해 고차원 공간에서 분할 초평면 찾기
방사 기저 함수(Radial Basis Function) :
svm = SVC(kernel='rbf', random_state=1, gamma=0.10, C=10.0)
svm.fit(X_xor, y_xor)
plot_decision_regions(X_xor, y_xor,
                      classifier=svm)

plt.legend(loc='upper left')
plt.tight_layout()
 plt.savefig('images/03_14.png', dpi=300)
plt.show()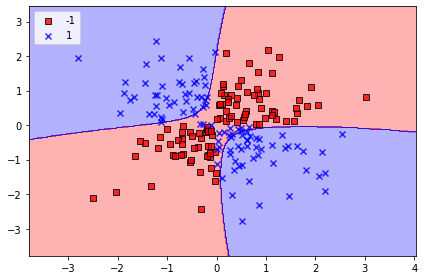
# r값 작게 했을 떄
from sklearn.svm import SVC

svm = SVC(kernel='rbf', random_state=1, gamma=0.2, C=1.0)
svm.fit(X_train_std, y_train)

plot_decision_regions(X_combined_std, y_combined,
                      classifier=svm, test_idx=range(105, 150))
plt.xlabel('petal length [standardized]')
plt.ylabel('petal width [standardized]')
plt.legend(loc='upper left')
plt.tight_layout()
# plt.savefig('images/03_15.png', dpi=300)
plt.show()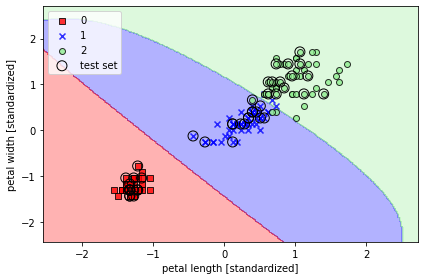
# r값 매우 크게 했을 때
svm = SVC(kernel='rbf', random_state=1, gamma=100.0, C=1.0)
svm.fit(X_train_std, y_train)

plot_decision_regions(X_combined_std, y_combined,
                      classifier=svm, test_idx=range(105, 150))
plt.xlabel('petal length [standardized]')
plt.ylabel('petal width [standardized]')
plt.legend(loc='upper left')
plt.tight_layout()
# plt.savefig('images/03_16.png', dpi=300)
plt.show()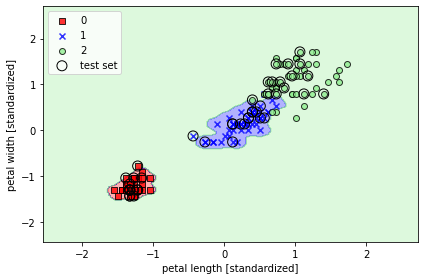
정보 이득 최대화, 자원 최대로 활용하기
import matplotlib.pyplot as plt
import numpy as np


def gini(p):
    return p * (1 - p) + (1 - p) * (1 - (1 - p))


def entropy(p):
    return - p * np.log2(p) - (1 - p) * np.log2((1 - p))


def error(p):
    return 1 - np.max([p, 1 - p])

x = np.arange(0.0, 1.0, 0.01)

ent = [entropy(p) if p != 0 else None for p in x]
sc_ent = [e * 0.5 if e else None for e in ent]
err = [error(i) for i in x]

fig = plt.figure()
ax = plt.subplot(111)
for i, lab, ls, c, in zip([ent, sc_ent, gini(x), err],
                          ['Entropy', 'Entropy (scaled)',
                           'Gini impurity', 'Misclassification error'],
                          ['-', '-', '--', '-.'],
                          ['black', 'lightgray', 'red', 'green', 'cyan']):
    line = ax.plot(x, i, label=lab, linestyle=ls, lw=2, color=c)

ax.legend(loc='upper center', bbox_to_anchor=(0.5, 1.15),
          ncol=5, fancybox=True, shadow=False)

ax.axhline(y=0.5, linewidth=1, color='k', linestyle='--')
ax.axhline(y=1.0, linewidth=1, color='k', linestyle='--')
plt.ylim([0, 1.1])
plt.xlabel('p(i=1)')
plt.ylabel('impurity index')
# plt.savefig('images/03_19.png', dpi=300, bbox_inches='tight')
plt.show()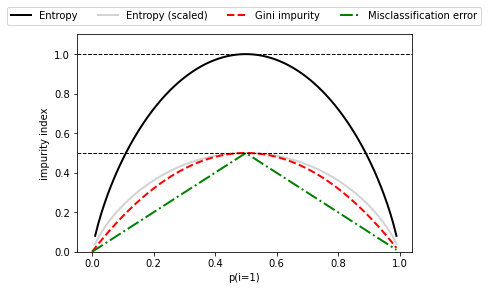
결정 트리 학습
- 결정트리( decision tree )분류기는 설명이 중요할 때 아주 유용한 모델
- 결정 알고리즘을 사용하면 트리의 루트에서 시작해서 정보이득 이 최대가 되는 특성으로 데이터를 나눈다.
- 반복 과정을 통해 이프 노트( leaf node )가 순수해질 때까지 모든 자식 노드에서 이 분할 작업을 반복
- 특성 공간을 사각 격자로 나누기 때문에 복잡한 결정 경계를 만들 수 있다
- 결정 트리가 깊어질수록 결정 경계가 복잡해지고 과대적합되기 쉽기 때문에 주의해야 한다
- 일반적으로 트리의 최대 깊이를 제한하여 트리를 가지치기한다.
from sklearn.tree import DecisionTreeClassifier

tree_model = DecisionTreeClassifier(criterion='gini',
                                    max_depth=4,
                                    random_state=1)
tree_model.fit(X_train, y_train)

X_combined = np.vstack((X_train, X_test)) #배열을 아래로 결합, 열 개수가 같아야함
y_combined = np.hstack((y_train, y_test)) #배열을 옆으로 결합, 행 개수가 같아야함
plot_decision_regions(X_combined, y_combined,
                      classifier=tree_model,
                      test_idx=range(105, 150))

plt.xlabel('petal length [cm]')
plt.ylabel('petal width [cm]')
plt.legend(loc='upper left')
plt.tight_layout()
# plt.savefig('images/03_20.png', dpi=300)
plt.show()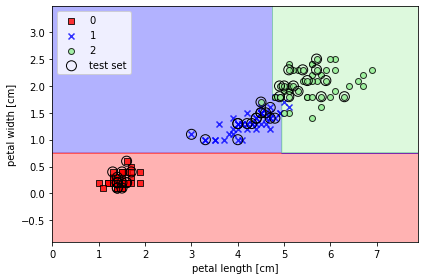
from sklearn import tree

plt.figure(figsize=(10,10))
tree.plot_tree(tree_model)
plt.show()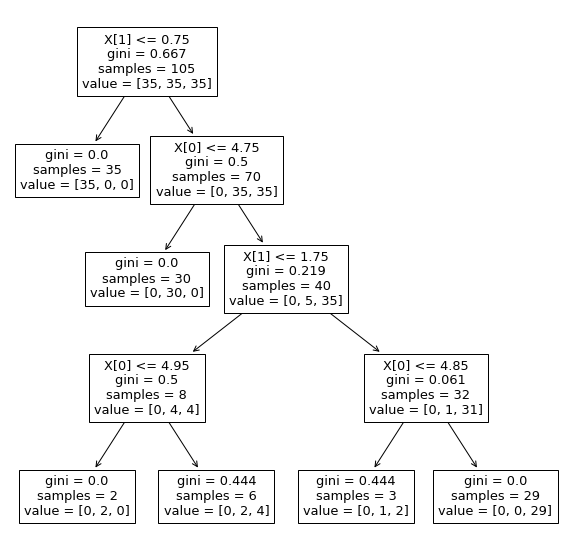
랜덤 포레스트로 여러개의 결정 트리 연결
앙상블 방법은 뛰어난 분류 성능과 과대적합에 안정적이기 때문에 많이 쓰인다.
개개의 트리는 분산이 높은 문제가 있지만 앙상블은 견고한 모델을 만들어 일반화 성능을 옾이고 과대적합의 위험을 줄인다.
- 랜덤 포레스트
- 결정 트리의 앙상블
- 여러개의 결정트리를 평균내는 것
- 견고한 모델을 만들어 일반화 성능을 높이고 과대적합의 위험을 줄일 수 있다.
-
n개의 랜덤한 부트스트랩( bootstrap ) 샘플을 뽑는다
-
부트스트랩 샘플에서 결정 트리를 학습
a. 중복을 허용하지 않고 랜덤하게 d개의 특성을 선택
b. 정보 이득과 같은 목적 함수를 기준으로 최선의 분할을 만드는 특성을 사용해서 노드를 분할
-
1 ~ 2단계를 k번 반복
각 트리의 예측을 모아 다수결 투표로 클래스 레이블을 할당
from sklearn.ensemble import RandomForestClassifier

forest = RandomForestClassifier(criterion='gini',
                                n_estimators=25,
                                random_state=1,
                                n_jobs=2)
forest.fit(X_train, y_train)

plot_decision_regions(X_combined, y_combined,
                      classifier=forest, test_idx=range(105, 150))

plt.xlabel('petal length [cm]')
plt.ylabel('petal width [cm]')
plt.legend(loc='upper left')
plt.tight_layout()
# plt.savefig('images/03_22.png', dpi=300)
plt.show()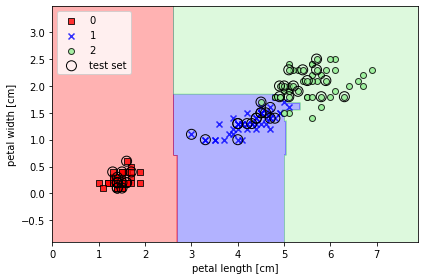
- n_estimators 매개변수로 25개의 결정 트리를 사용
- 노드를 분할하는 불순도 지표로는 지니 불순도를 사용
k-최근접 이웃: 게으른 학습 알고리즘
훈련 데이터에서 판별 함수를 학습하는 대신 훈련 데이터셋을 메모리에 저장한다
- 숫자 k와 거리 측정 기준을 선택
- 분류하려는 샘플에서 k개의 최근접 이웃을 찾는다
- 다수결 투표를 통해 클래스 레이블을
선택한 거리 측정 기준에 따라서 KNN 알고리즘이 훈련 데이터셋에서 분류하려는 포인트와 가장 가까운 샘플 k개를 찾는다
새로운 데이터 포인트의 클래스 레이블은 이 k개의 최근접 이웃에서 다수결 투표를 하여 결정-> 메모리 기반 방식의 분류기는 수집된 새로운 훈련 데이터에 즉시 적응할 수 있는 것이 주요 장점이다. but 계산 복잡도가 단점
모수모델: 새로운 데이터 포인트를 분류할 수 있는 함수를 학습하기 위해 훈련 데이터셋에서 모델 파라미터를 추정한다.
- 퍼셉트론, 로지스틱 회귀, 선형 SVM
비모수모델: 고정된 개수의 파라미터로 설명할 수 없다. 훈련 데이터가 늘어남에 따라 파라미터 개수도 늘어난다.
- 트리 , 랜덤 포레스트, 커널 SVM, KNN
인스턴스 기반 모델은 훈련 데이터셋을 메모리에 저장하는것이 특징. 게으른 학습 인스턴스 기반 학습의 특별한 경우이며 학습 과정에 비용이 전혀 들지 않는다.
#유클리디안 거리 측정 방식을 사용한 사이킷런의 KNN 모델
from sklearn.neighbors import KNeighborsClassifier

knn = KNeighborsClassifier(n_neighbors=5,
                           p=2,
                           metric='minkowski')
knn.fit(X_train_std, y_train)

plot_decision_regions(X_combined_std, y_combined,
                      classifier=knn, test_idx=range(105, 150))

plt.xlabel('petal length [standardized]')
plt.ylabel('petal width [standardized]')
plt.legend(loc='upper left')
plt.tight_layout()
# plt.savefig('images/03_24.png', dpi=300)
plt.show()
적절한 k를 선택하는 것은 과대적합과 과소적합 사이에서 올바른 균형을 잡기 위해 중요하다. 데이터셋의 특성에 맞는 알맞은 거리 측정 지표를 선택해야함.

