쿼리 최적화와 N+1문제 해결
저번 글에 이어 2가지 문제점을 확인하였다.
1. vuser 수 증가에 따른 tps 하락
2. 전반적인 tps 수치가 낮음
쿼리 최적화
요청에서 사용하는 쿼리는 다음과 같다
 @Query("SELECT p FROM Answer p WHERE p.picked = :user AND p.createdAt BETWEEN :startDate AND :endDate ORDER BY p.createdAt DESC")
    Page<Answer> findAllByPickedAndCreatedAtBetween(Pageable pageable, @Param("user") Users user, @Param("startDate") LocalDateTime startDate, @Param("endDate") LocalDateTime endDate);
쿼리의 성능을 알아보기 위해 실행계획을 살펴 보았다.
EXPLAIN ANALYZE
SELECT * FROM answer
WHERE picked_id = 123
AND created_at BETWEEN '2025-03-01 00:00:00' AND '2025-03-19 23:59:59'
ORDER BY created_at DESC
LIMIT 10;
위 sql을 사용하여 실행 계획 확인
-> Limit: 10 row(s)  (cost=12.1 rows=10) (actual time=0.162..0.163 rows=10 loops=1)\n
	-> Sort: answer.created_at DESC, limit input to 10 row(s) per chunk  (cost=12.1 rows=12) (actual time=0.161..0.162 rows=10 loops=1)\n
		-> Filter: (answer.created_at between \'2024-03-01 00:00:00\' and \'2025-03-19 23:59:59\')  (cost=12.1 rows=12) (actual time=0.129..0.137 rows=12 loops=1)\n
			-> Index lookup on answer using FKftxym69m5m6f3vpfcrp295w41 (picked_id=123)  (cost=12.1 rows=12) (actual time=0.123..0.126 rows=12 loops=1)\n
실행 계획 분석
- picked Id를 사용하여 index 사용하여 조회
- 필터링 처리
- sort작업
찾은 데이터를 필터링하고 sort까지 해야한다는 점을 개선하기 위해 picked_id와 created를 기준으로 복합 인덱스를 만들었다.
해결책: 복합인덱스 생성
CREATE INDEX idx_answer_picked_created ON answer (picked_id, created_at DESC);Limit: 10 row(s) (cost=15.4 rows=10) (actual time=0.197..0.2 rows=10 loops=1)
-> Index range scan on answer using idx_answer_picked_created over (picked_id = 123 AND '2025-03-19 23:59:59' <= created_at <= '2024-03-01 00:00:00'), with index condition: ((answer.picked_id = 123) and (answer.created_at between '2024-03-01 00:00:00' and '2025-03-19 23:59:59')) (cost=15.4 rows=12) (actual time=0.195..0.198 rows=10 loops=1)성능 향상이 없음
- 복합 인덱스가 없이 picked_id를 인덱스 풀스캔 하여 찾은 row 수가 고작 12개다. 따라서 필터링 후 소트까지 한다고 해도 고작 12개 이기 때문에 차이가 크지 않음
- picked_id=123으로 데이터를 1000개 박아 보자
- 그 후 복합인덱스 사용 전 후 비교
-> Limit: 10 row(s)  (cost=898 rows=10) (actual time=3.22..3.23 rows=10 loops=1)
    -> Sort: answer.created_at DESC, limit input to 10 row(s) per chunk  (cost=898 rows=1011) (actual time=3.22..3.22 rows=10 loops=1)
        -> Filter: (answer.created_at between '2024-03-01 00:00:00' and '2025-03-19 23:59:59')  (cost=898 rows=1011) (actual time=0.322..2.92 rows=850 loops=1)
            -> Index lookup on answer using idx_answer_picked_id (picked_id=123)  (cost=898 rows=1011) (actual time=0.312..2.4 rows=1011 loops=1)

 -> Limit: 10 row(s)  (cost=922 rows=10) (actual time=0.383..0.388 rows=10 loops=1)
    -> Index range scan on answer using idx_answer_picked_created over (picked_id = 123 AND '2025-03-19 23:59:59' <= created_at <= '2024-03-01 00:00:00'), with index condition: ((answer.picked_id = 123) and (answer.created_at between '2024-03-01 00:00:00' and '2025-03-19 23:59:59'))  (cost=922 rows=850) (actual time=0.382..0.386 rows=10 loops=1)
쿼리 성능 개선
- 찾은 rows수가 1000개 일때 actual time 3.23→0.388로 크게 개선 이 수치는 picked_id 가 많을 수록 더 커질 것
- 실행 계획을 보면 전에는 picked_id=123인 모든 rows를 찾지만 개선후에는 상위 10개만 찾아서 반환
성능테스트 진행
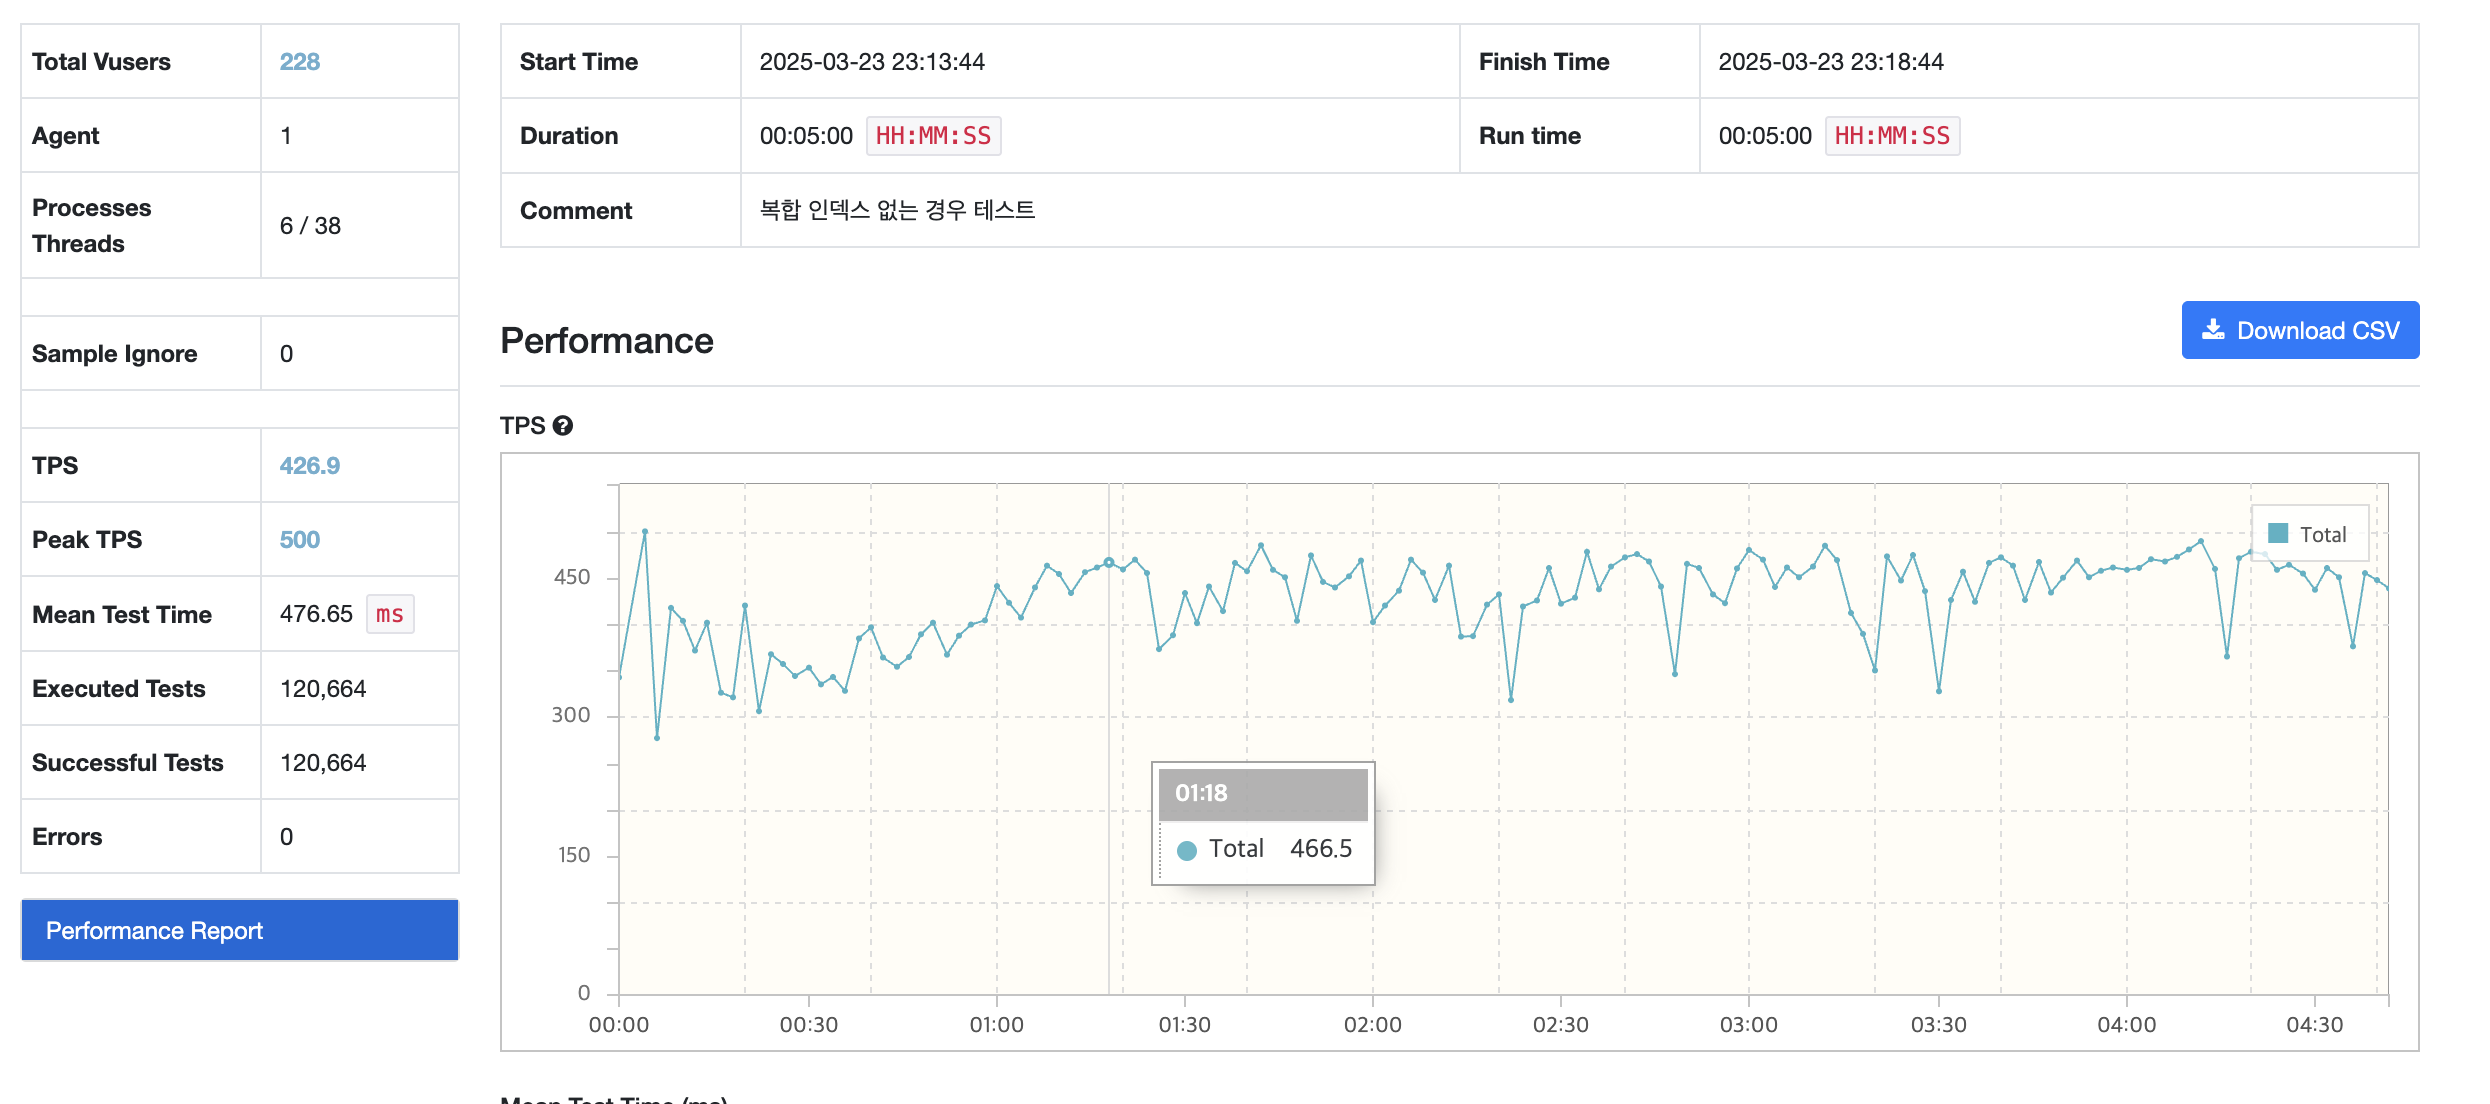
단일 인덱스의 경우
평균 tps: 426.9
복합 인덱스의 경우
평균 tps: 600
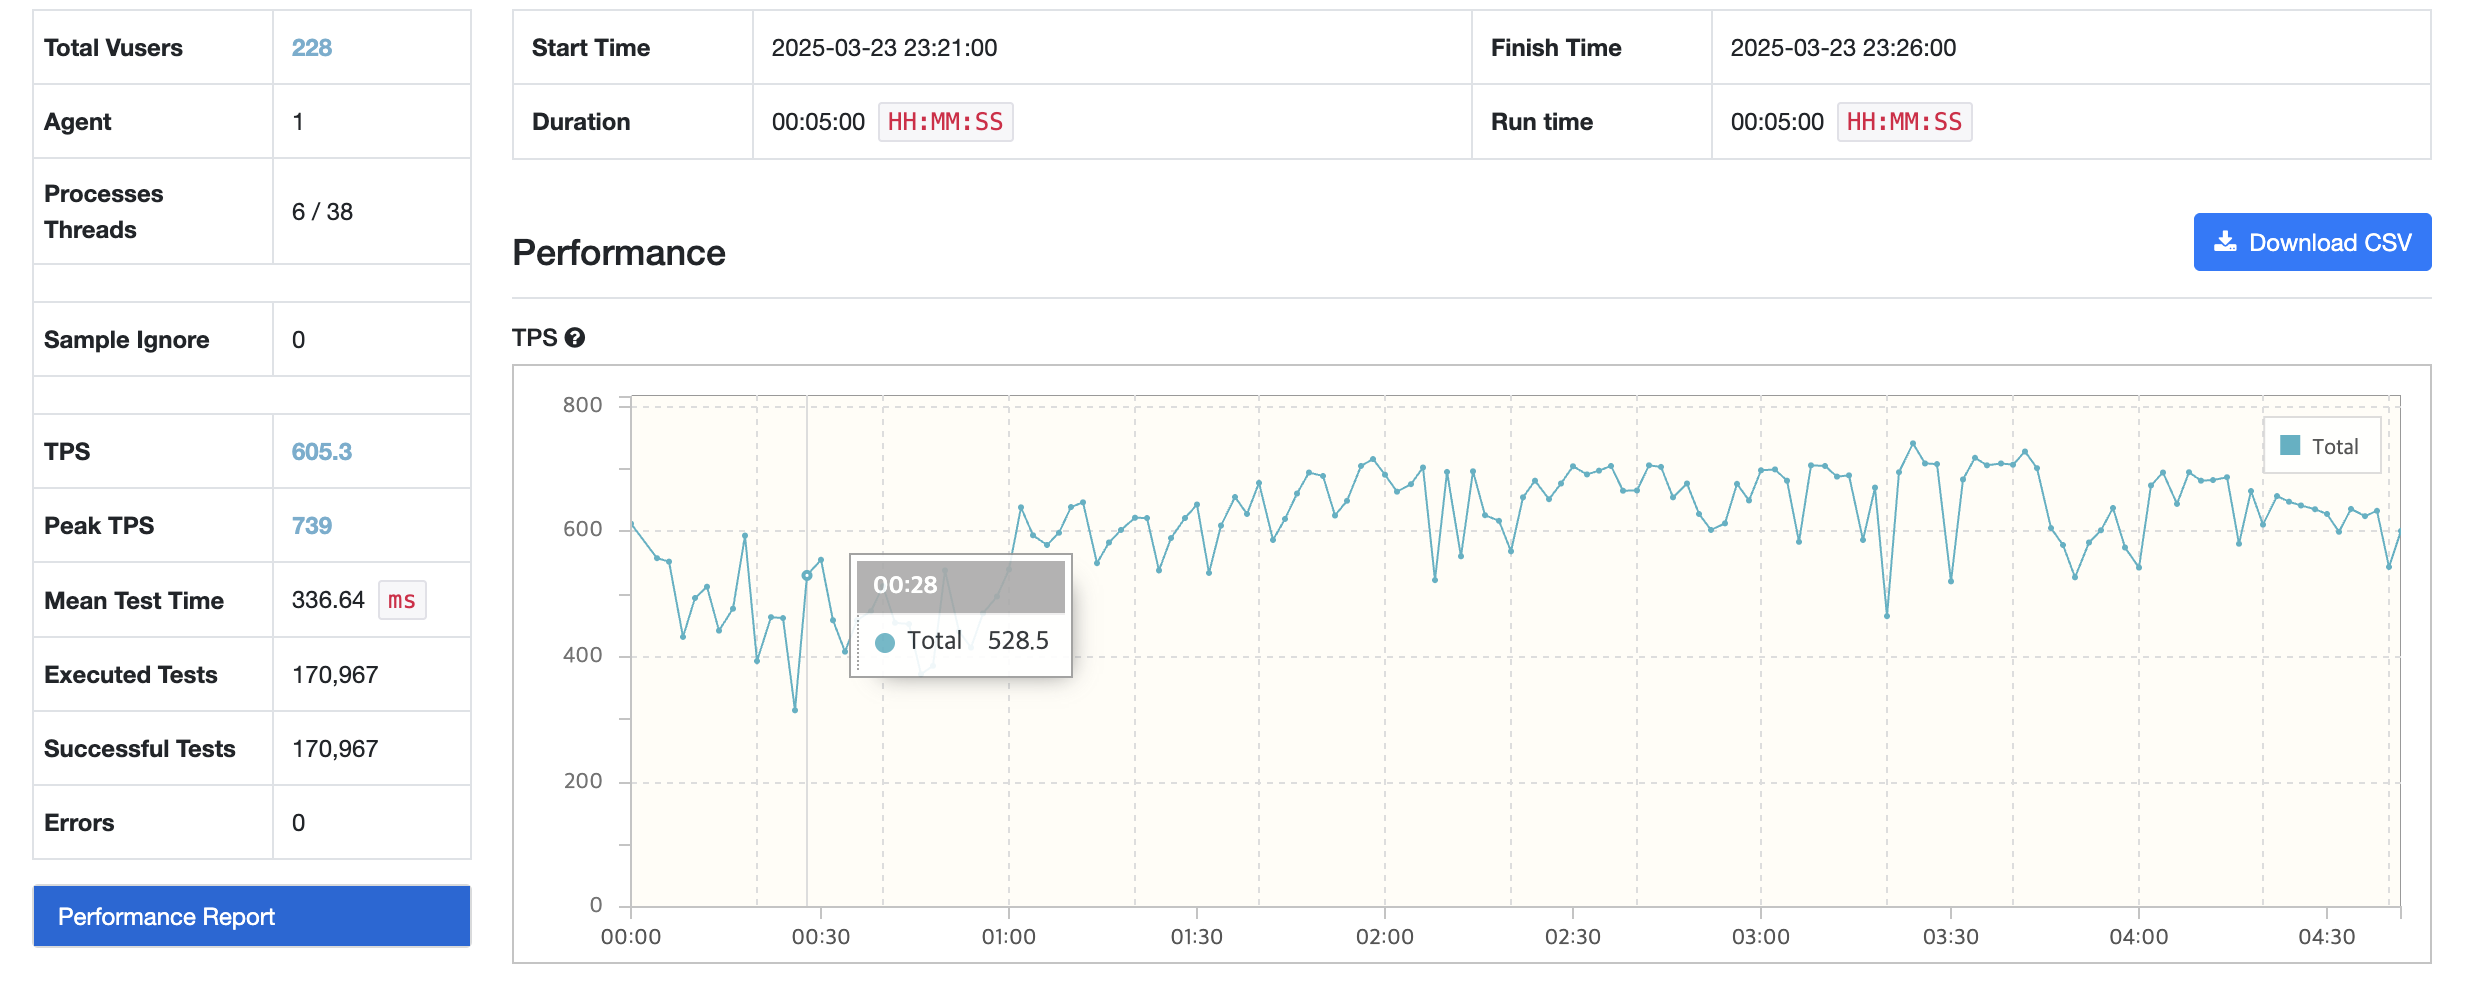
actual time이 개선되었지만 tps 자체는 크게 개선되지 않은 모습
아무리 생각해도 이상해서 intellij의 프로파일러를 사용해 어디서 병목현상을 일으키는지 확인
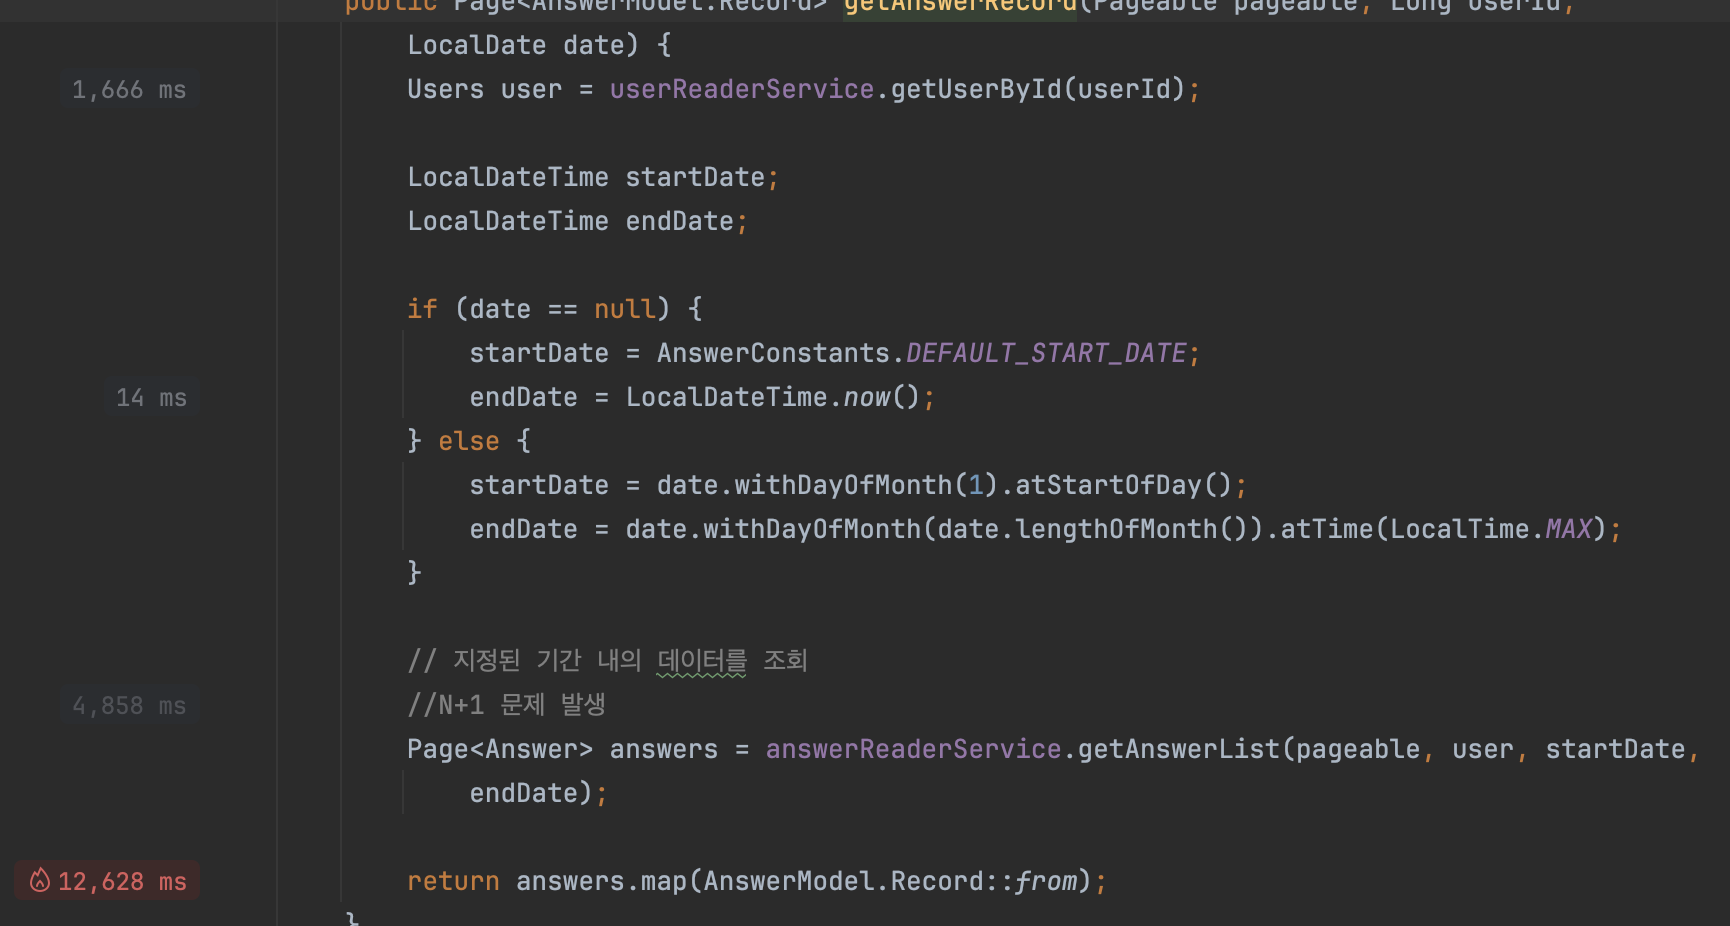
record를 매핑부분에서 상당한 리소스 사용중
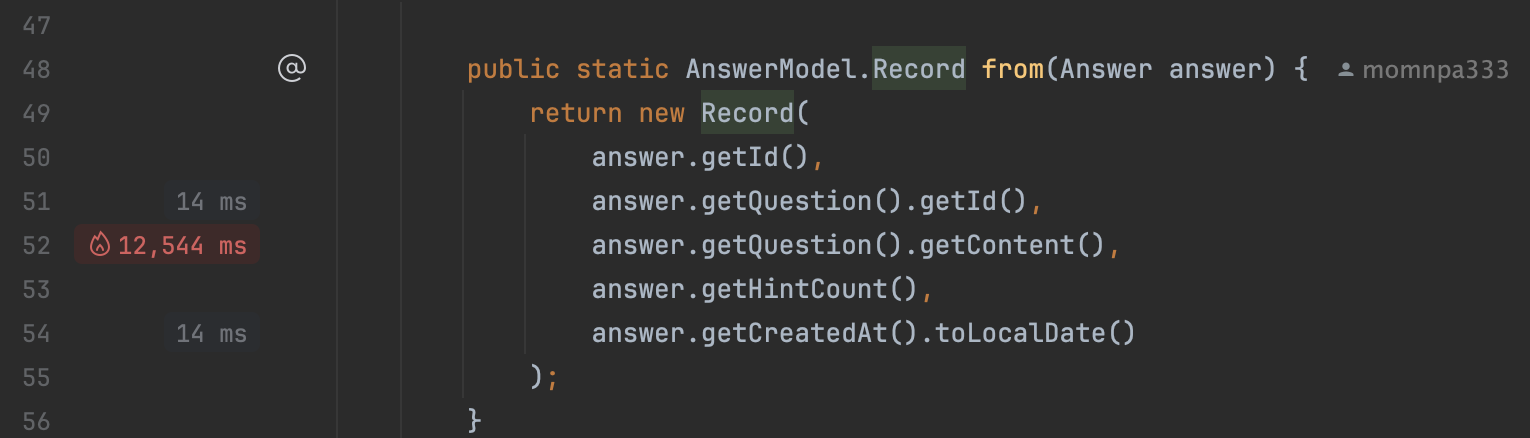
아... N+1문제가 터지고 있었다..
그동안 api 호출 한번당 answer 10개 불러오기 (1) + 각 answer 당 question.content 불러오기(1*10) = 11번의 db 호출이 있었다.
쿼리를 개선해도 결국 db 호출의 빈도수가 성능의 대부분을 차지하기 때문에 tps 개선이 크게 이루어 지지 않았다.
 //    @EntityGraph(attributePaths = {"picked"})
//    @Query("SELECT p FROM Answer p WHERE p.picked = :user AND p.createdAt BETWEEN :startDate AND :endDate ORDER BY p.createdAt DESC")
//    Page<Answer> findAllByPickedAndCreatedAtBetween(Pageable pageable, @Param("user") Users user,
//        @Param("startDate") LocalDateTime startDate, @Param("endDate") LocalDateTime endDate);

    @Query("SELECT a FROM Answer a JOIN FETCH a.question q WHERE a.picked = :user AND a.createdAt BETWEEN :startDate AND :endDate ORDER BY a.createdAt DESC")
    Page<Answer> findAllByPickedAndCreatedAtBetween(Pageable pageable, @Param("user") Users user,
        @Param("startDate") LocalDateTime startDate, @Param("endDate") LocalDateTime endDate);
fetch join을 통해 question도 함께 불러오자
실행계획을 확인해보면
EXPLAIN ANALYZE
SELECT *
FROM answer a
JOIN question q ON a.question_id = q.id
WHERE a.picked_id = 1000001
AND a.created_at BETWEEN '2025-03-01 00:00:00' AND '2025-03-19 23:59:59'
ORDER BY a.created_at DESC;-> Nested loop inner join (cost=27.2 rows=12) (actual time=0.136..0.165 rows=12 loops=1)
-> Index range scan on a using idx_answer_picked_created over (picked_id = 1000001 AND '2025-03-19 23:59:59' <= created_at <= '2025-03-01 00:00:00'), with index condition: ((a.picked_id = 1000001) and (a.created_at between '2025-03-01 00:00:00' and '2025-03-19 23:59:59')) (cost=14 rows=12) (actual time=0.108..0.114 rows=12 loops=1)
-> Single-row index lookup on q using PRIMARY (id=a.question_id) (cost=1.01 rows=1) (actual time=0.00373..0.00377 rows=1 loops=12)NL조인을 사용하여 불러오는 모습
이제 11번의 호출에서 1번의 호출로 변경
성능테스트 진행
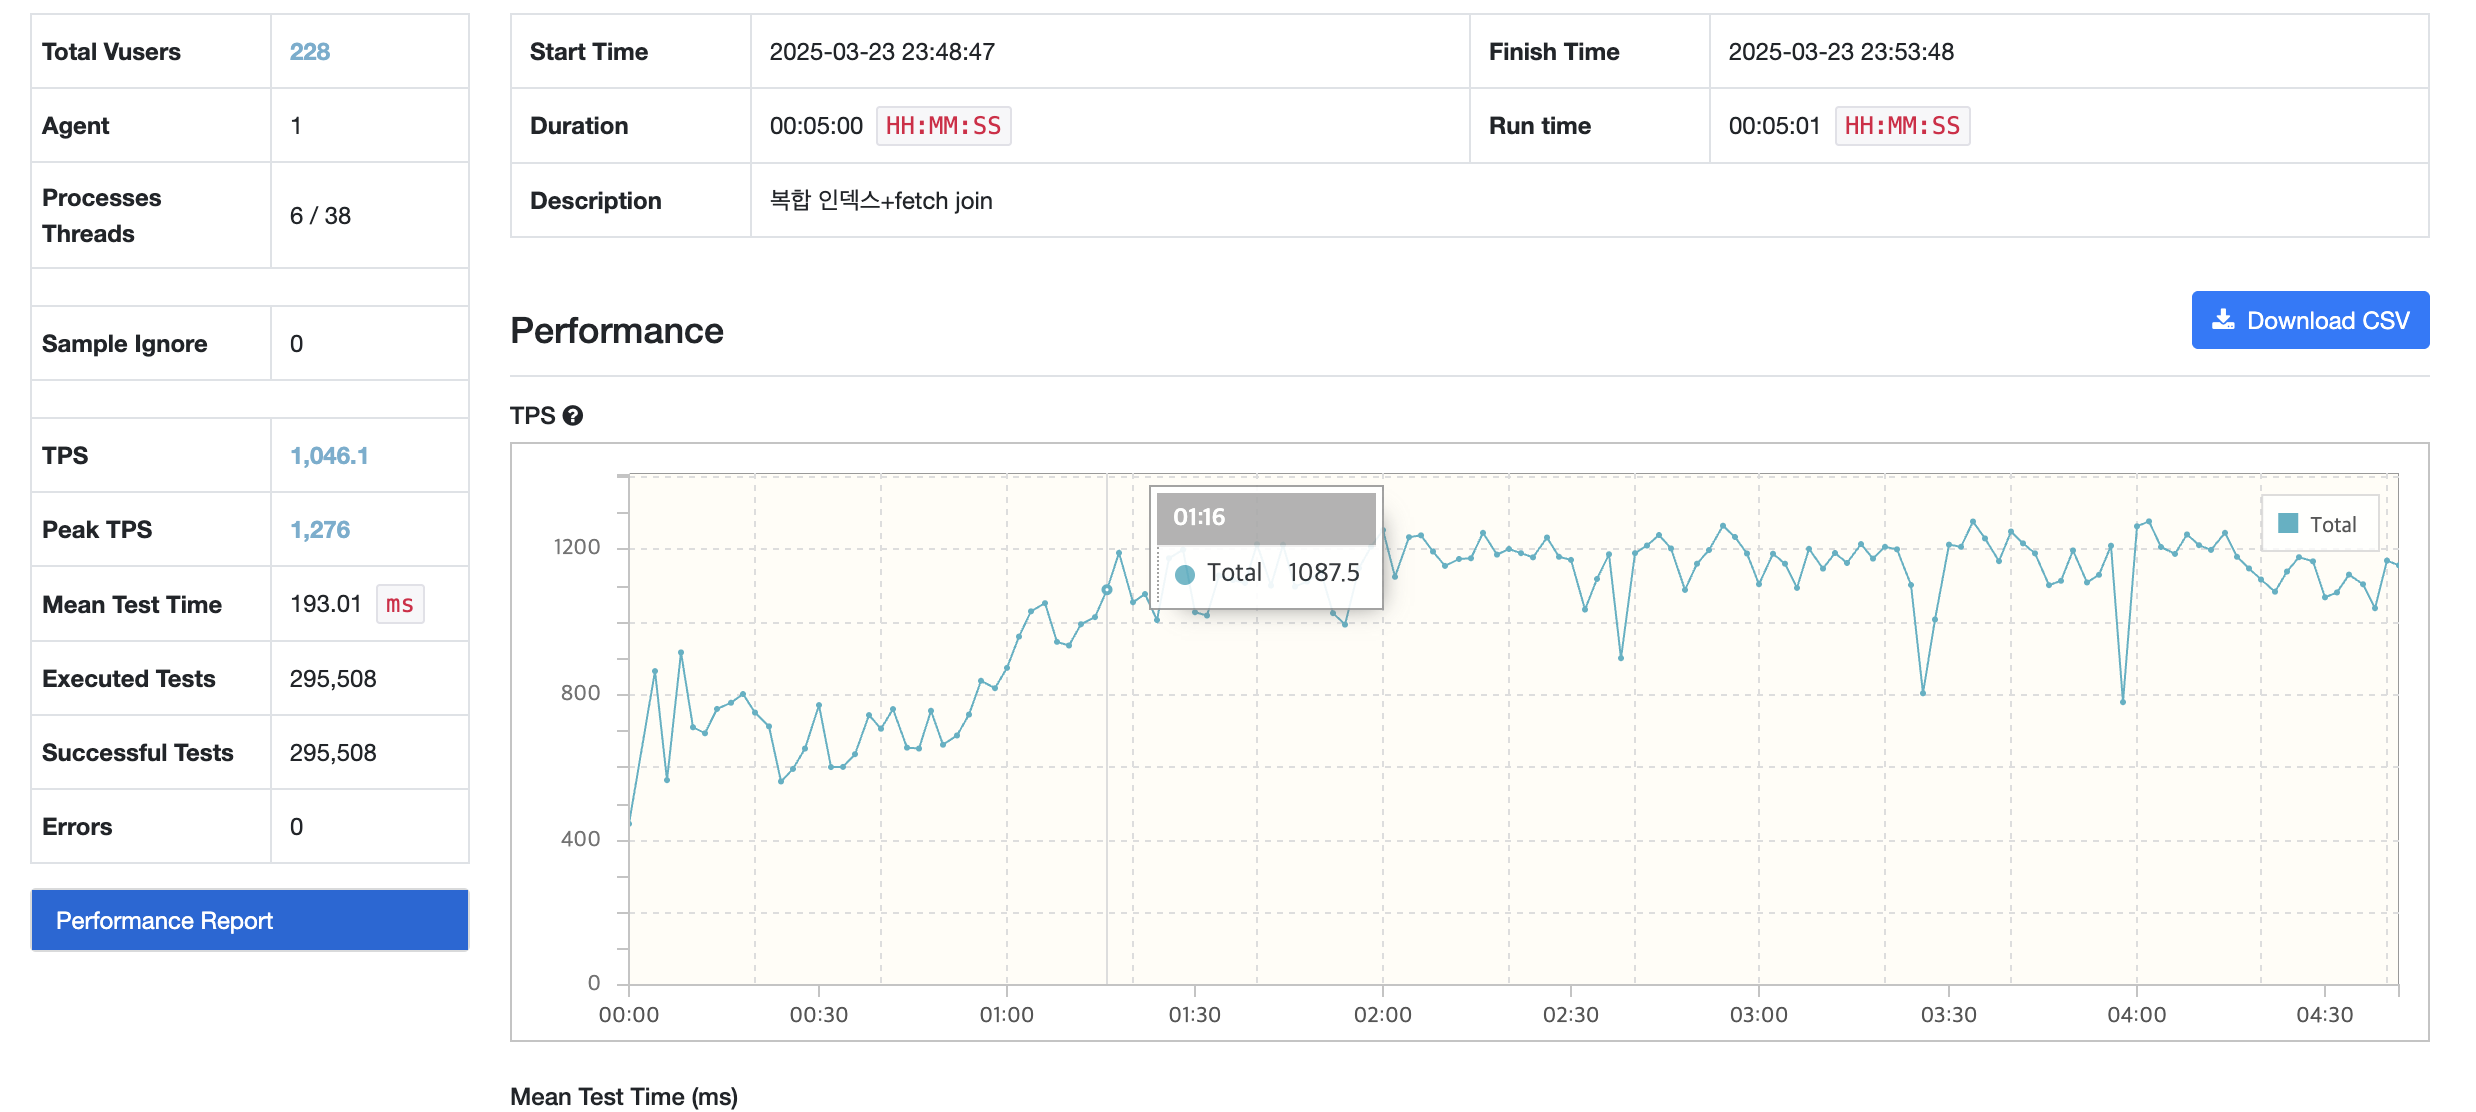
평균 tps가 1046.1, mtt가 간당간당하게 193 으로 목표했던 성능으로 올라가게 되었다.
결론
크게 두가지 문제가 있었다. vuser 수 증가에 따라 tps 하락의 경우 정확한 원인을 찾지 못함. CP를 늘렸을 때 tps하락을 막을 수 있긴 했는데 좀 더 연구 필요하다. 이후에는 tps 늘리기 위해 성능 개선을 진행해 보았다.
처음에는 쿼리 개선을 하며 복합인덱스 처리를 했으나 쿼리자체는 빨라졌으나 크게 서버 처리량 자체는 크게 개선되지 못했음. 로직자체에 문제가 있다고 판단하고, 프로파일러를 통해 병목이 일어나는 곳 탐색-> 예상치 못한 N+1문제 발견-> fetch join으로 N+1문제 해결하였다.
쿼리 개선하기 전에 로직을 천천히 다시 봤다면 시간을 많이 아낄수 있었을 것 같은데 아쉬웠다.
다음 성능개선을 하게 된다면
1. 로직 확인
2. 쿼리 개선
3. 메모리, cpu, gc 확인하는 절차로 해야겠다.