학습목표
Confusion matrix를 만들고 해석할 수 있음정밀도,재현율을 이해하고 사용할 수 있음ROC curve,AUC 점수를 이해하고 사용할 수 있음 +임계값
Confusion matrix

( * 뒤에 거 먼저 해석!)
-
TP
: Actual positive를positive라고 제대로 예측했으니True -
FN
: Actual positive를negative라고 잘못 예측했으니False -
FP
: Actual negative를positive라고 잘못 예측해서False -
TN
: Actual negative를negative라고 제대로 예측해서True
# Confusion matrix 그래프 그리기
from sklearn.metrics import plot_confusion_matrix
import matplotlib.pyplot as plt

fig, ax = plt.subplots()
pcm = plot_confusion_matrix(pipe, X_val, y_val,
                            cmap=plt.cm.Blues,
                            ax=ax);
plt.title(f'Confusion matrix, n = {len(y_val)}', fontsize=15)
plt.show()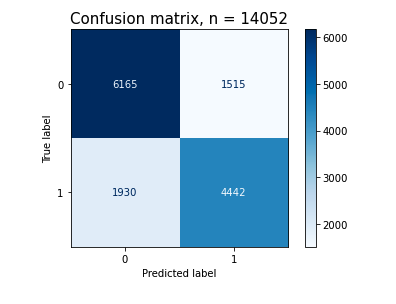
# plot_confusion_matrix 에서 테이블 데이터 가져오기
cm = pcm.confusion_matrix
cm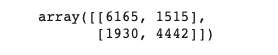
# TP (True Positive)
cm[1][1]
-> TP = 4442
-> FN = 1930
-> TN = 6165
-> FP = 1515
분류 모델 평가지표
-
정확도(Accuracy)
: 전체 범주를 모두 바르게 맞춘 경우를 전체 수로 나눈 값=>
-
정밀도(Precision)
: Positive로 예측한 경우 중 올바르게 Positive를 맞춘 비율=>
-
재현율(Recall, Sensitivity)
: 실제 Positive인 것 중 올바르게 Positive를 맞춘 것의 비율=>
-
F1 score
: 정밀도와 재현율의 조화평균(harmonic mean)=>
# classification_report
from sklearn.metrics import classification_report
print(classification_report(y_val, y_pred))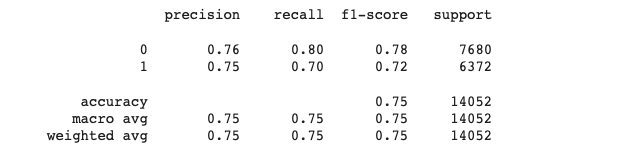
-
: A more general F score, , that uses a positive real factor β,
where β is chosen such that recall is considered β times as important as precision.=>
f_beta = (1 + (beta**2)) * ((precision*recall) / (((beta**2)*precision) + recall))다루는 문제에 따라 정밀도와 재현율 중 어느 평가지표를 우선시해야 하는가?
-> 어떤 오류가 더 치명적일지부터 먼저 생각해 봐야 함
-
병원에서 초기 암진단을 하는 경우
=>
재현율(recall): 암인데 암이 아니라고 잘못 예측한 경우인 2종 오류(FN)이 더 치명적이기 때문
-
넷플릭스에서 영화 추천을 해주는 경우
=>
정밀도(precision)-
FN: 좋아하는 장르인데 안 좋아하는 장르라고 잘못 예측해서 추천 X
-
FP: 안 좋아하는 장르인데 좋아하는 장르라고 예측해서 추천함
-> FP가 많으면 신뢰도가 낮아짐. 그래서 FP를 줄이기 위해 정밀도가 더 중요
-
임계값(thresholds)
ROC curve
: Receiver Operating Characteristic
AUC
: Area Under the Curve
=> ROC curve의 아래 면적
_%20Photo.jpeg)