오늘의 학습 리스트
LMS
-
Data Visualisation
-
plt.subplots()로 ax를 여러 개 만들고 그냥plt.xlabel()하면 어떻게 될까...?
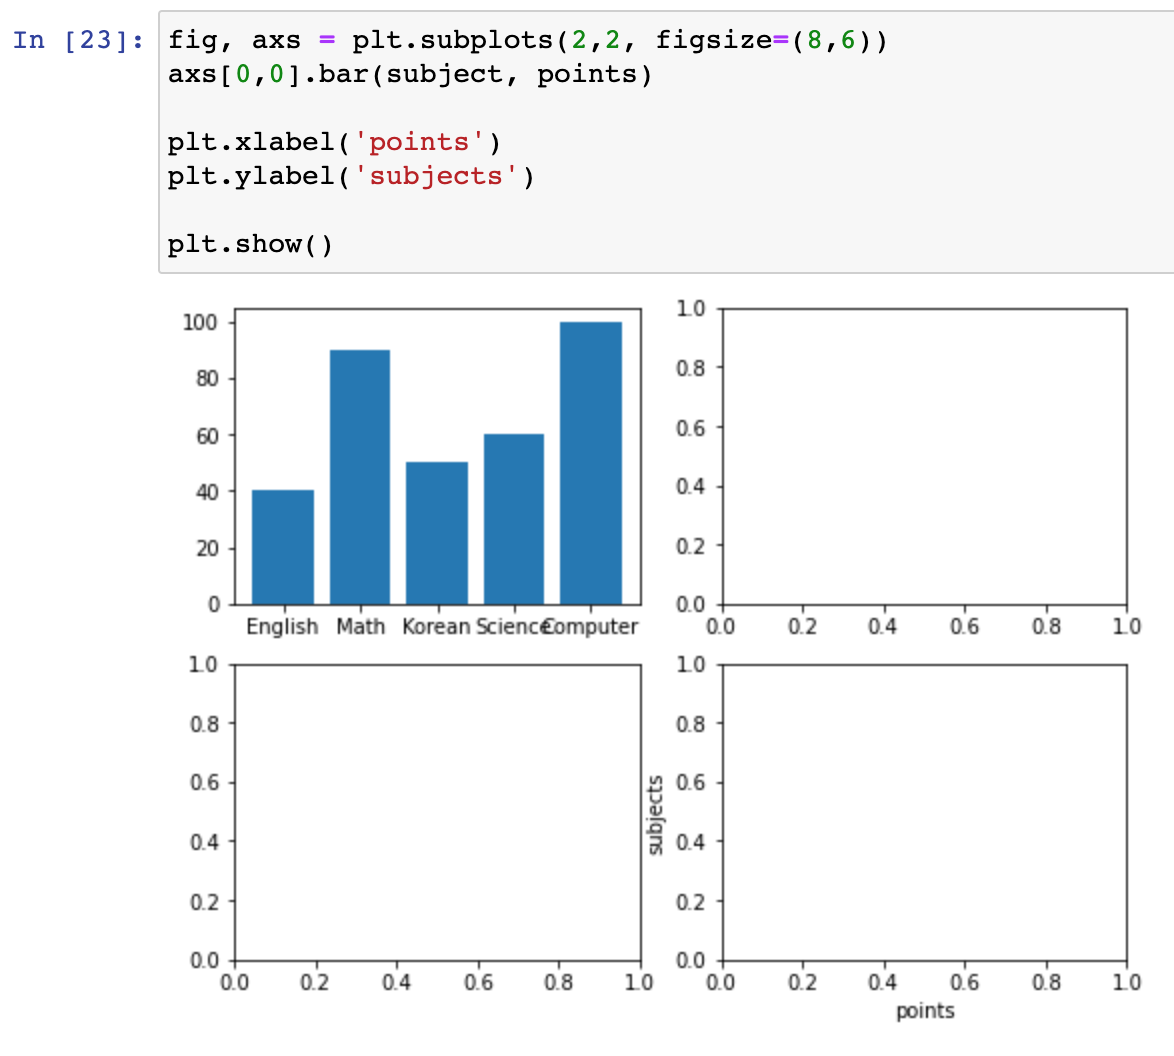
-> 했더니 제일 마지막 ax에 붙는다. -
배운 개념 1)
: Pandas의 plot을 사용하면서, matplotlib에서 정의한 subplot 공간 ax를 사용할 수 있다. -
plt.plot(): fig 생성, ax 생성을 거치지 않고 바로 plot을 만들게 해준다.
: 그러면 가장 최근의 figure 객체와 그 subplot에 그린다.
: 만약 subplot이 없으면 하나 생성 -
그래프 그리는 과정 정리!
1) fig(도화지) 생성 -
fig = plt.figure()
2) ax(축) 생성 -ax = fig.add_subplot(default=(1,1,1))
3) ax에 그래프 메소드 사용 -ax.bar(x, y)
4)plt.xlabel(),plt.title()등으로 요소 넣어주기
5)plt.savefig()으로 이미지 저장*근데 보통 fig, ax 를
plt.subplots()를 통해동시에 만드는 것 같다.
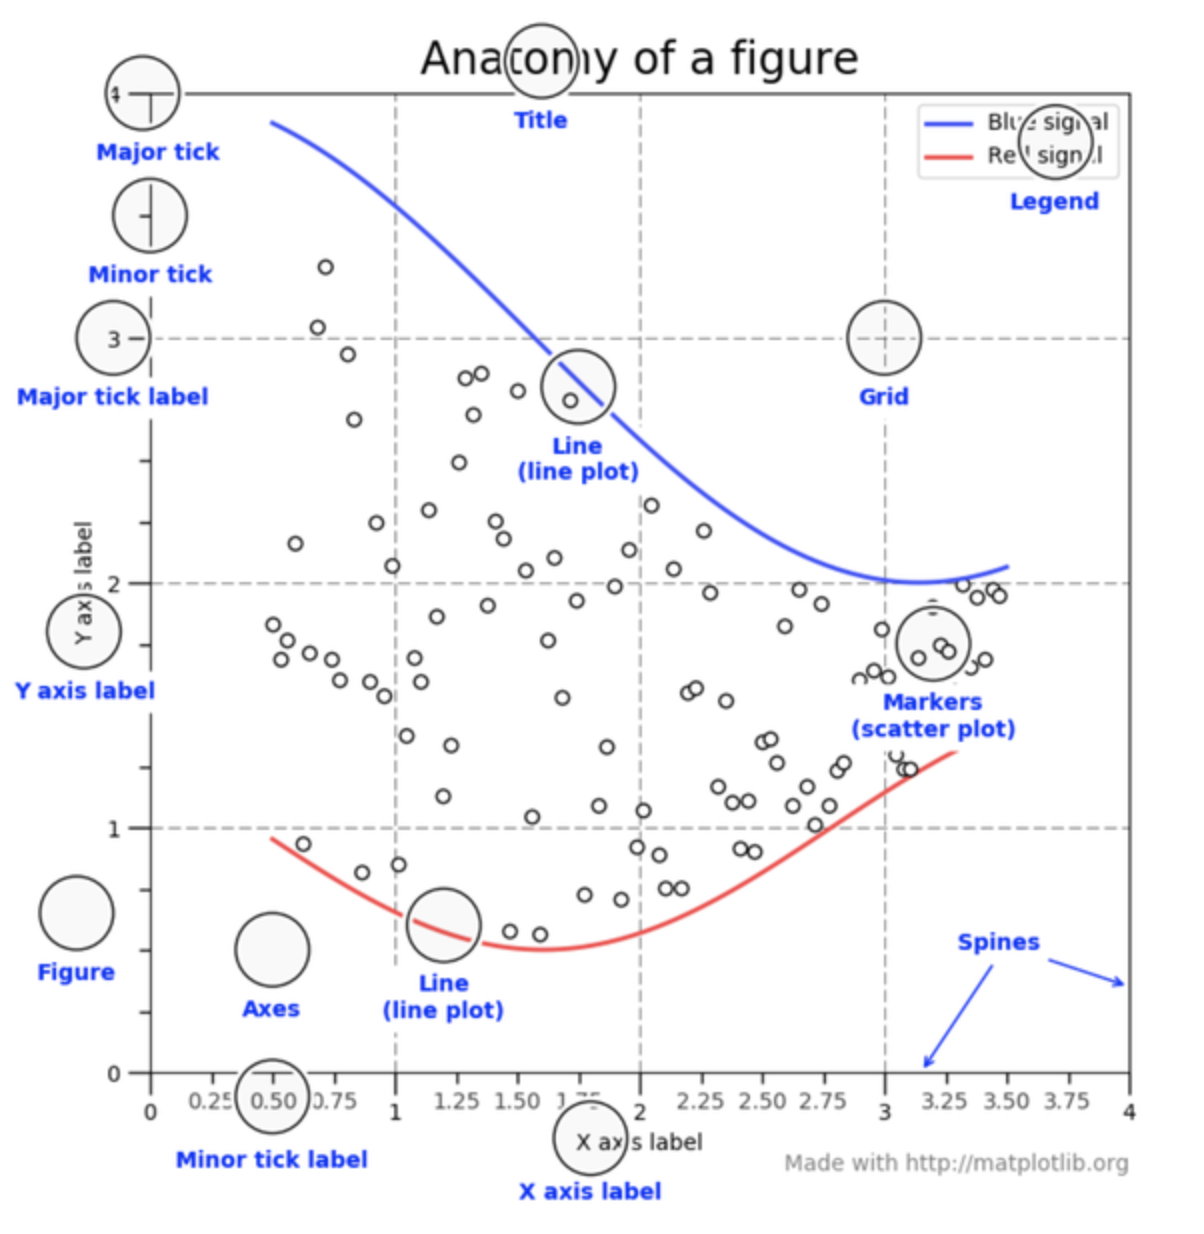 (이미지 출처 : AIFFEL 노드 11)
- 데이터 종류별 사용 그래프(각각 matplotlib, seaborn에서 어떤 함수명인지 써 봄)
- matplotlib.pyplot과 seaborn은 넣어주는 argument에 차이가 좀 있다(대체로 seaborn이 전처리 없이 넣어줘도 되는 것 같아 더 편한 것 같다)
- 범주형
- bar
plt.bar(),sns.barplot()
- violin
plt.violinplot(),sns.violinplot()
- cat
sns.catplot()(plt 없음)
- bar
- 수치형
- scatter
plt.scatter(),sns.scatterplot()
- line
plt.plot(),sns.lineplot()
- histogram
plt.hist(),sns.histplot()- 가로축 : 계급, 변수의 구간, bin (or bucket)
- 세로축 : 도수, 빈도수, frequency
- scatter
- heatmap
sns.heatmap()
: 차원이 정해진 건 없지만, 데이터를 2차원으로 시각화함
: 그래서 pd.DataFrame을 가끔 pivot 해줘야 할 경우 있음
-> 예)df.pivot(index='', columns='', values='')
풀잎스쿨
- 연산자(상옥님 특강...ㅋㅋ)
- 비교 연산자
- 논리 연산자(이들 가운데도 우선순위가 있다)
- 증감 연산자(python에는 없어서 흥분하신...) -> 나~~~아중에 알아도 됨
- 클래스 상속
- 만드는 법:
1) class 기반클래스명:
2) class 상속클래스명(기반클래스명): - 확인 하는 코드
issubclass(섭클래스명, 상위클래스명) >>> True 반환하는함수 쓰기 - 동등관계, 포함관계 헷갈린다...
-> 찾아 보니,- 동등관계(is a 관계) : '한 클래스는 다른 클래스이다'(자식 클래스는 부모 클래스와 동등관계)
- 포함관계(has a 관계) : 한 클래스 인스턴스를 다른 클래스 인스턴스의 속성 등을 통해 그 다른 클래스의 인스턴스 내에 넣을 경우
- 상위 클래스의
__init__을 사용하려면super().__init__()을 자식 클래스 함수 정의 때 넣어줘서 호출하기
- 만드는 법:
class Person:
    def __init__(self): # 상위클래스의 초기화 함수 정의
        print('Person __init__')
        self.hello = '안녕하세요.'

class Student(Person):
    def __init__(self):        # 하위 클래스의 초기화 함수 정의. 이 때 아마 override 되는 듯
        print('Student __init__')
        super().__init__()       # super()로 기반 클래스의 __init__ 메서드 호출
        self.school = '파이썬 코딩 도장'

james = Student()
print(james.school)
print(james.hello)

>>>
Student __init__
Person __init__
파이썬 코딩 도장
안녕하세요.
- 하위클래스에
__init__함수가 없다면 상위클래스__init__을 자동으로 호출해서 attribute error 안 남
class Person:
    def __init__(self):
        print('Person __init__')
        self.hello = '안녕하세요.'

class Student(Person):
    pass # 하위클래스에는 그냥 아무 것도 없지만

james = Student() # 여기서 상위클래스 __init__ 호출
print(james.hello)- 클래스 상속 및
super()에 대한 나의 실험
class Person:
    def __init__(self):
        print("Person __init__ called")
        self.hello = 'Person Hi'

class Student(Person):
    def __init__(self):
        super().__init__()
        print("Student __init__ called")
        self.study = 'Student study'
        self.clean = 'Student clean'

class UniversityStudent(Student):
    def __init__(self):
        super().__init__()
        print('Uni student __init__ called')
        self.dissertation = 'Uni student dissertation'
        self.clean = 'Uni student clean'

DJ = UniversityStudent()
print('uni att:', DJ.clean)
print('person att:', DJ.hello)
print('student att:',DJ.study)

>>>
Person __init__ called
Student __init__ called
Uni student __init__ called
uni att: Uni student clean
person att: Person Hi
student att: Student studysuper()의 기능super(derived class, self).baseclass의method명- 예) Uni student 클래스(손자) 정의에서
super(Student, self).__init__를 넣으면 Student 클래스(부모)의 상위인 Person(조부모) 클래스의__init__만 호출
- 다이아몬드 상속 등으로 method resolution order를 알고 싶으면
:클래스명.mro()
:>>> [<class '__main__.D'>, <class '__main__.B'>, <class '__main__.C'>, <class '__main__.A'>, <class 'object'>]같은 식으로 순서가 뜸 object는 모든 클래스의 조상...
: 따라서class 클래스명:할 때 사실class 클래스명(object):로 보면 됨
더 공부할 것
- 추상클래스(abstract classs)의 개념 및 사례
-> 공부한 것(22.Jan.05)
1) 추상클래스는 인스턴스를 못 만듦(에러 남)
2) 쓰는 목적은 상위클래스로 상속만 하려고
3) 뭘 상속하냐면 추상 메소드들
4) 하위 클래스에서 추상 메소드로 정의된 걸 자신의 클래스에서 정의 안 하면 에러 남
5) 추상메소드 정의할 때는@로
오늘의 코드
: 모든 건 다 이유가 있다...
# df['tip']을 df['sex'] 기준으로 나타내고 싶음
# (1)matplotlib + pandas를 이용한 복잡한 방법
# plt.bar()로 그냥 한 번 해봄(어케 나오나...)

plt.bar(x=df['sex'], height=df['tip'])
>>> 이러면 평균이 'sex'별 평균이 아니었음

# groupby로 평균을 구해줘서 해봄
grouped = df['tip'].groupby(df['sex'])
sex = dict(grouped.mean())
x = list(sex.keys())
y = list(sex.values())
plt.bar(x=x, height=y)
>>> 이러면 평균으로 잘 나옴

# 왜 그런가 봤더니
# plt.bar(x=df['sex'], height=df['tip']) 이렇게 그냥 하면 결국
# grouped.max()를 갖고 그래프를 그림

# 근데 seaborn은
sns.barplot(data=df, x='sex', y='tip')
>>> 이렇게 하니까 'sex'별 평균이었음
>>> 그럼 왜 그럴까 찾아보니
>>> 원래부터 sns.barplot의 리턴값은 아래의 설명임
>>> Show point estimates and confidence intervals as rectangular bars.
'어떻게든 자야겠어'라는 저 아이를 닮고 싶습니다