오늘의 학습 리스트
LMS
-
회귀(Regression)
- 독립변수(설명변수)와 종속변수(반응변수) 간의 관계성을 규명하고 싶은데,
- 그 관계에 의해 결국 독립변수에 해당되는 종속변수가 평균으로 '회귀'한다는 관점에서 regression으로 불리기 시작
- 포인트는 어떤 데이터가 있을 때 '이 변수들 간의 관계가 회귀적인 모델에 있을 것 같다'라는 예상 속에 그에 맞는 모델을 찾아보는 것.
- 근데 이것이 '직선 형태의 모델에 있을 것 같다'라는 게 Linear Regression
- 선형 회귀에서도 변수가 하나면 '단순 선형 회귀'
- 변수가 2개 이상이면 '다중 선형 회귀'라고 지칭함
-
선형 회귀분석의 4가지 기본 가정
-
선형성(Linearity)
- 만약 변수들 중 선형성을 가지지 않은 게 있으면, 로그, 지수, 루트 등 변수 변환을 취해보거나
- 새로운 변수를 추가해보거나
- 선형성을 만족하지 않는 변수를 아예 제거해볼 수도 있다.
- 다중공선성(Multicollinearity)
- 만약 변수들 간 상관관계가 높은 것들이 있다면 이들을 합쳐서 새로운 변수를 만들거나(그러면 기존 변수는 제거하는 거겠죠...?)
-
잔차(Residuals)
- 회귀 모델을 통해 예측한 값과 실제 값의 차이
- 최소 제곱법(Loss function으로 보면 될 듯)
-
데이터셋에서 feature당 선형회귀 모델 생성으로 각 feature당 특징 파악하는 예제 코드
for i in range(data.shape[1]): # boston dataset에서 i번째 attribute(column)을 살펴볼 거에요.

    single_attr, attr_name = data[:, i].reshape(-1, 1), boston['feature_names'][i] # i번째 attribute에 대한 data 및 이름
    estimator = LinearRegression() # 선형 회귀 모델이에요.

    #x에는 single_attr, y에는 price에 해당하는 데이터를 대입해서 최소제곱법을 이용하여 모델 내에서 W, b를 구하는 과정이에요
    estimator.fit(single_attr, price)

    #위 fit() 과정을 통해 구한 회귀계수를 기반으로 회귀모델에 X값을 대입했을 때의 예측 Y 값이에요.
    pred_price = estimator.predict(single_attr)

    score = metrics.r2_score(price, pred_price) # 결정계수를 구하는 함수에요.

    # 캔버스 생성
    ax = fig.add_subplot(7, 2, i+1)
    ax.scatter(single_attr, price) # 실제 데이터에 대한 산포도
    ax.plot(single_attr, pred_price, color='red') # 선형회귀모델의 추세선
    ax.set_title("{} x price, R2 score={:.3f}".format(attr_name ,score)) #subplot의 제목이에요
    ax.set_xlabel(attr_name) # x축
ax.set_ylabel('price') # y축-
Logistic Regression
-
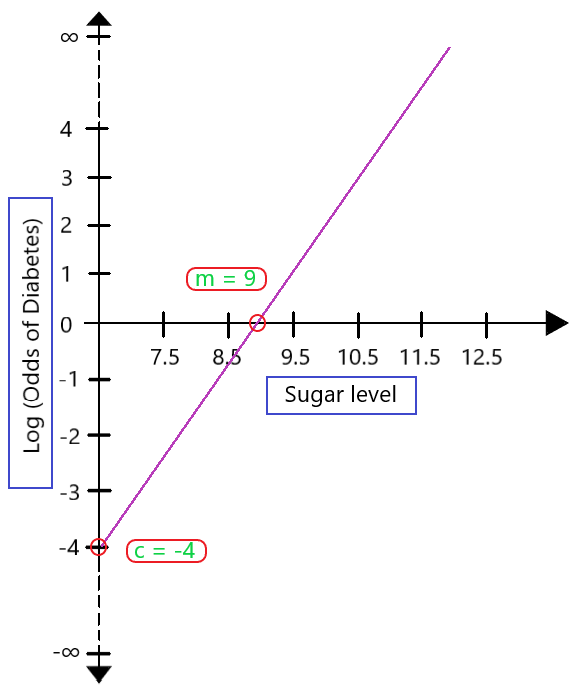
Log-odds
- odds라는 것이 있다.
- 특정 사건의 확류 p 를 그 반대 사건의 확률 (1-p)로 나눈 것
- 근데 이 값은 특징상 0 ~ infinity 까지 간다.
- 근데 이 값에 log를 취하면 log-odds다.
- 왜 log를 취하냐면,
- 이렇게 함으로써 range를 -inifity ~inifity로 만들게 된다.
- 이는 logistic regression이라는 큰 그림에서 볼 때 0~1 사이의 확률 값의 범위를 엄청 넓히게 된다.
- 그리고 이런 로그 변환은 해석하기 쉽기 때문이란다.
- 아마도 이렇게 로그 변환을 하게 되면 식이 linear regression의 방정식 형태와 유사해지기 때문인 듯하다.
- 이 블로그 및 사진 좋은 듯 하다.
- https://www.geeksforgeeks.org/role-of-log-odds-in-logistic-regression/

- 근데 사실 logistic regression에서 우리가 알고 싶은 건 log-odss는 아님
- 그래서 우리는 다시 이 값을 sigmoid function에 넣어서 0~1 사이의 값으로 만들고,
- sigmoid function은 binary classification에 최적화 되게 특정 소량 면적을 제외하고는 0과 1의 경계가 분명하기 때문에 이렇게 classification의 마지막 함수로서 효율이 좋다.
- odds라는 것이 있다.
-
결국 Logistic Regression의 중요한 의미는
: 분류 문제를 연속적인 변수인 확률적으로 접근한다는 것! -
Softmax
- logistic regression에서 sigmoid를 이진 분류를 위해 썼다면,
- softmax는 multi class classification 용도로 사용한다.
- 해당 함수는 지수함수 꼴이기 때문에 log-odds 중 큰 값을 더 크게 만들어서 작은 log-odds와의 차이를 더 벌려준다.(클래스별 확률 차이를 더 벌려준다.)
-
Cross-Entropy
- softmax 함수의 손실함수로 사용됨
- 기존에 내가 써놓은 블로그에 내가 이해한 직관적인 의미가 있다.
- 근데 이걸 information theory 측면에서 좀 더 알아봐야겠다...
Deep ML
-
Fully-Connected layer
- 이 뜻이 이제 좀 이해 간다.
- 해당 레이어의 모든 뉴런들이 그 후에 오는 레이어와 연결된 레이어가 Fully-Connected layer이고
- 그게 Dense layer로 표현된다.
-
Backpropagation의 원리
- 여태까지 애매모호하게 알고 있던 듯하다.
- 오늘 알게 된 개념으로 했을 때 머신러닝 알고리즘의 최적화 방법은
- 랜덤으로 가중치 생성
- 순전파
- 손실함수 값 계산 및 역전파 시작
- 역전파 하면서는 local gradient들을 계산
- 그리고 다시 입력층 끝까지 오면 가중치 업데이트 수식(learning rate가 담긴)으로 가중치를 업데이트
- 일단 이렇게 이해했는데, 좀 더 연구해봐야겠다.
-
편미분계수의 의미
- 벡터의 gradient는 해당 벡터의 form을 띄고, 벡터 각각의 요소에 대한 gradient vector의 매칭 요소는 final output에 각각 얼만큼 영향을 줬는지를 의미한다.
-
upstream derivates 가 여러 노드에서 하나로(입력층으로) 온다면 그 들을 그냥 더하면 된다.
- 이유는, 생각해보면 입력층 쪽 노드가 변하면 결과적으로 그다음 여러개 노드 값도 영향을 받고, 그게 final output에도 영향을 준다.
- 즉, 그 입력층 쪽 노드는 여러 쪽에 영향을 주므로, backpropagation 입장에서 봤을 땐 둘 다 더해주는 게 해당 노드의 영향력을 말해줄 수 있다.(라고 cs231n lecture 4 slide 51에서 설명한 듯 하다....)
감사할 거리
cs231n 강의를 들으며 많이 이해됐다고 생각했는데, 생각보다 애매모호하게 짚고 넘어간 부분이 많았다... 그런 부분에 대한 인지가 오늘은 좋았고, LMS에서도 굉장히 쉽게 생각하던 Linear Regression의 심오함(?)에 대해 지경을 넓히게 되었다.(Linear Regression의 assumptions...)
