
Dependency
- cupertino icon, fl_chart, bubble_tab_indicator 종속성 추가
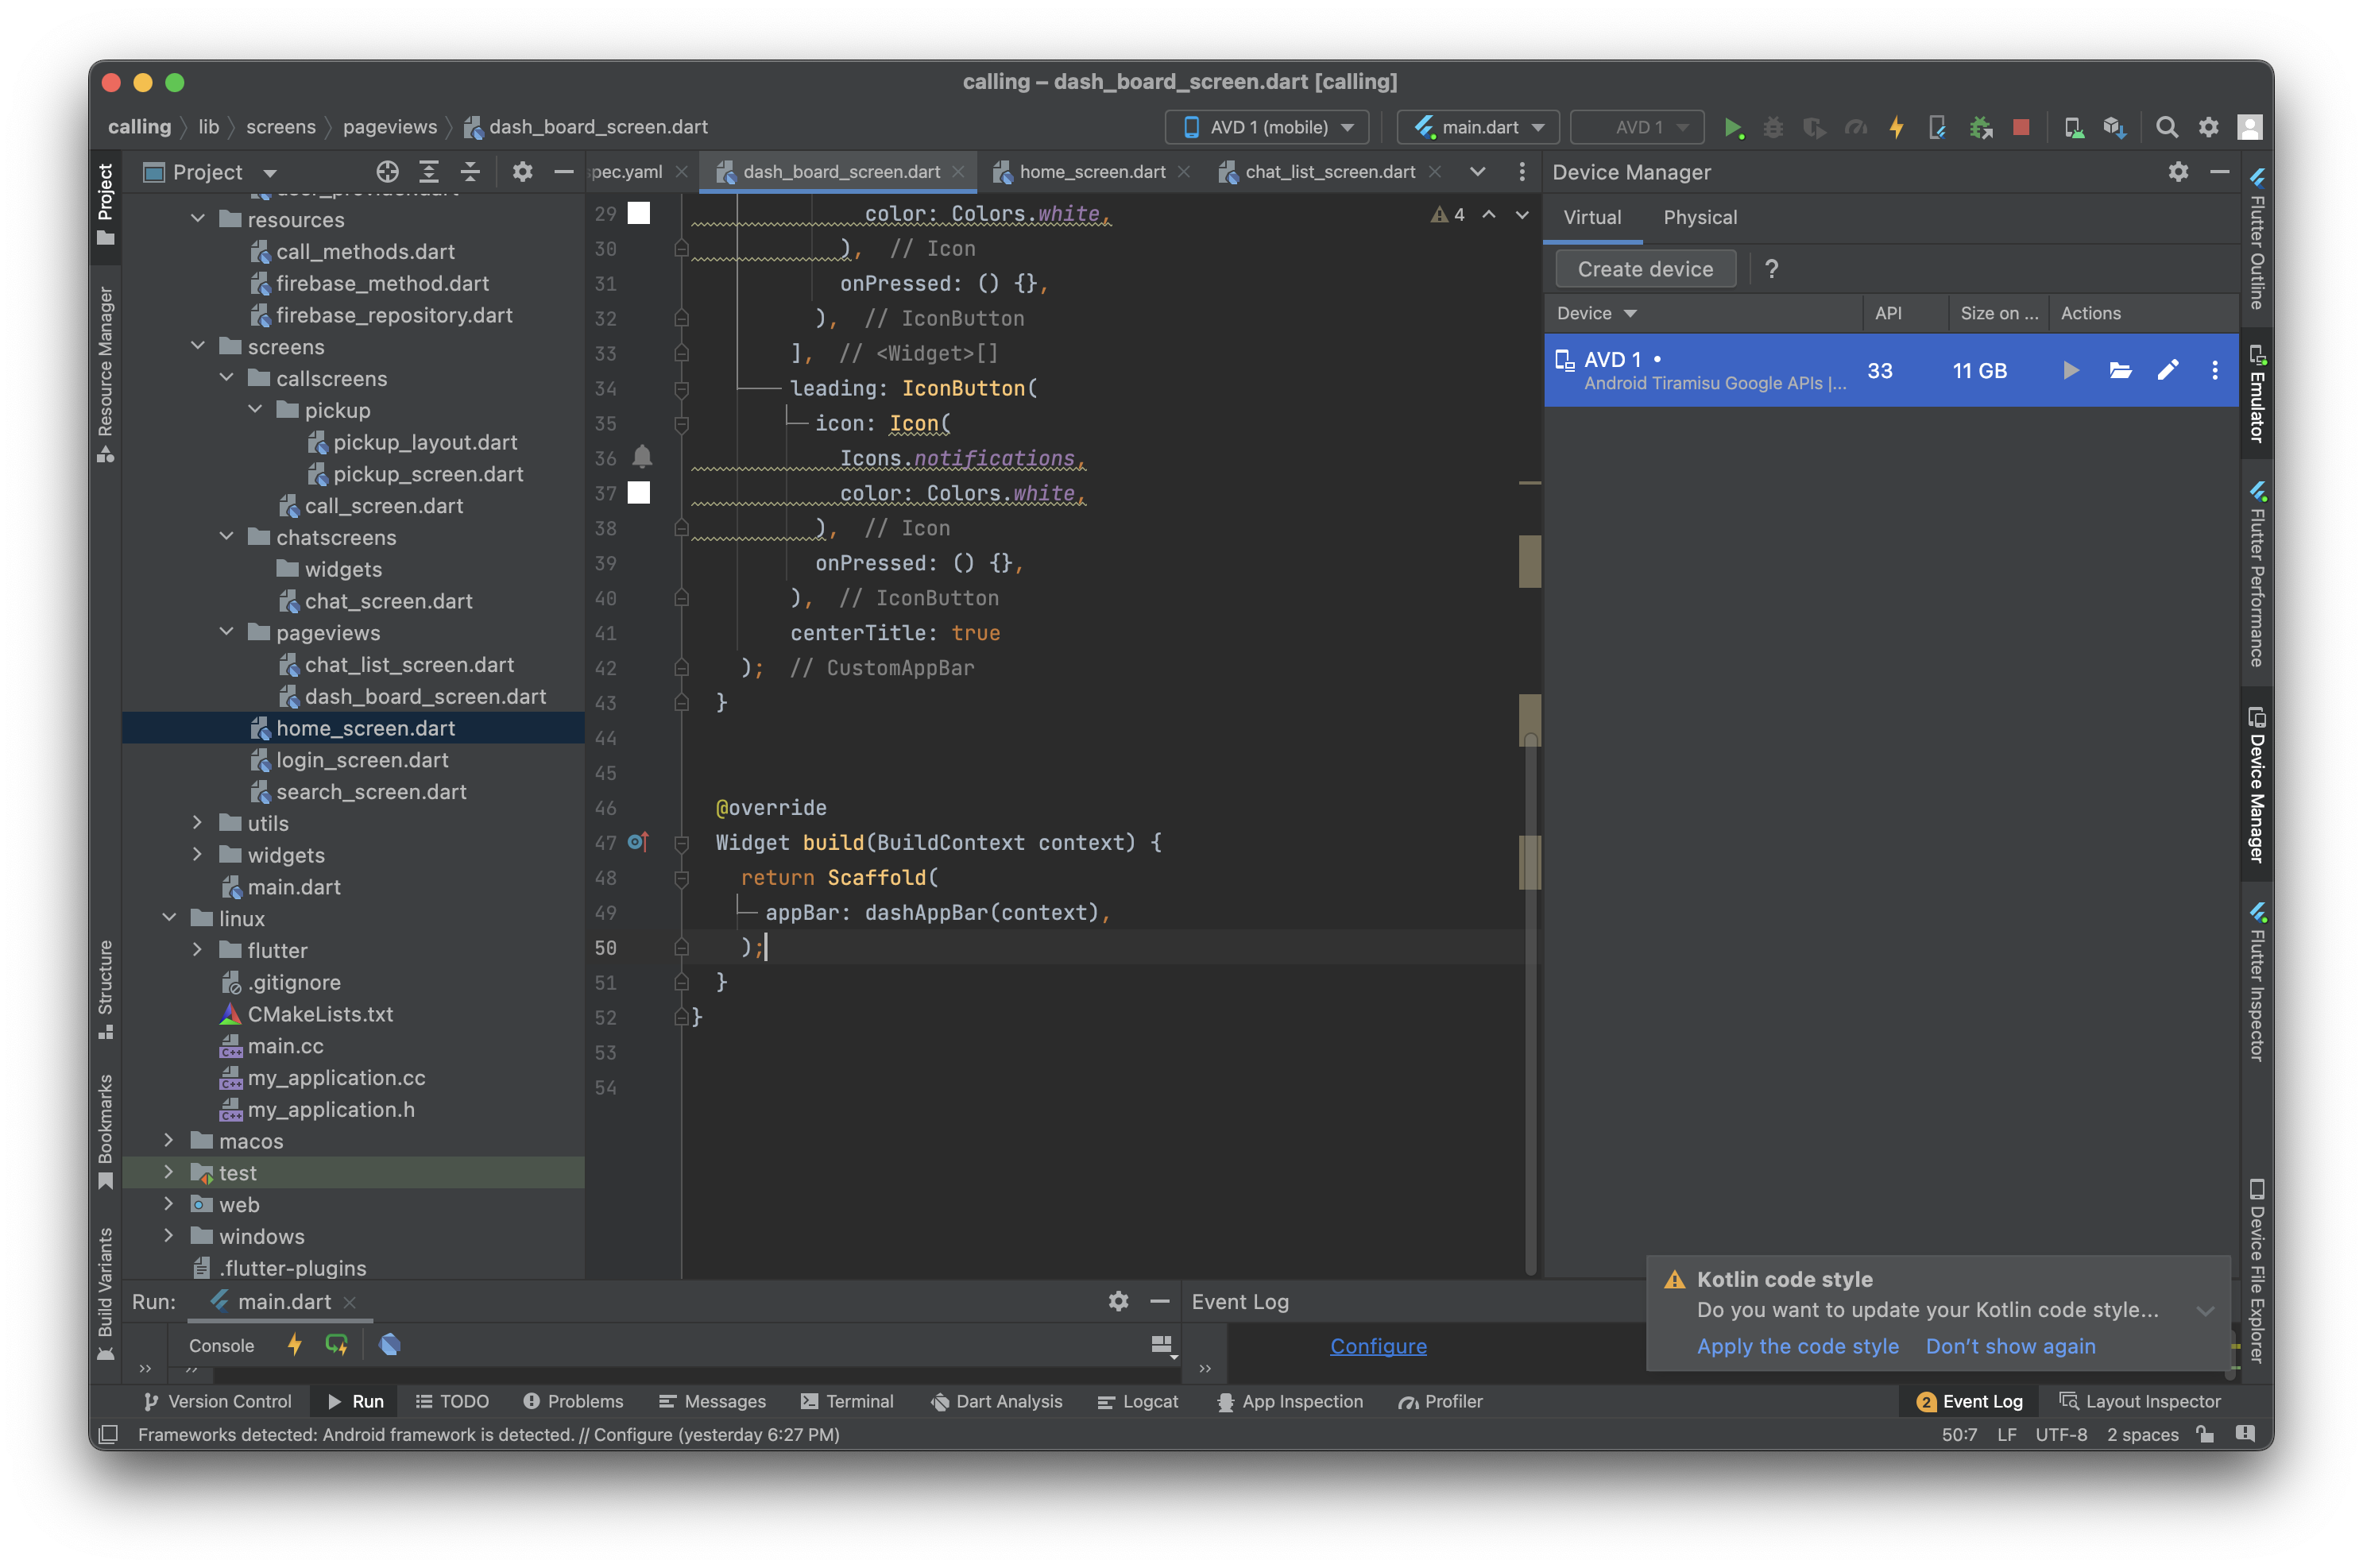
dashAppBar
-
CustomAppbar Widget을 이용해서 DashBoard 페이지의 앱 바 구현
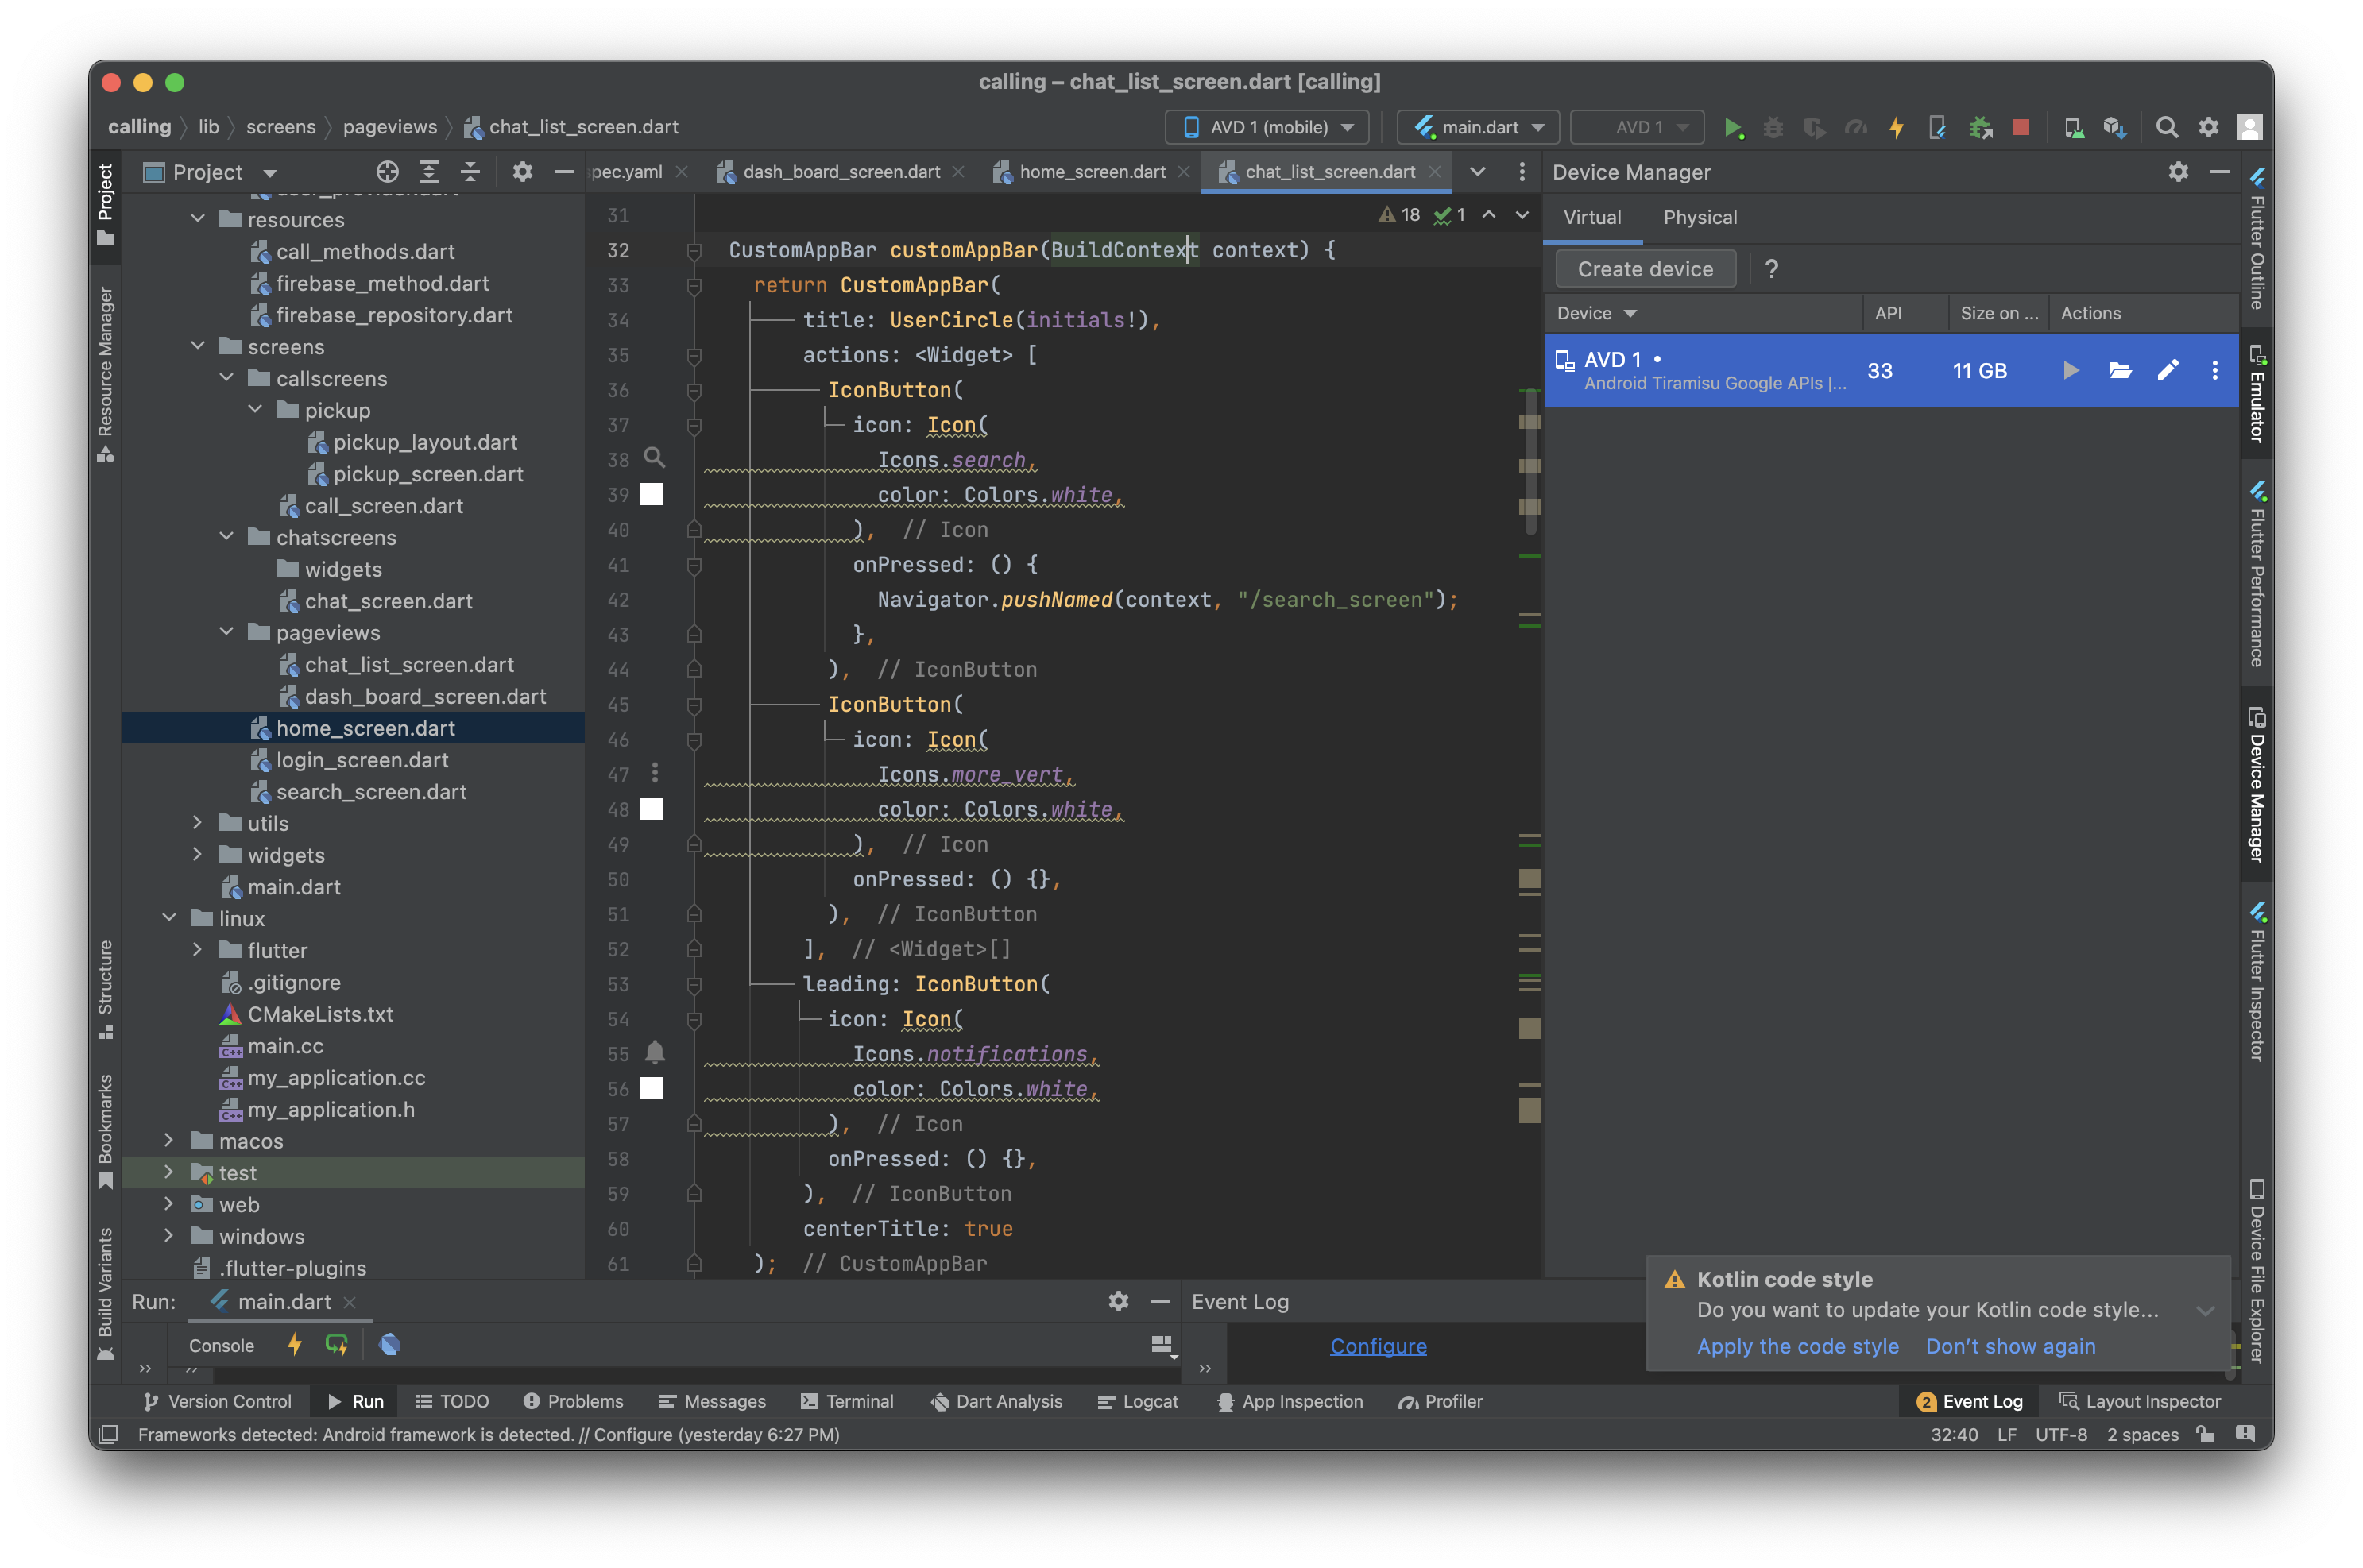
CustomAppBar customAppBar(BuildContext context) { return CustomAppBar( title: UserCircle(initials!), actions: <Widget> [ IconButton( icon: Icon( Icons.search, color: Colors.white, ), onPressed: () { Navigator.pushNamed(context, "/search_screen"); }, ), IconButton( icon: Icon( Icons.more_vert, color: Colors.white, ), onPressed: () {}, ), ], leading: IconButton( icon: Icon( Icons.notifications, color: Colors.white, ), onPressed: () {}, ), centerTitle: true ); } -
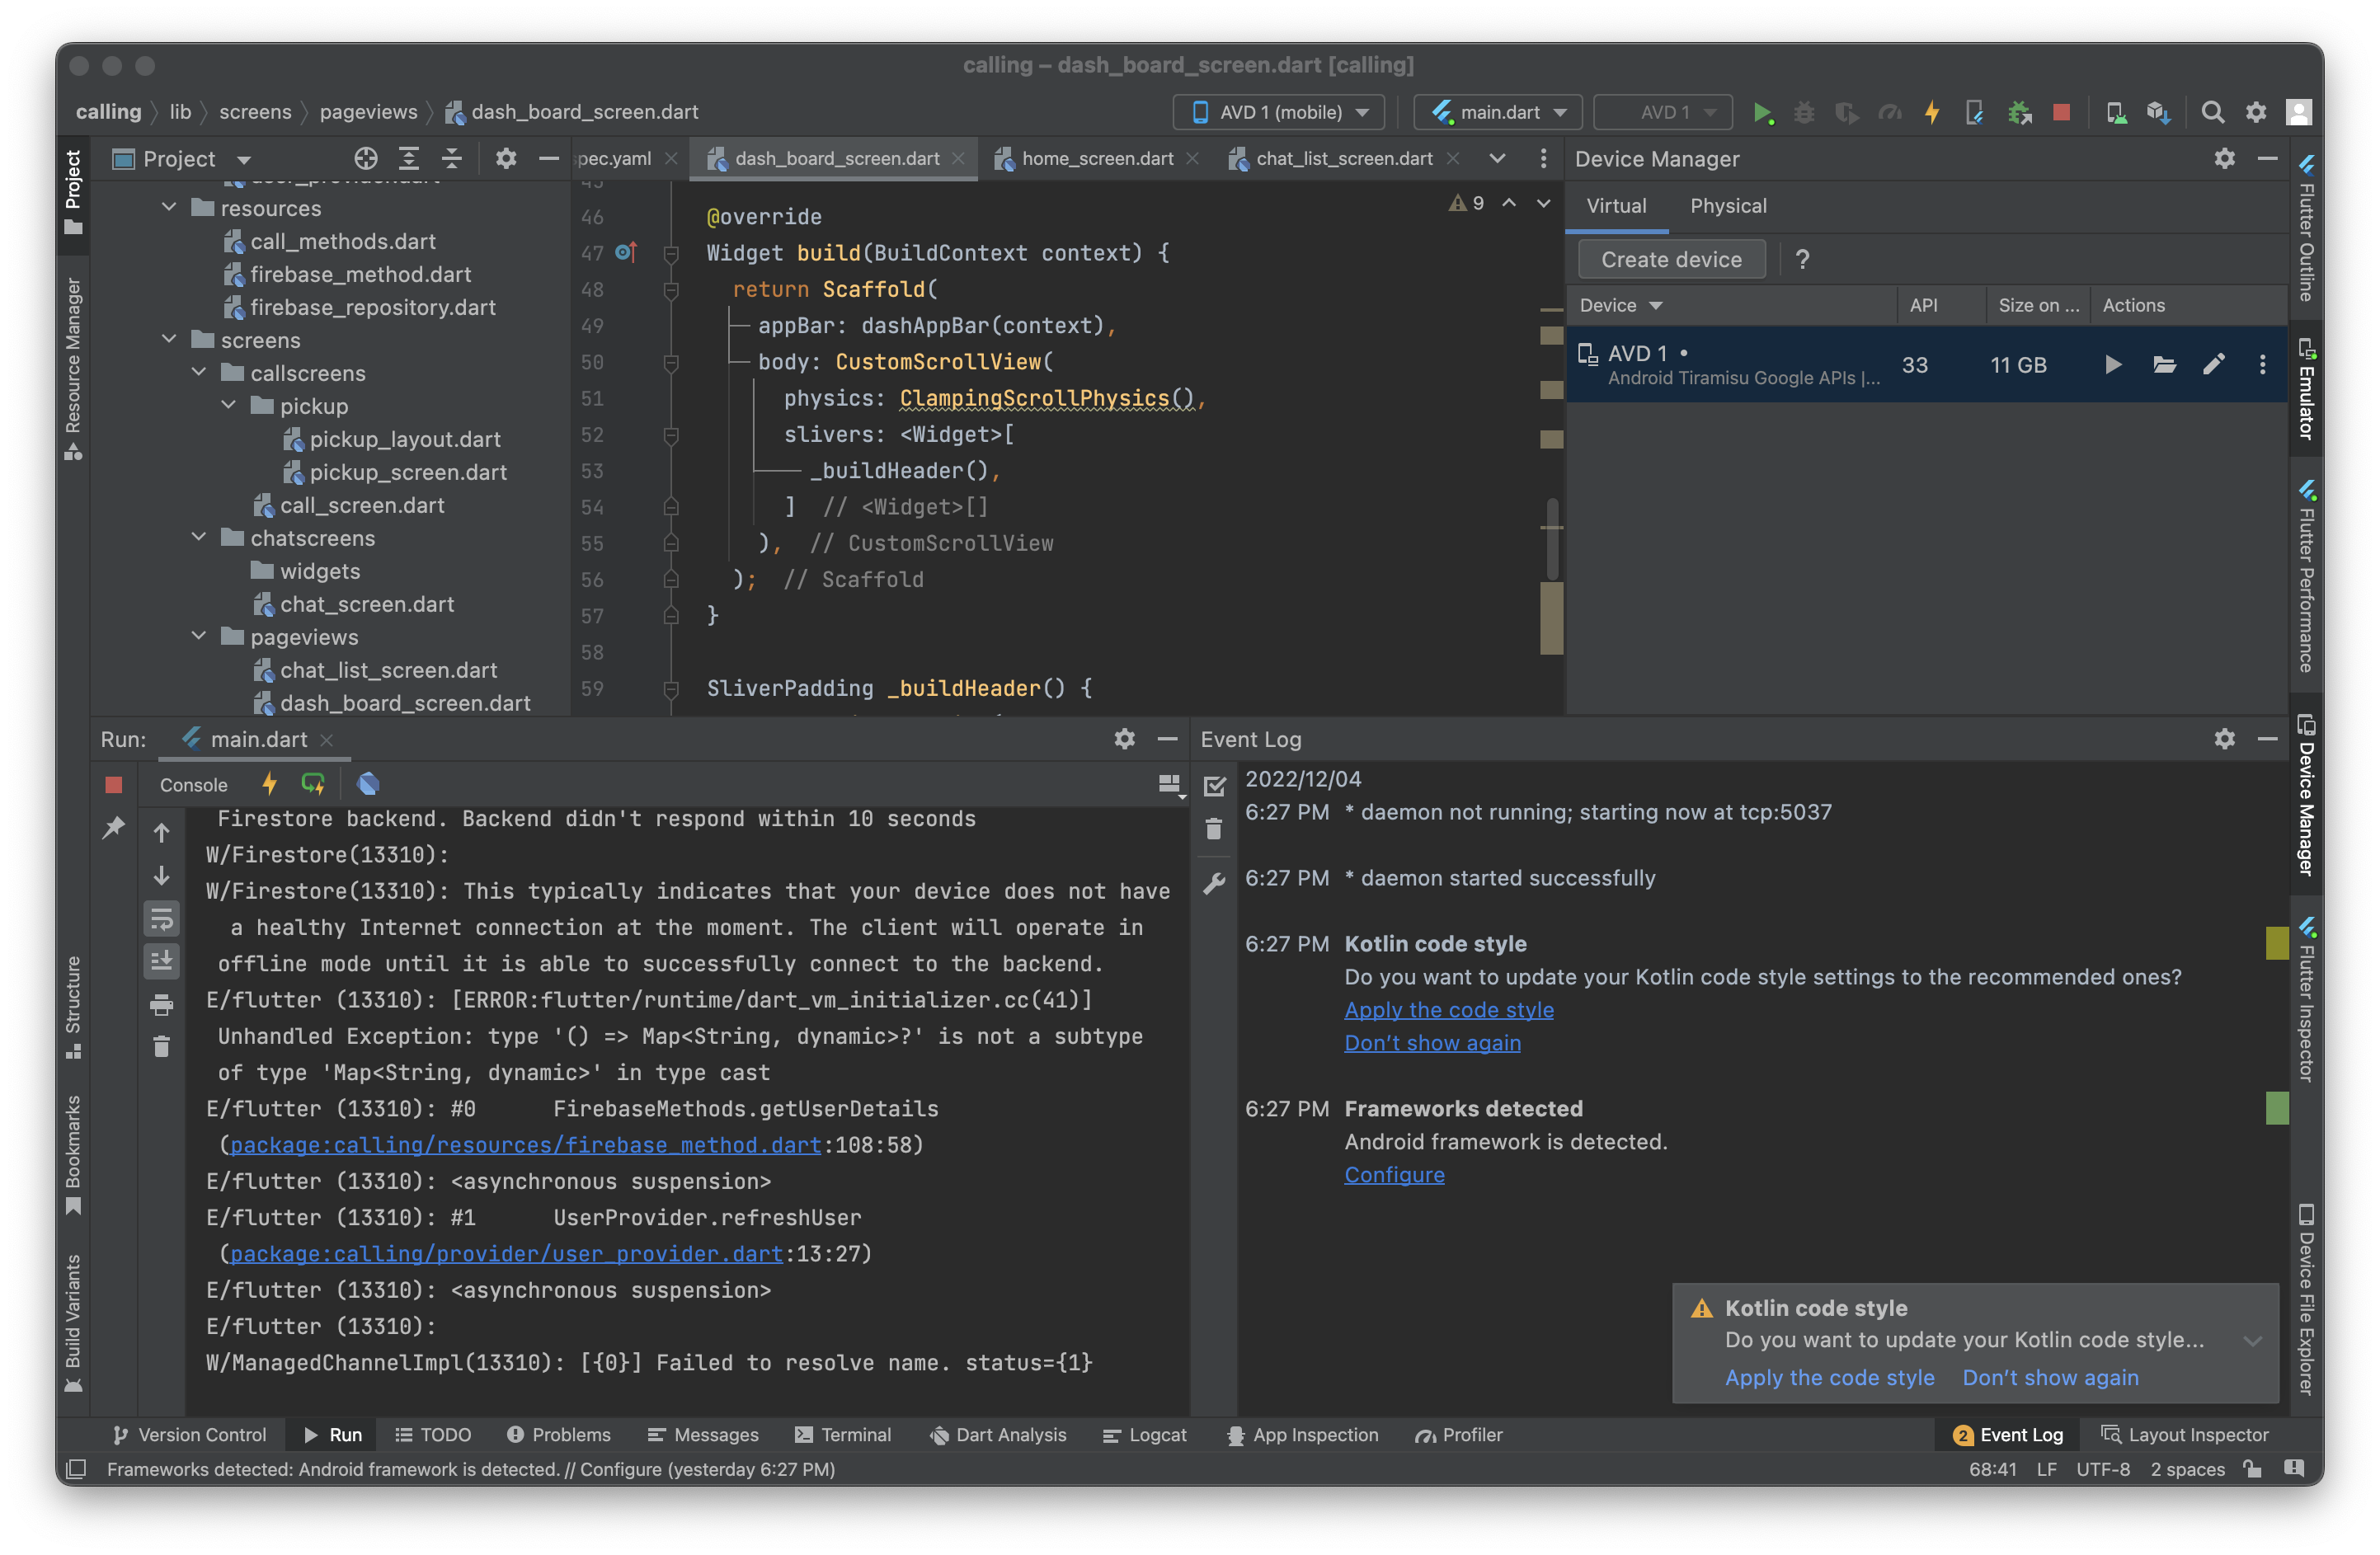
Scaffold를 반환하는 항목에 dashboard app bar를 그리도록 코드 넣기
- 구현 화면
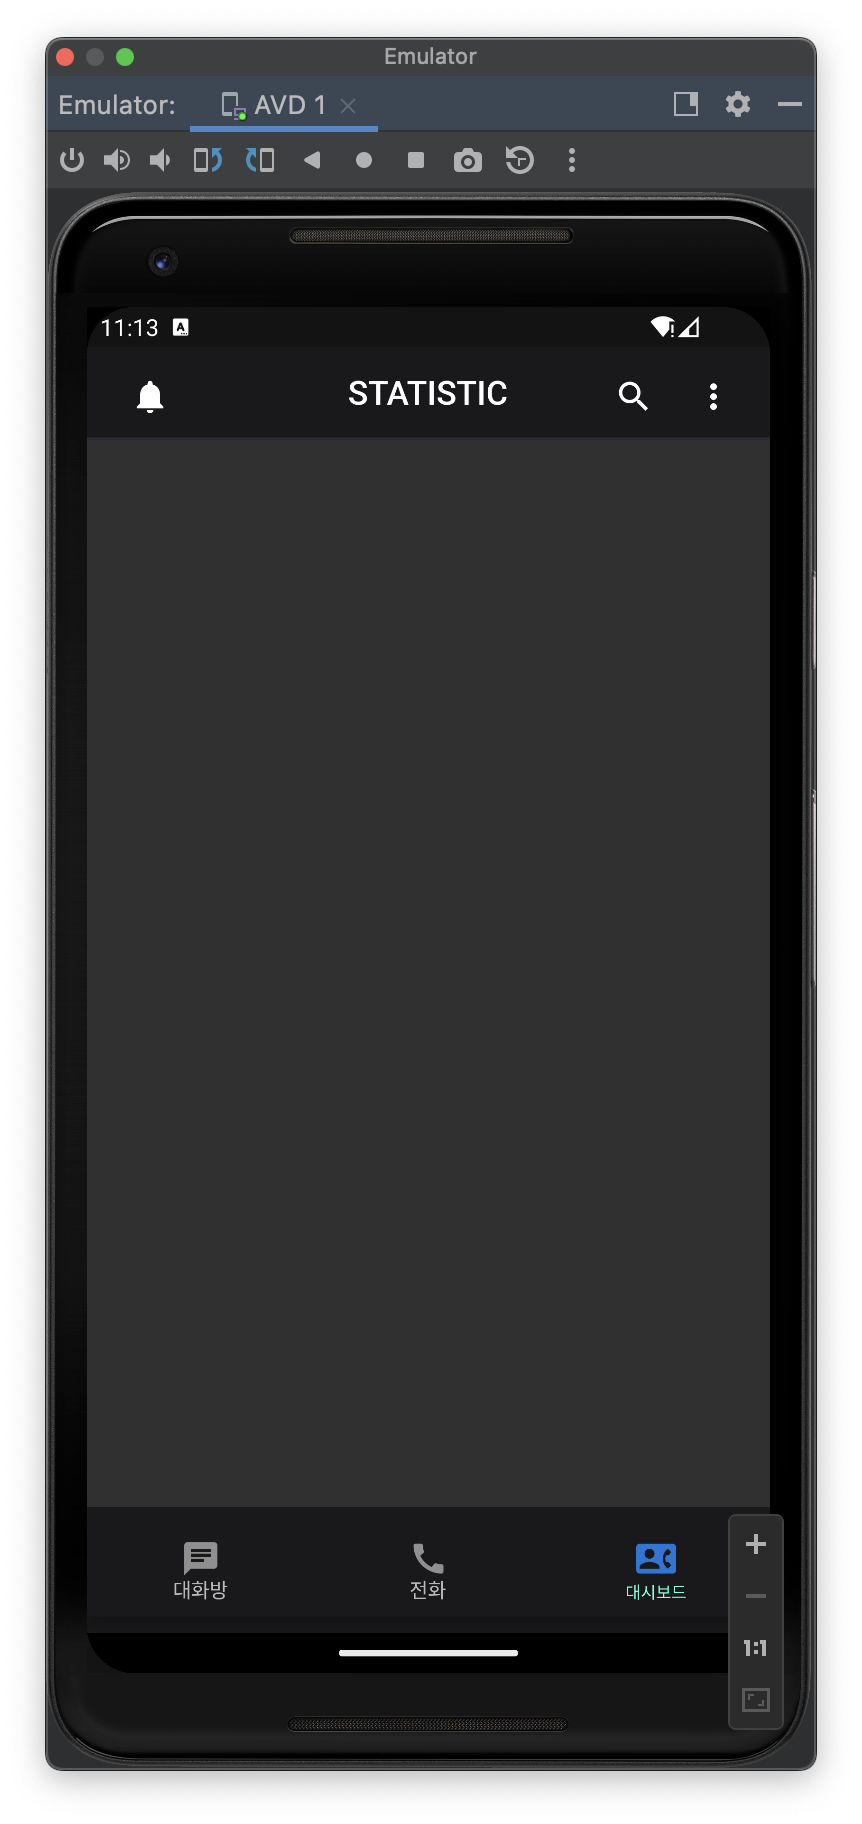
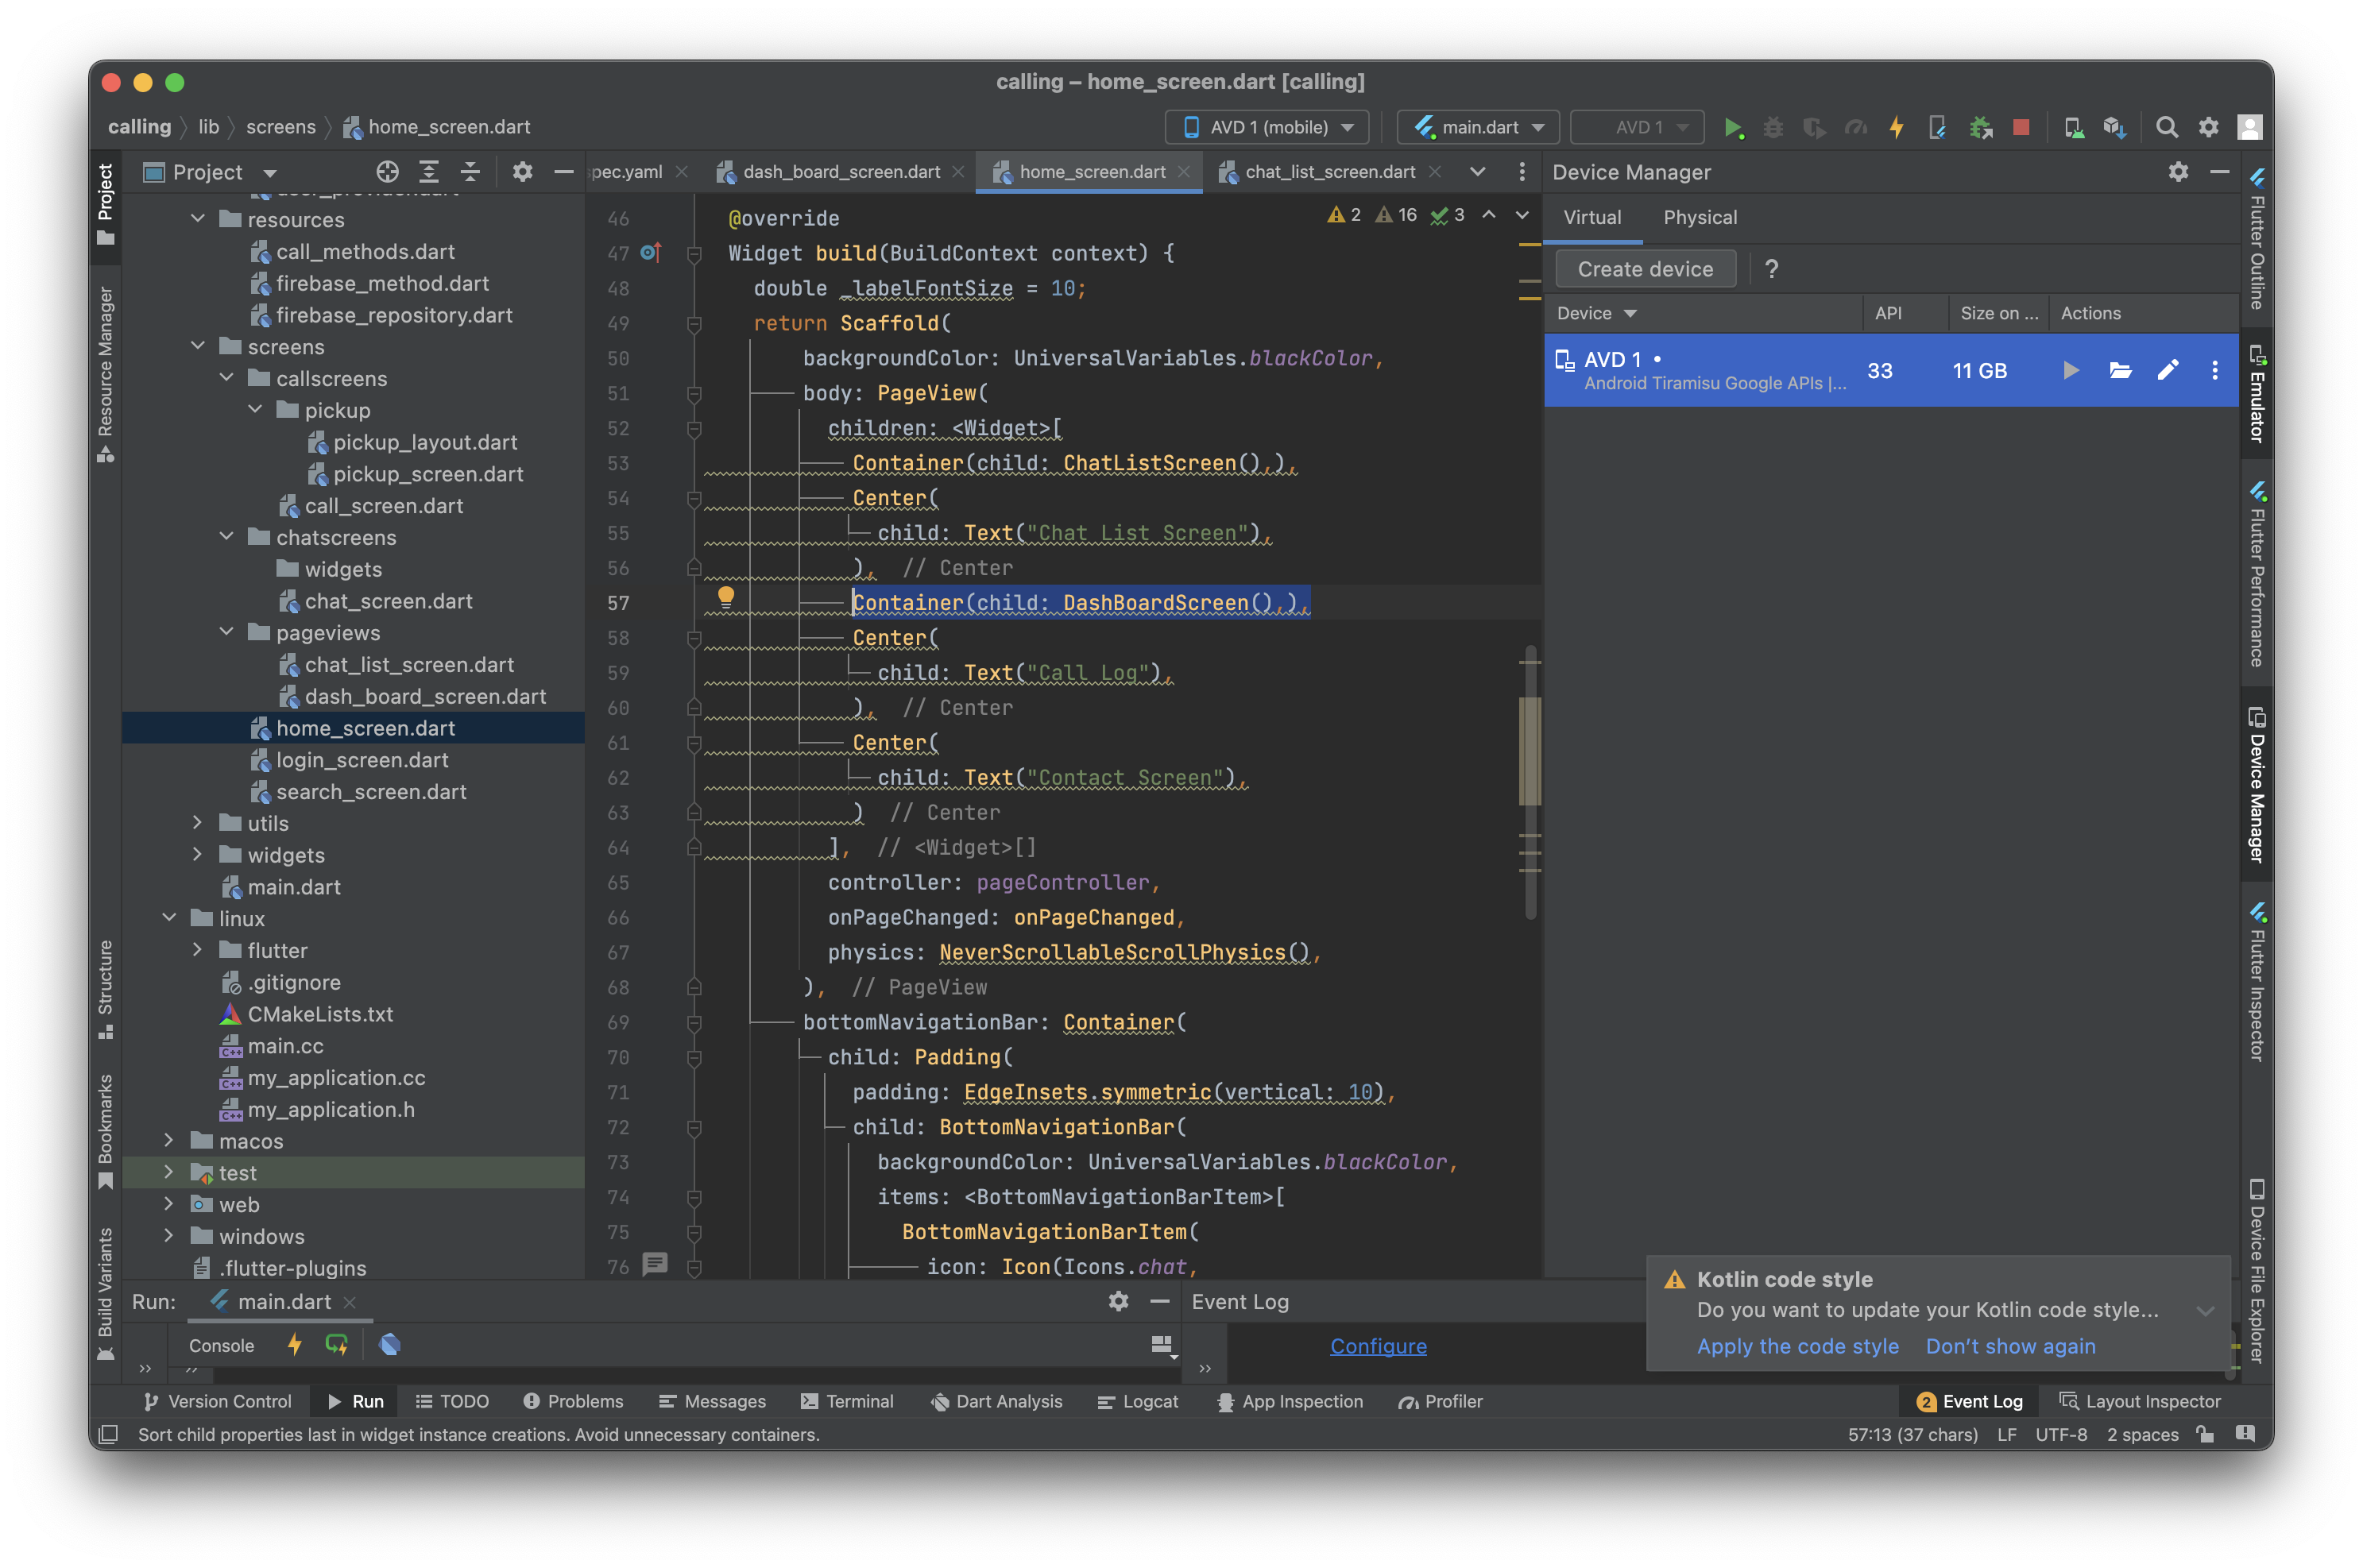
- home screen에서 세 번째 네비게이션 눌렀을 때 대시보드 화면으로 이동하도록 컨테이너 리턴
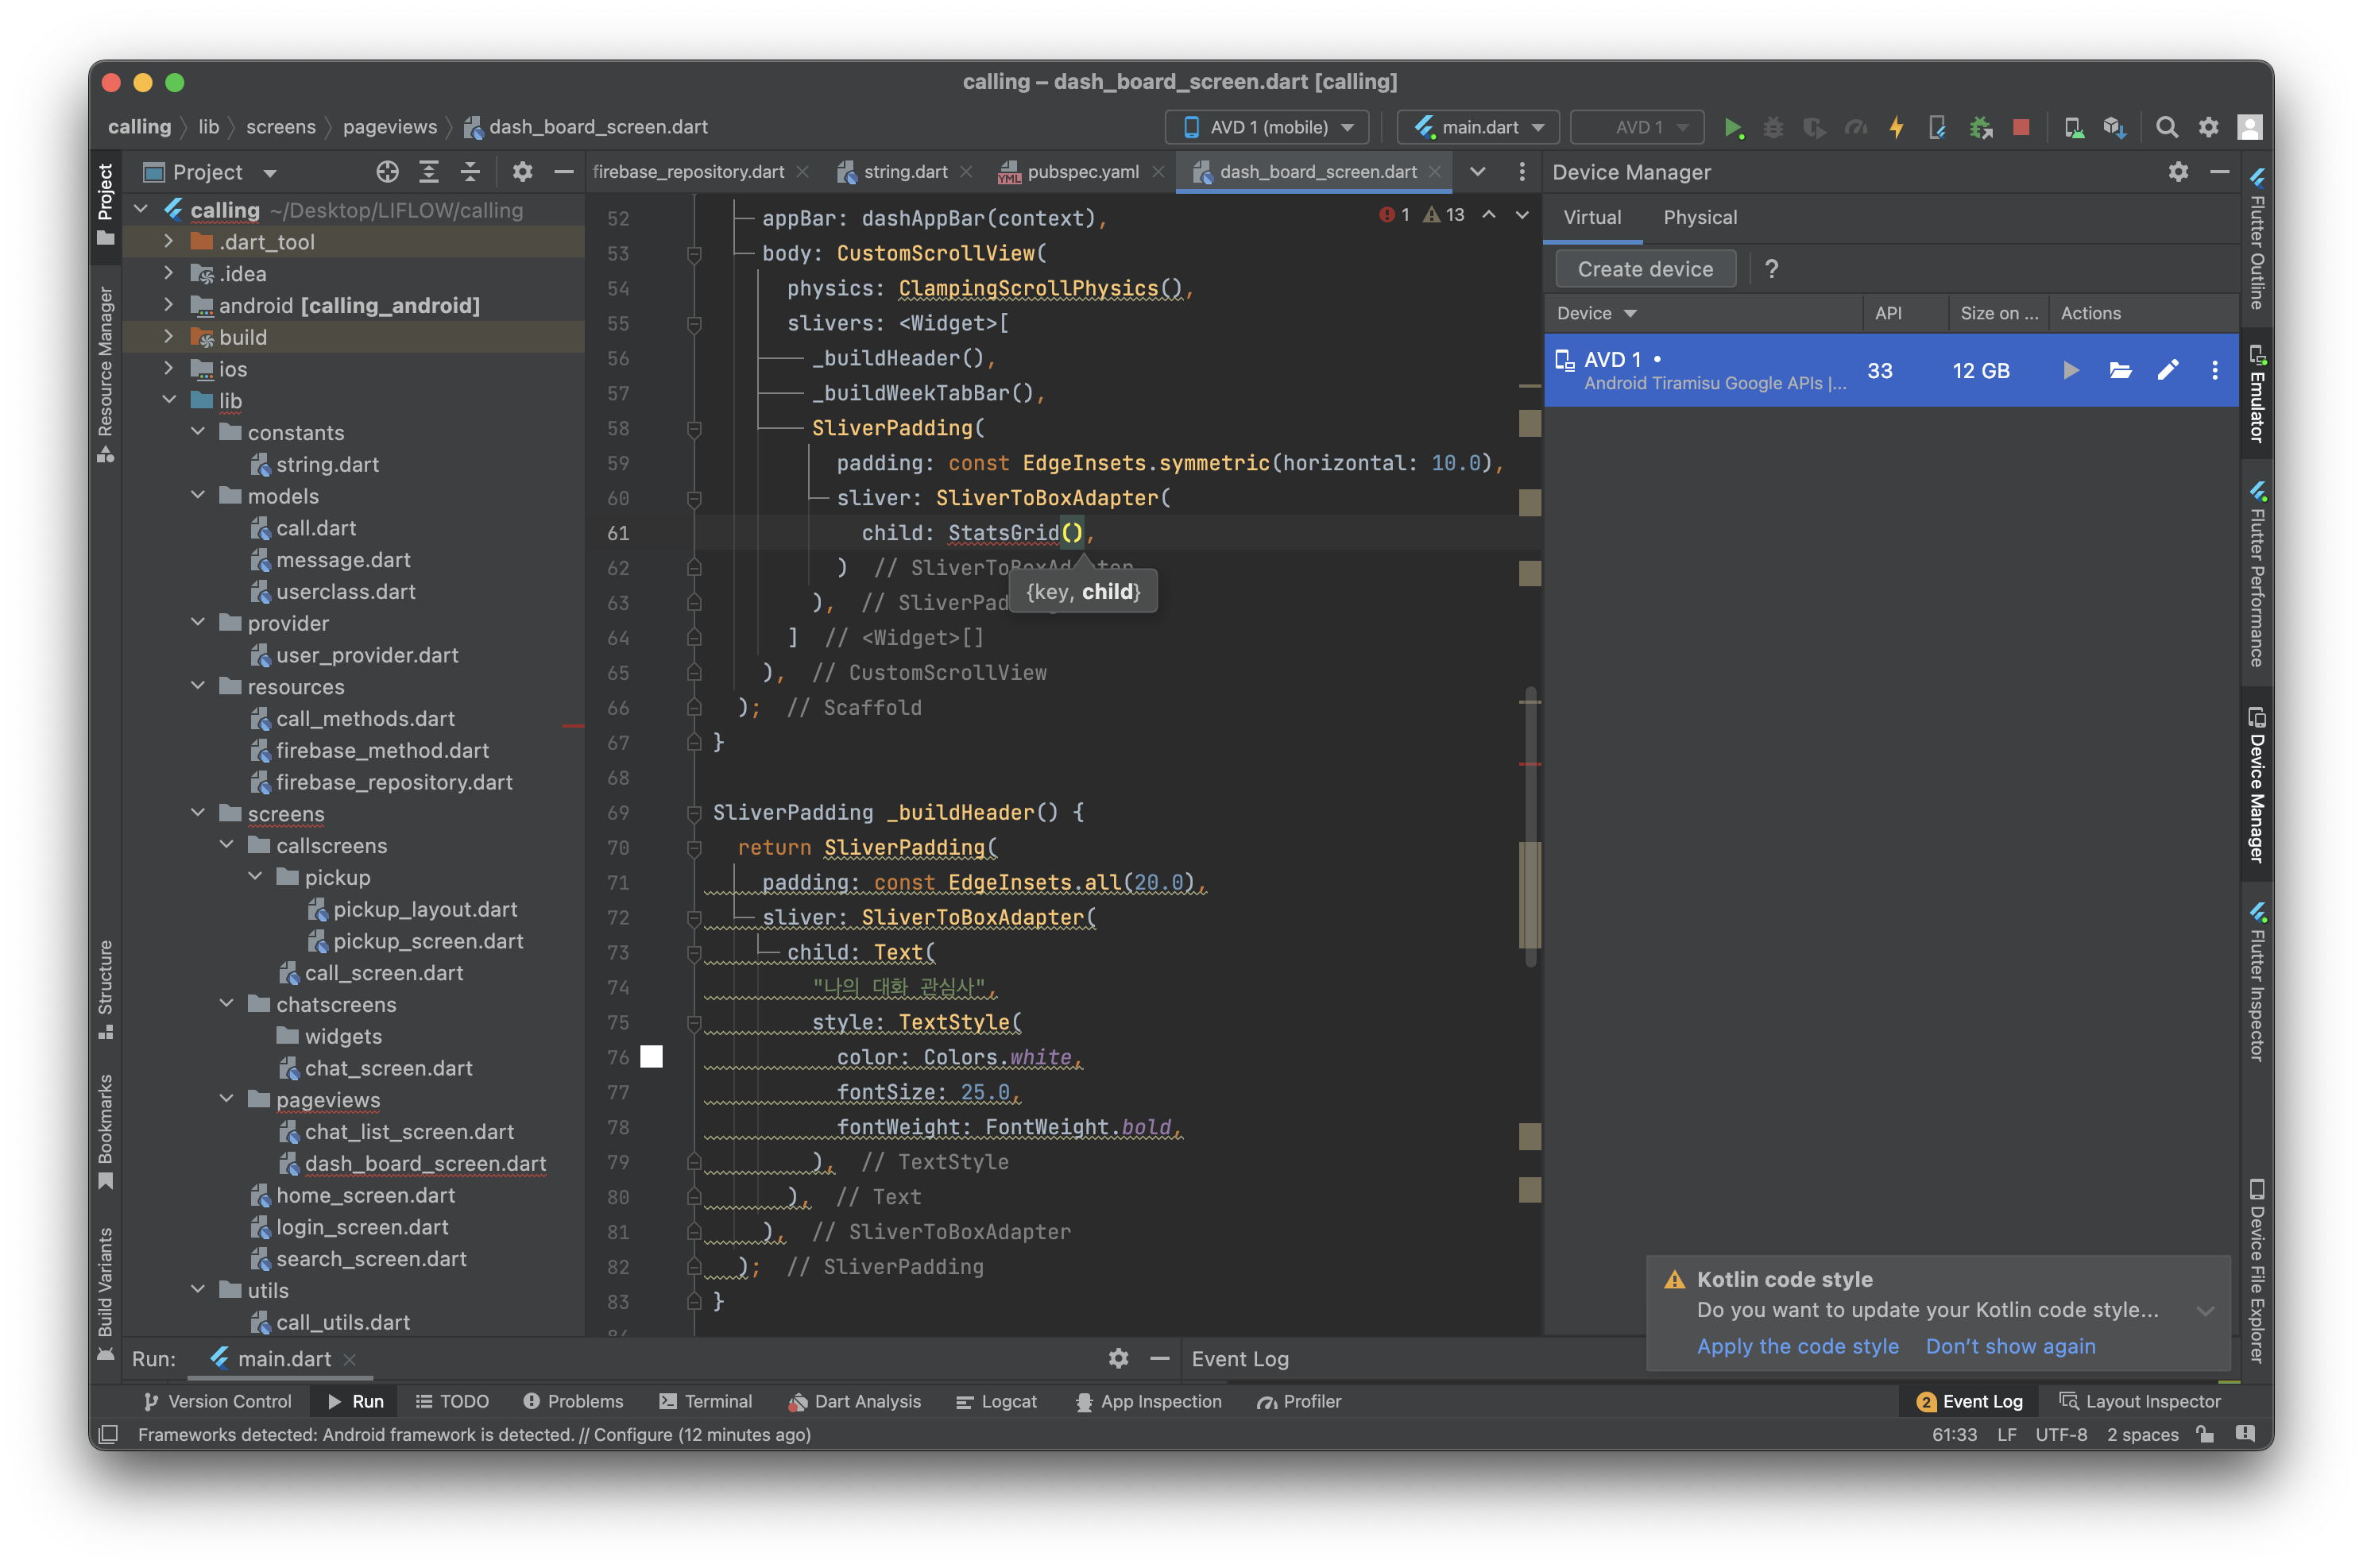
SliverPadding
-
Scrollview에 SliverPadding 위젯 바디로 설정하기
-
SliverPadding으로 통계치 넣는 패딩 설정
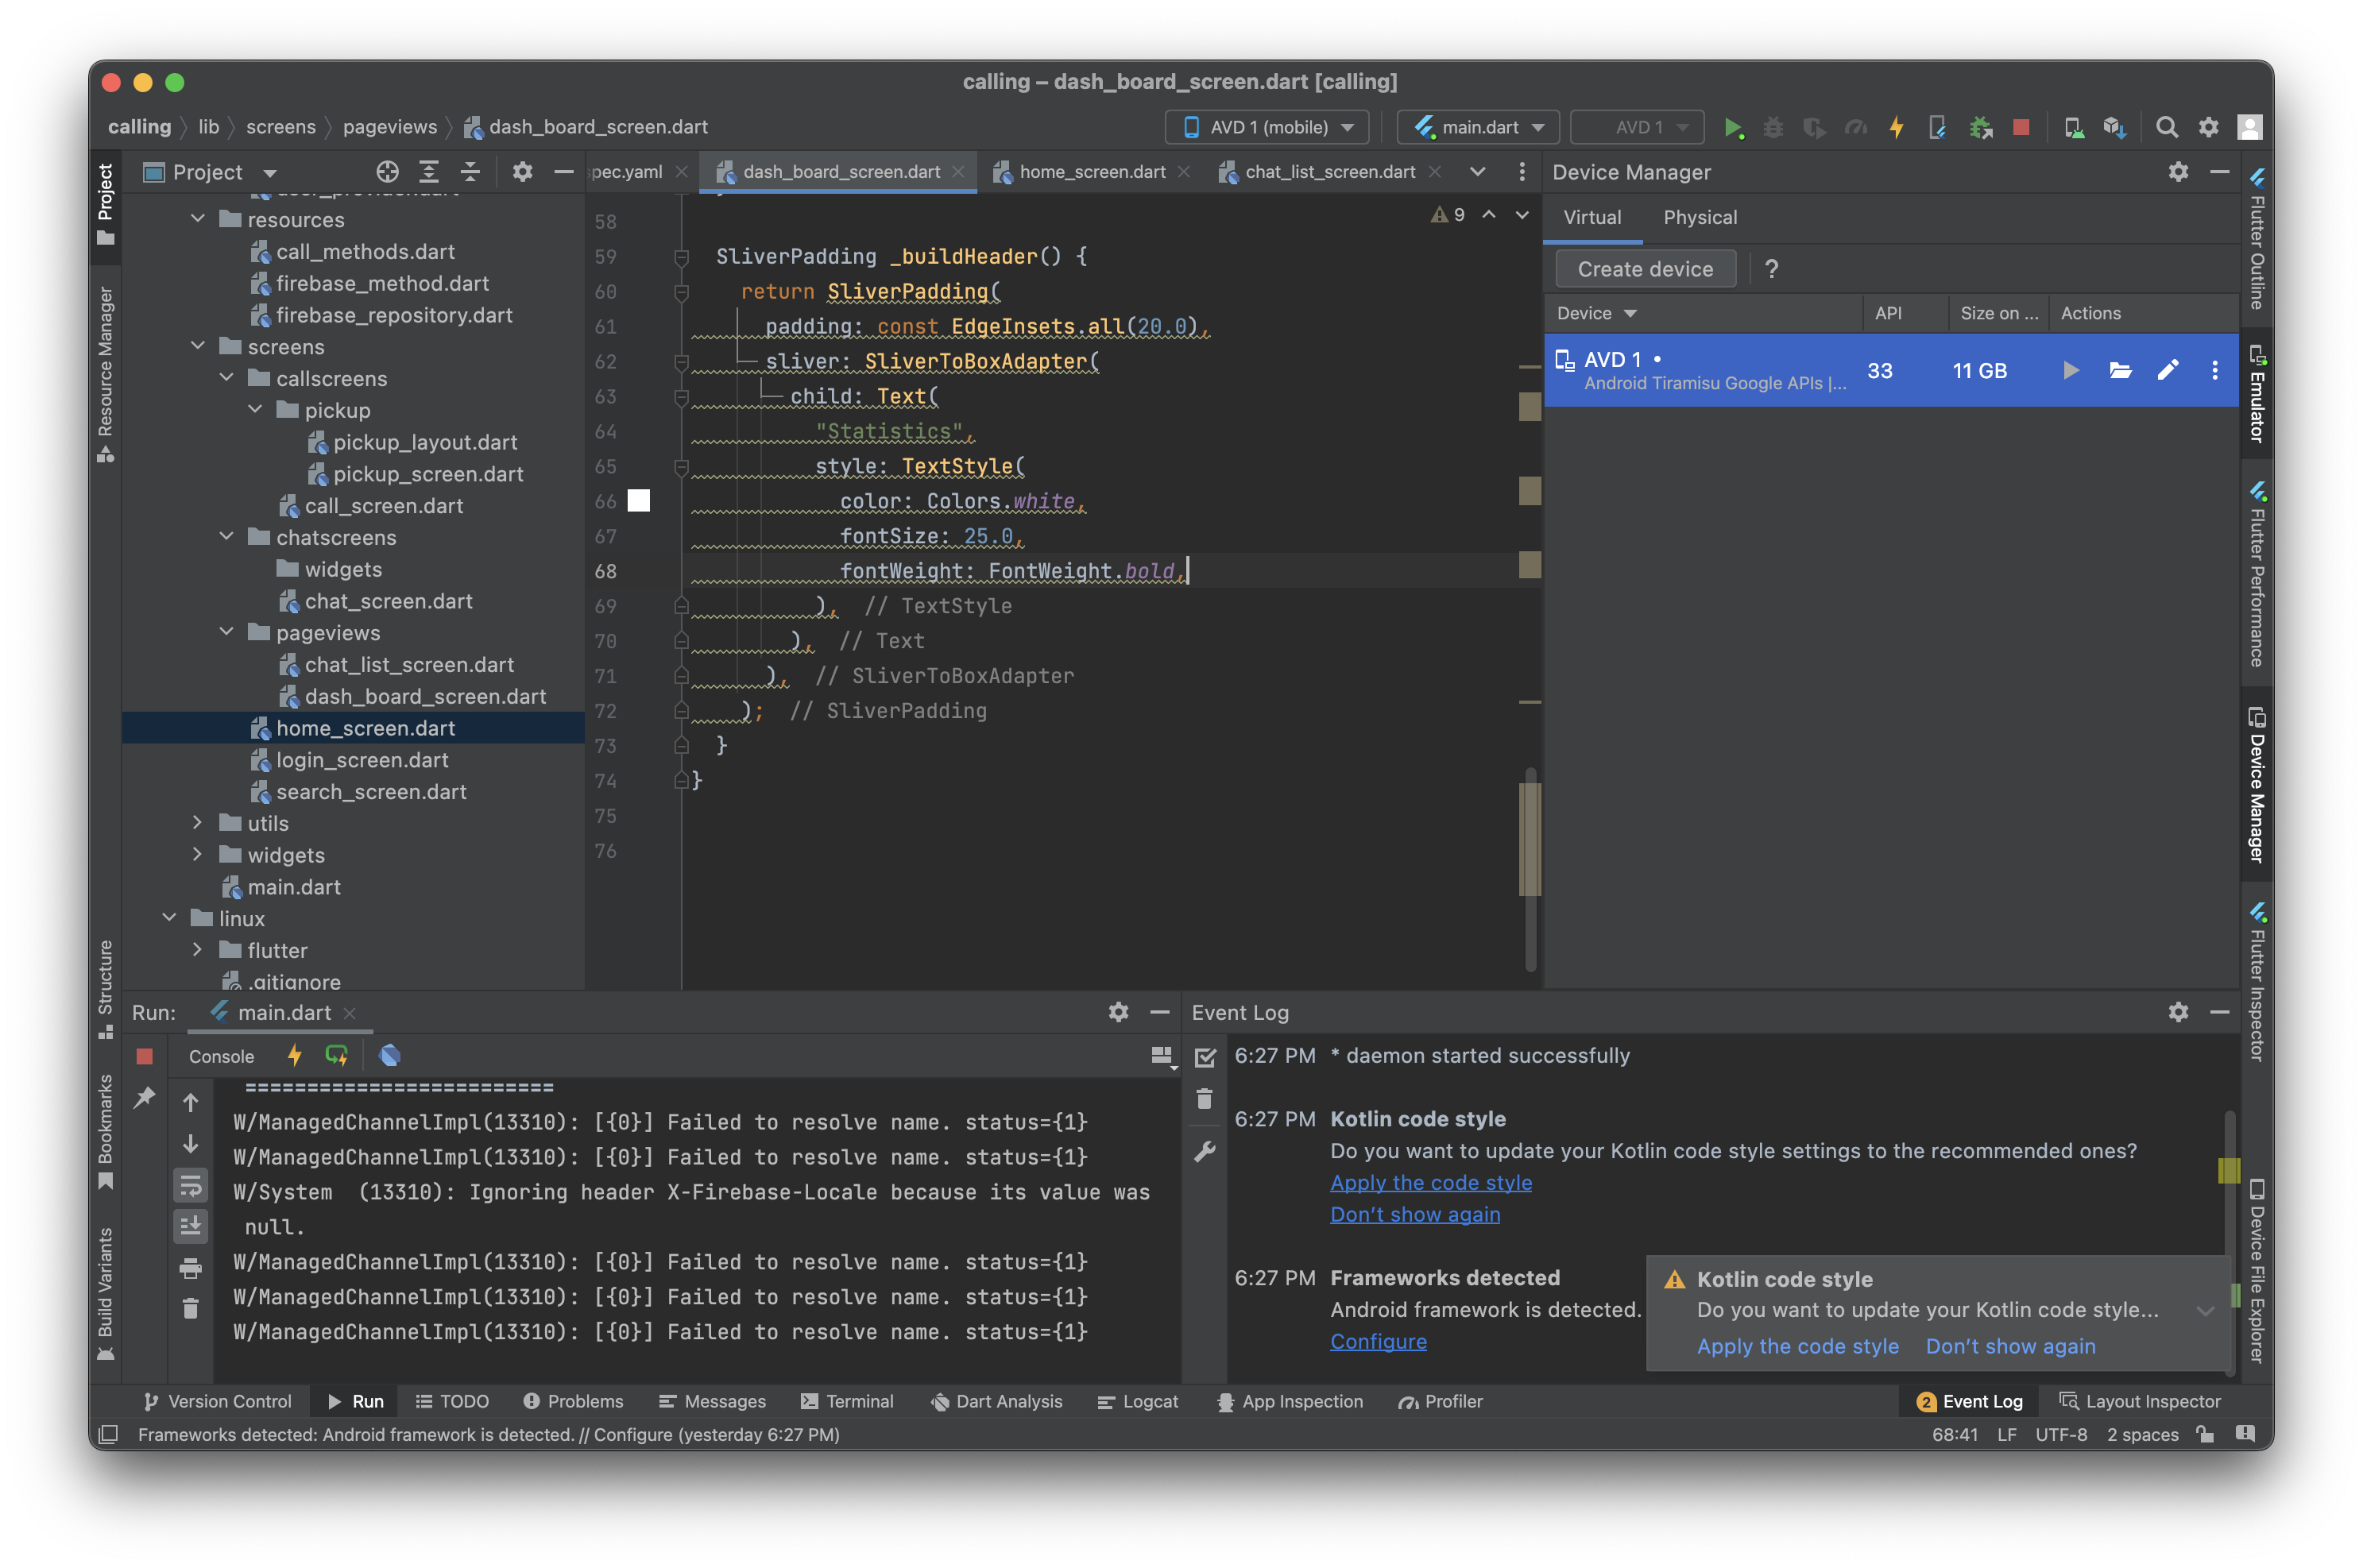
SliverPadding _buildHeader() {
    return SliverPadding(
      padding: const EdgeInsets.all(20.0),
      sliver: SliverToBoxAdapter(
        child: Text(
          "Statistics",
          style: TextStyle(
            color: Colors.white,
            fontSize: 25.0,
            fontWeight: FontWeight.bold,
          ),
        ),
      ),
    );
SliverToBoxAdaptor
-
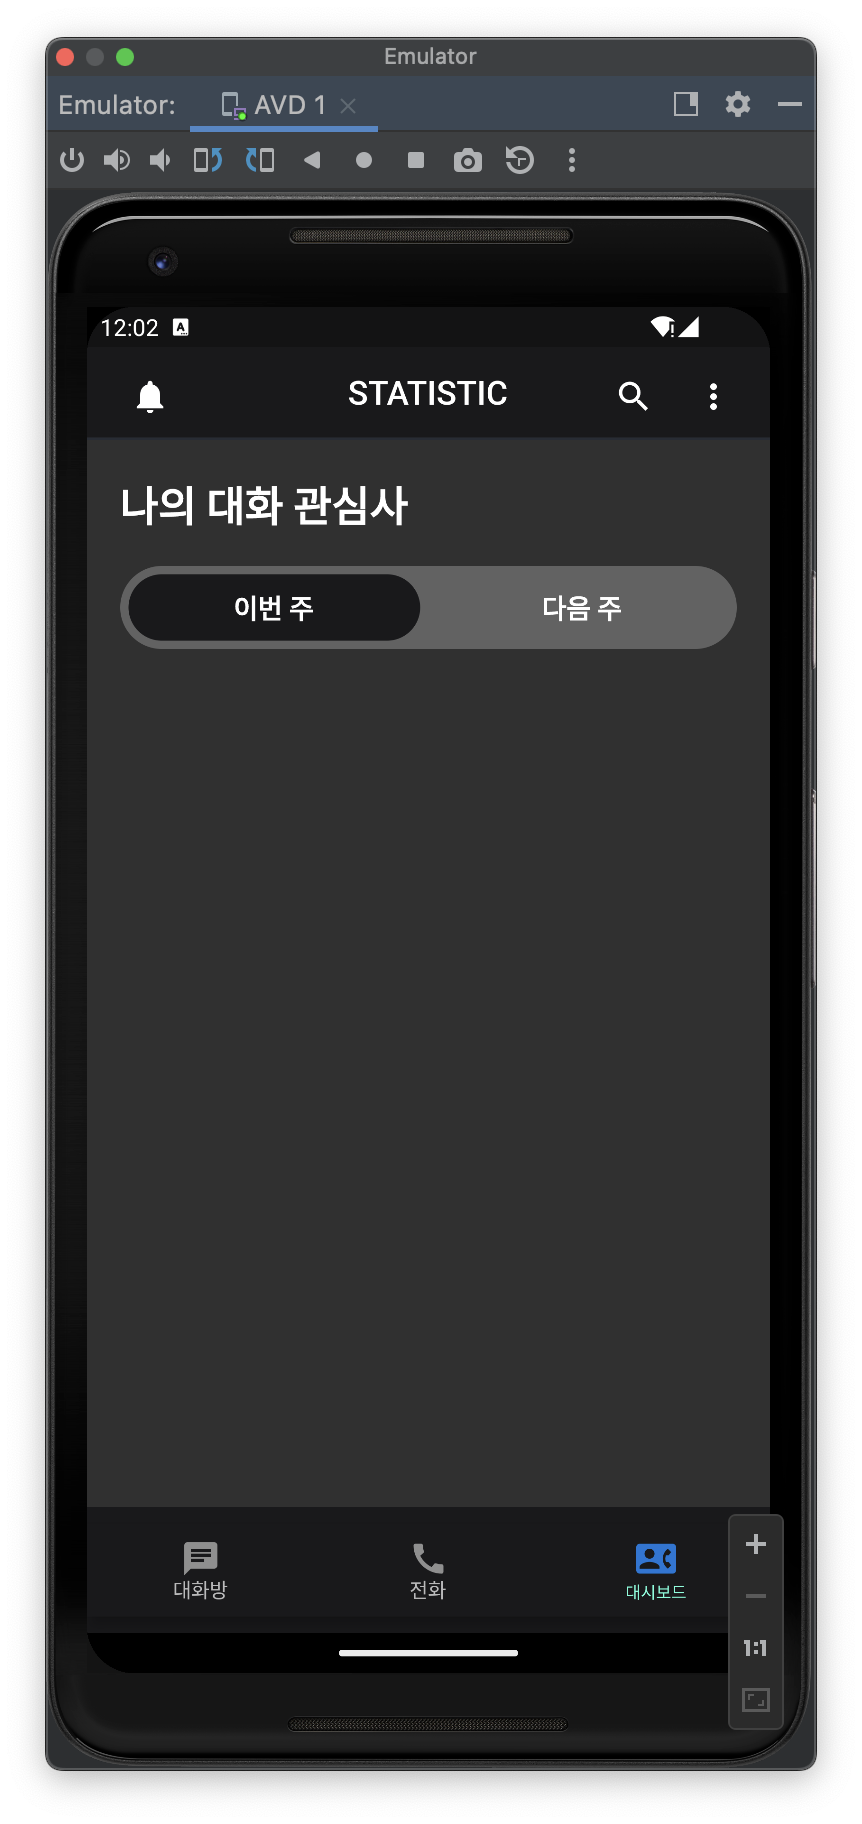
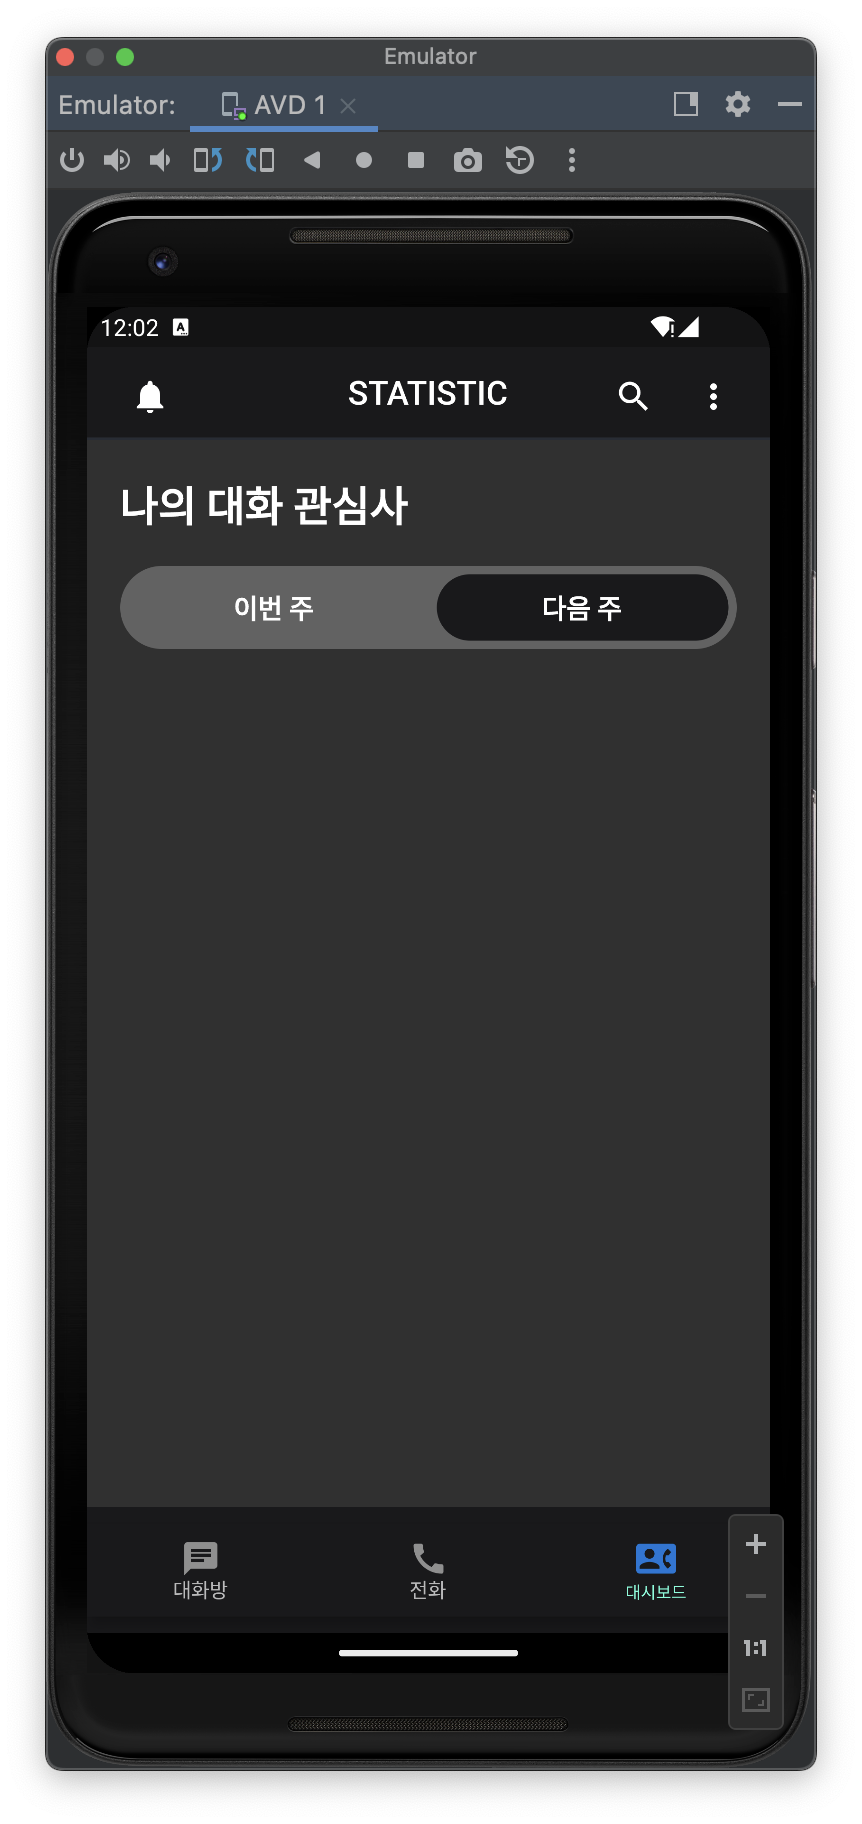
SliverToBoxAdaptorf로 이번 주와 저번 주 대화 키워드를 볼 수 있도록 팝업 설정
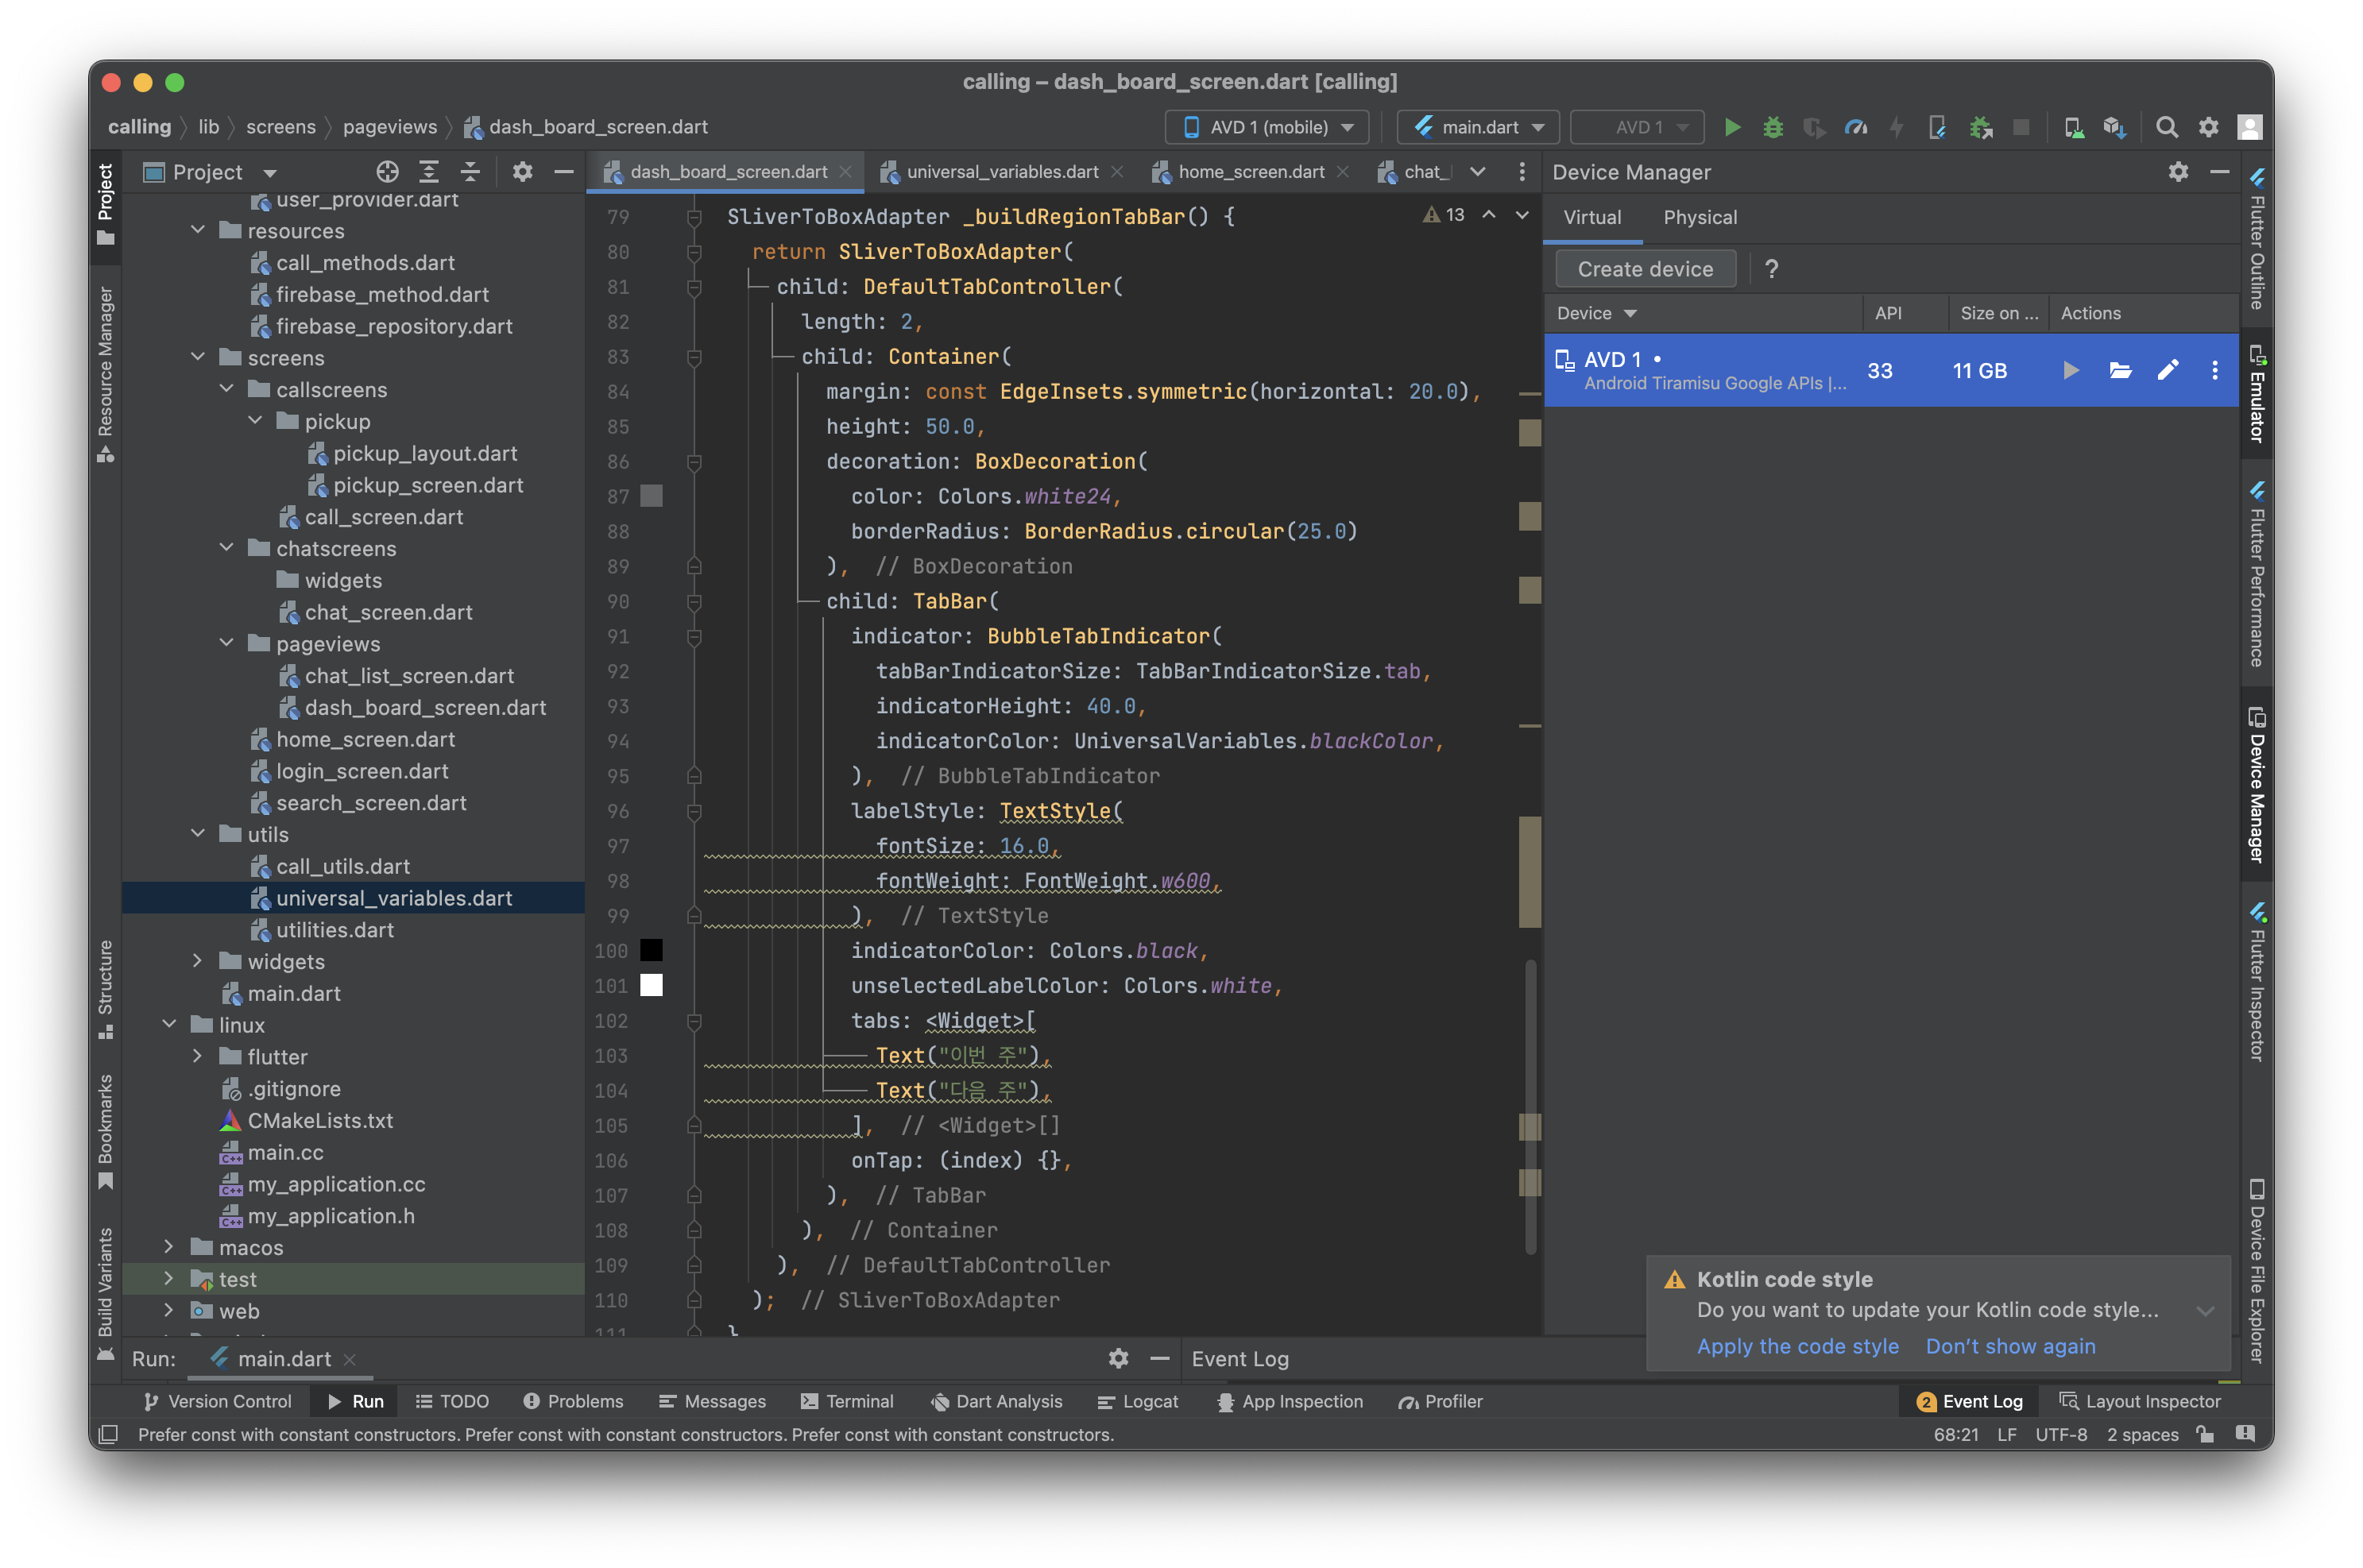
SliverToBoxAdapter _buildRegionTabBar() { return SliverToBoxAdapter( child: DefaultTabController( length: 2, child: Container( margin: const EdgeInsets.symmetric(horizontal: 20.0), height: 50.0, decoration: BoxDecoration( color: Colors.white24, borderRadius: BorderRadius.circular(25.0) ), child: TabBar( indicator: BubbleTabIndicator( tabBarIndicatorSize: TabBarIndicatorSize.tab, indicatorHeight: 40.0, indicatorColor: UniversalVariables.blackColor, ), labelStyle: TextStyle( fontSize: 16.0, fontWeight: FontWeight.w600, ), indicatorColor: Colors.black, unselectedLabelColor: Colors.white, tabs: <Widget>[ Text("이번 주"), Text("다음 주"), ], onTap: (index) {}, ), ), ), ); -
구현 화면
StatsGrid
-
dashboard screen body에 stats grid widget 추가
-
키워드와 %를 띄워서 보여 줄 위젯 카드 생성
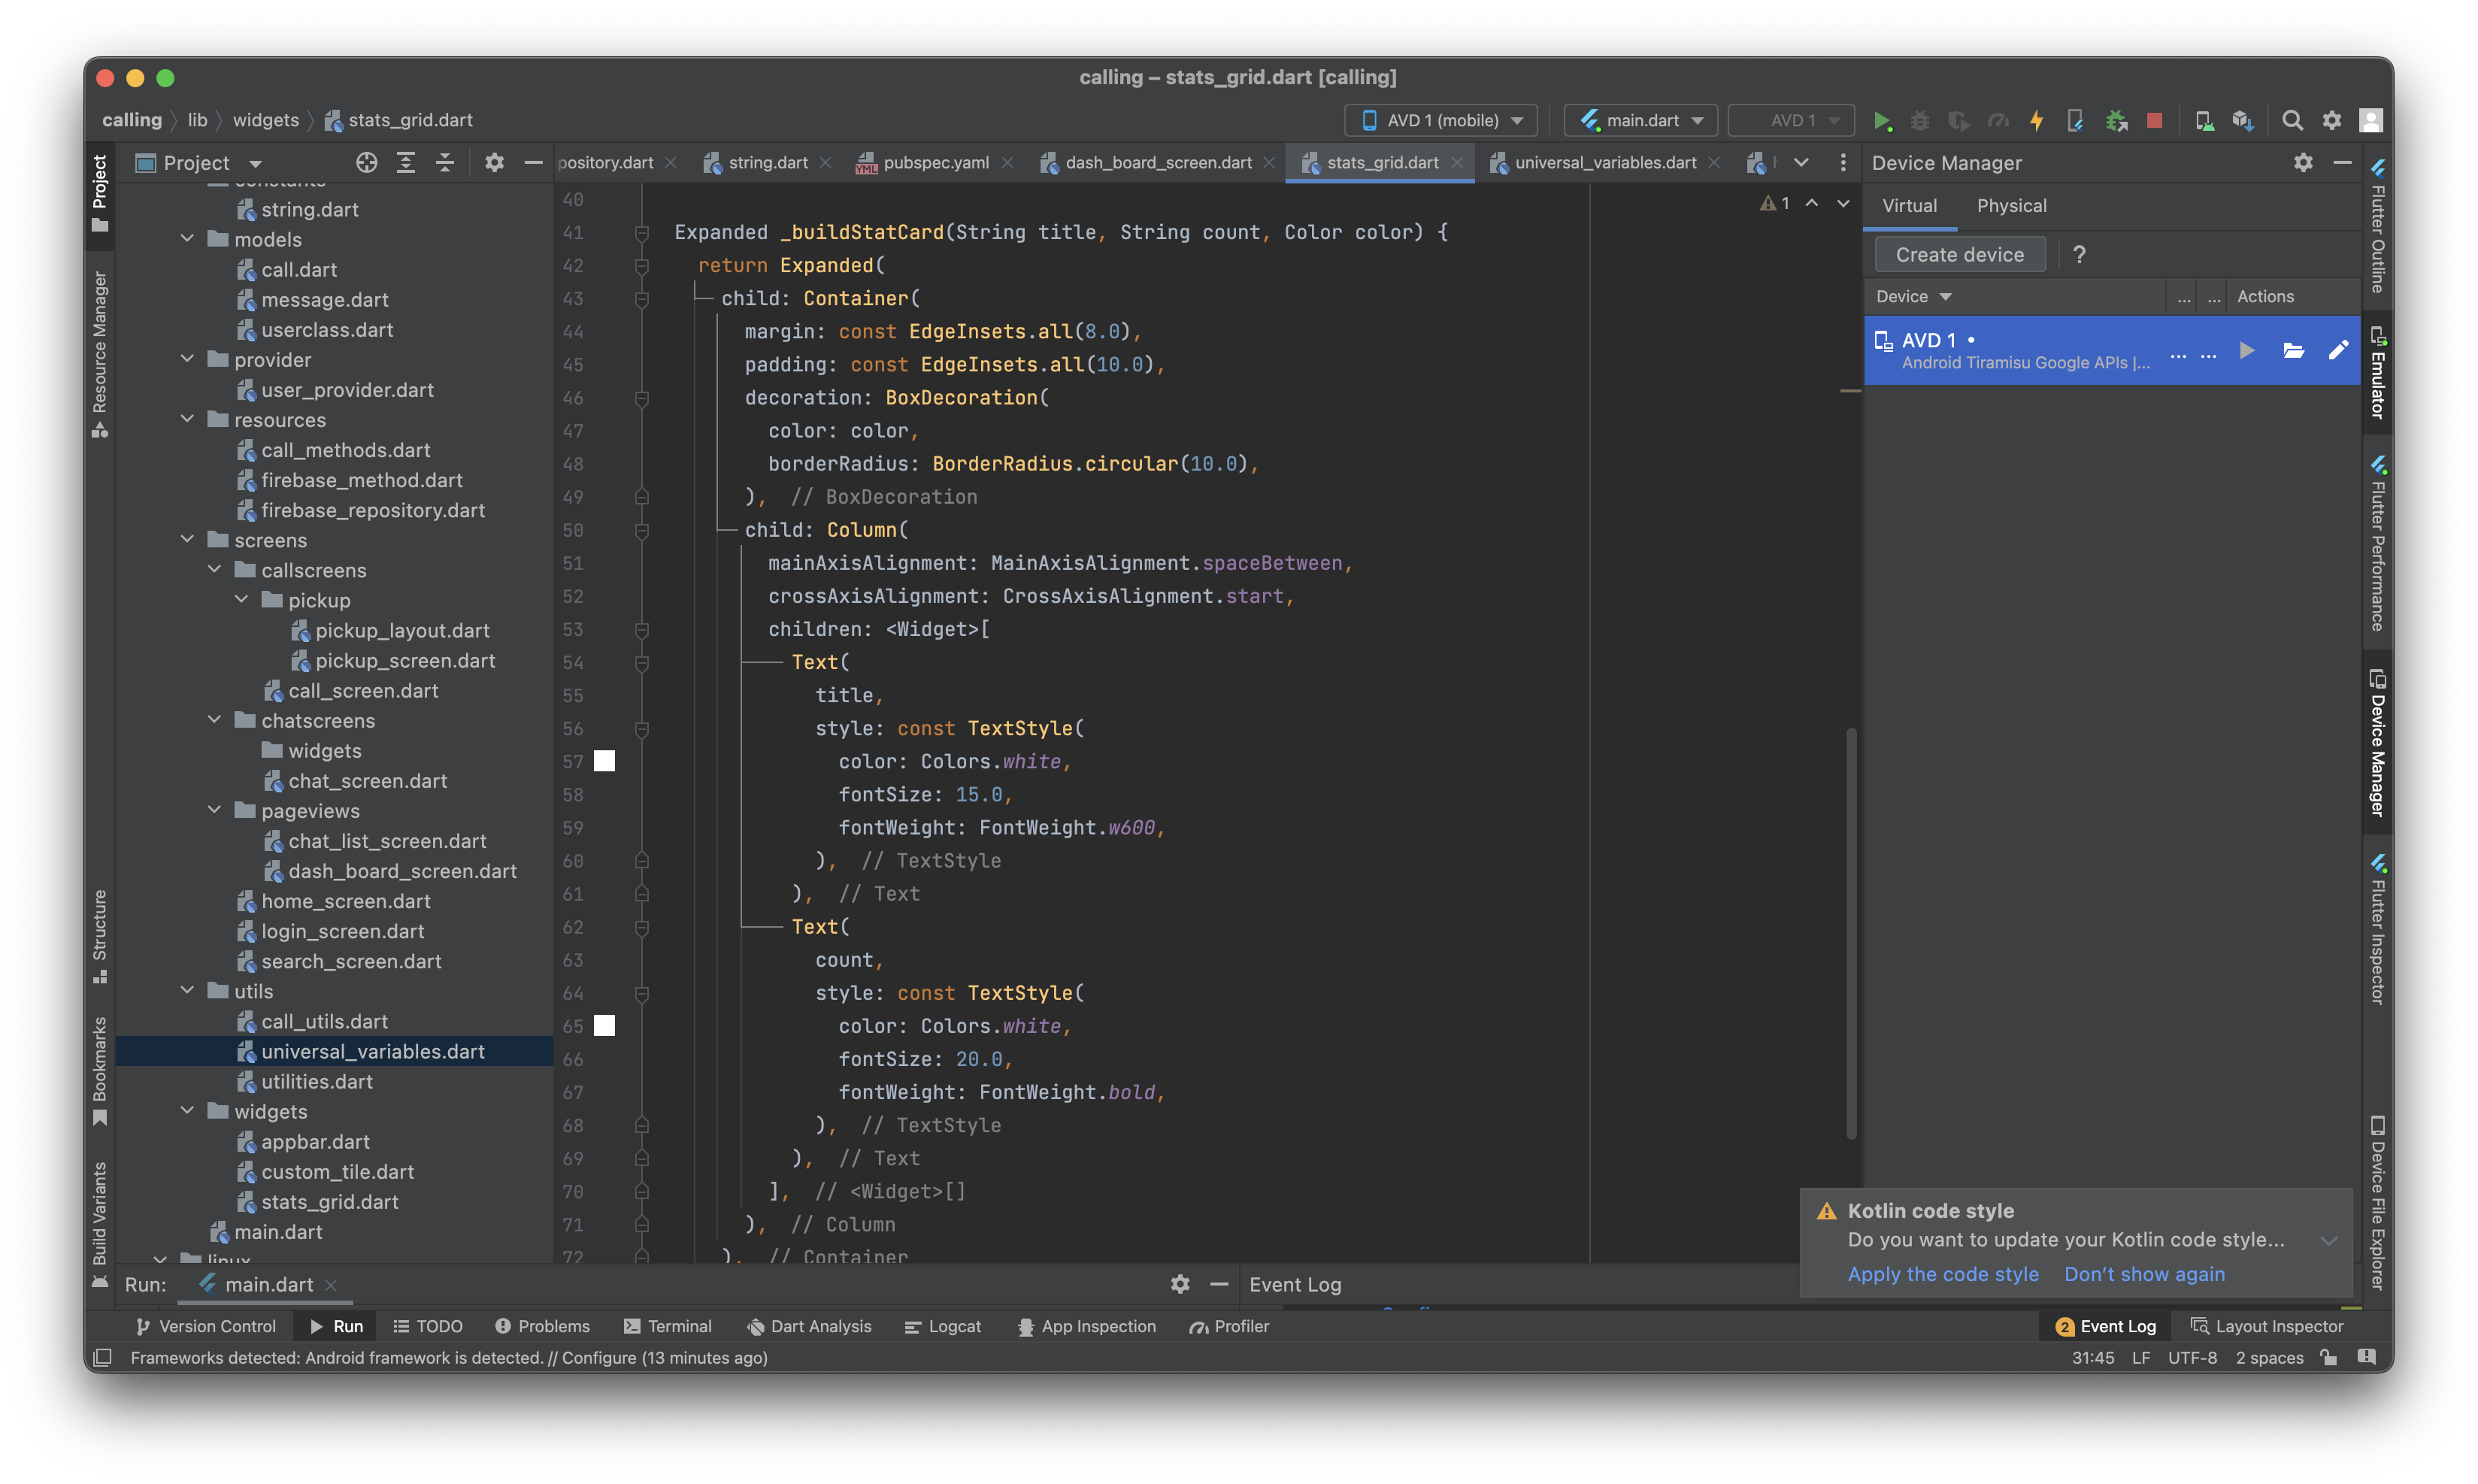
Expanded _buildStatCard(String title, String count, Color color) {
    return Expanded(
      child: Container(
        margin: const EdgeInsets.all(8.0),
        padding: const EdgeInsets.all(10.0),
        decoration: BoxDecoration(
          color: color,
          borderRadius: BorderRadius.circular(10.0),
        ),
        child: Column(
          mainAxisAlignment: MainAxisAlignment.spaceBetween,
          crossAxisAlignment: CrossAxisAlignment.start,
          children: <Widget>[
            Text(
              title,
              style: const TextStyle(
                color: Colors.white,
                fontSize: 15.0,
                fontWeight: FontWeight.w600,
              ),
            ),
            Text(
              count,
              style: const TextStyle(
                color: Colors.white,
                fontSize: 20.0,
                fontWeight: FontWeight.bold,
              ),
            ),
          ],
        ),
      ),
    );
  }
-
상위 다섯 개의 키워드를 parameter로 넘겨서 column과 row로 엮기
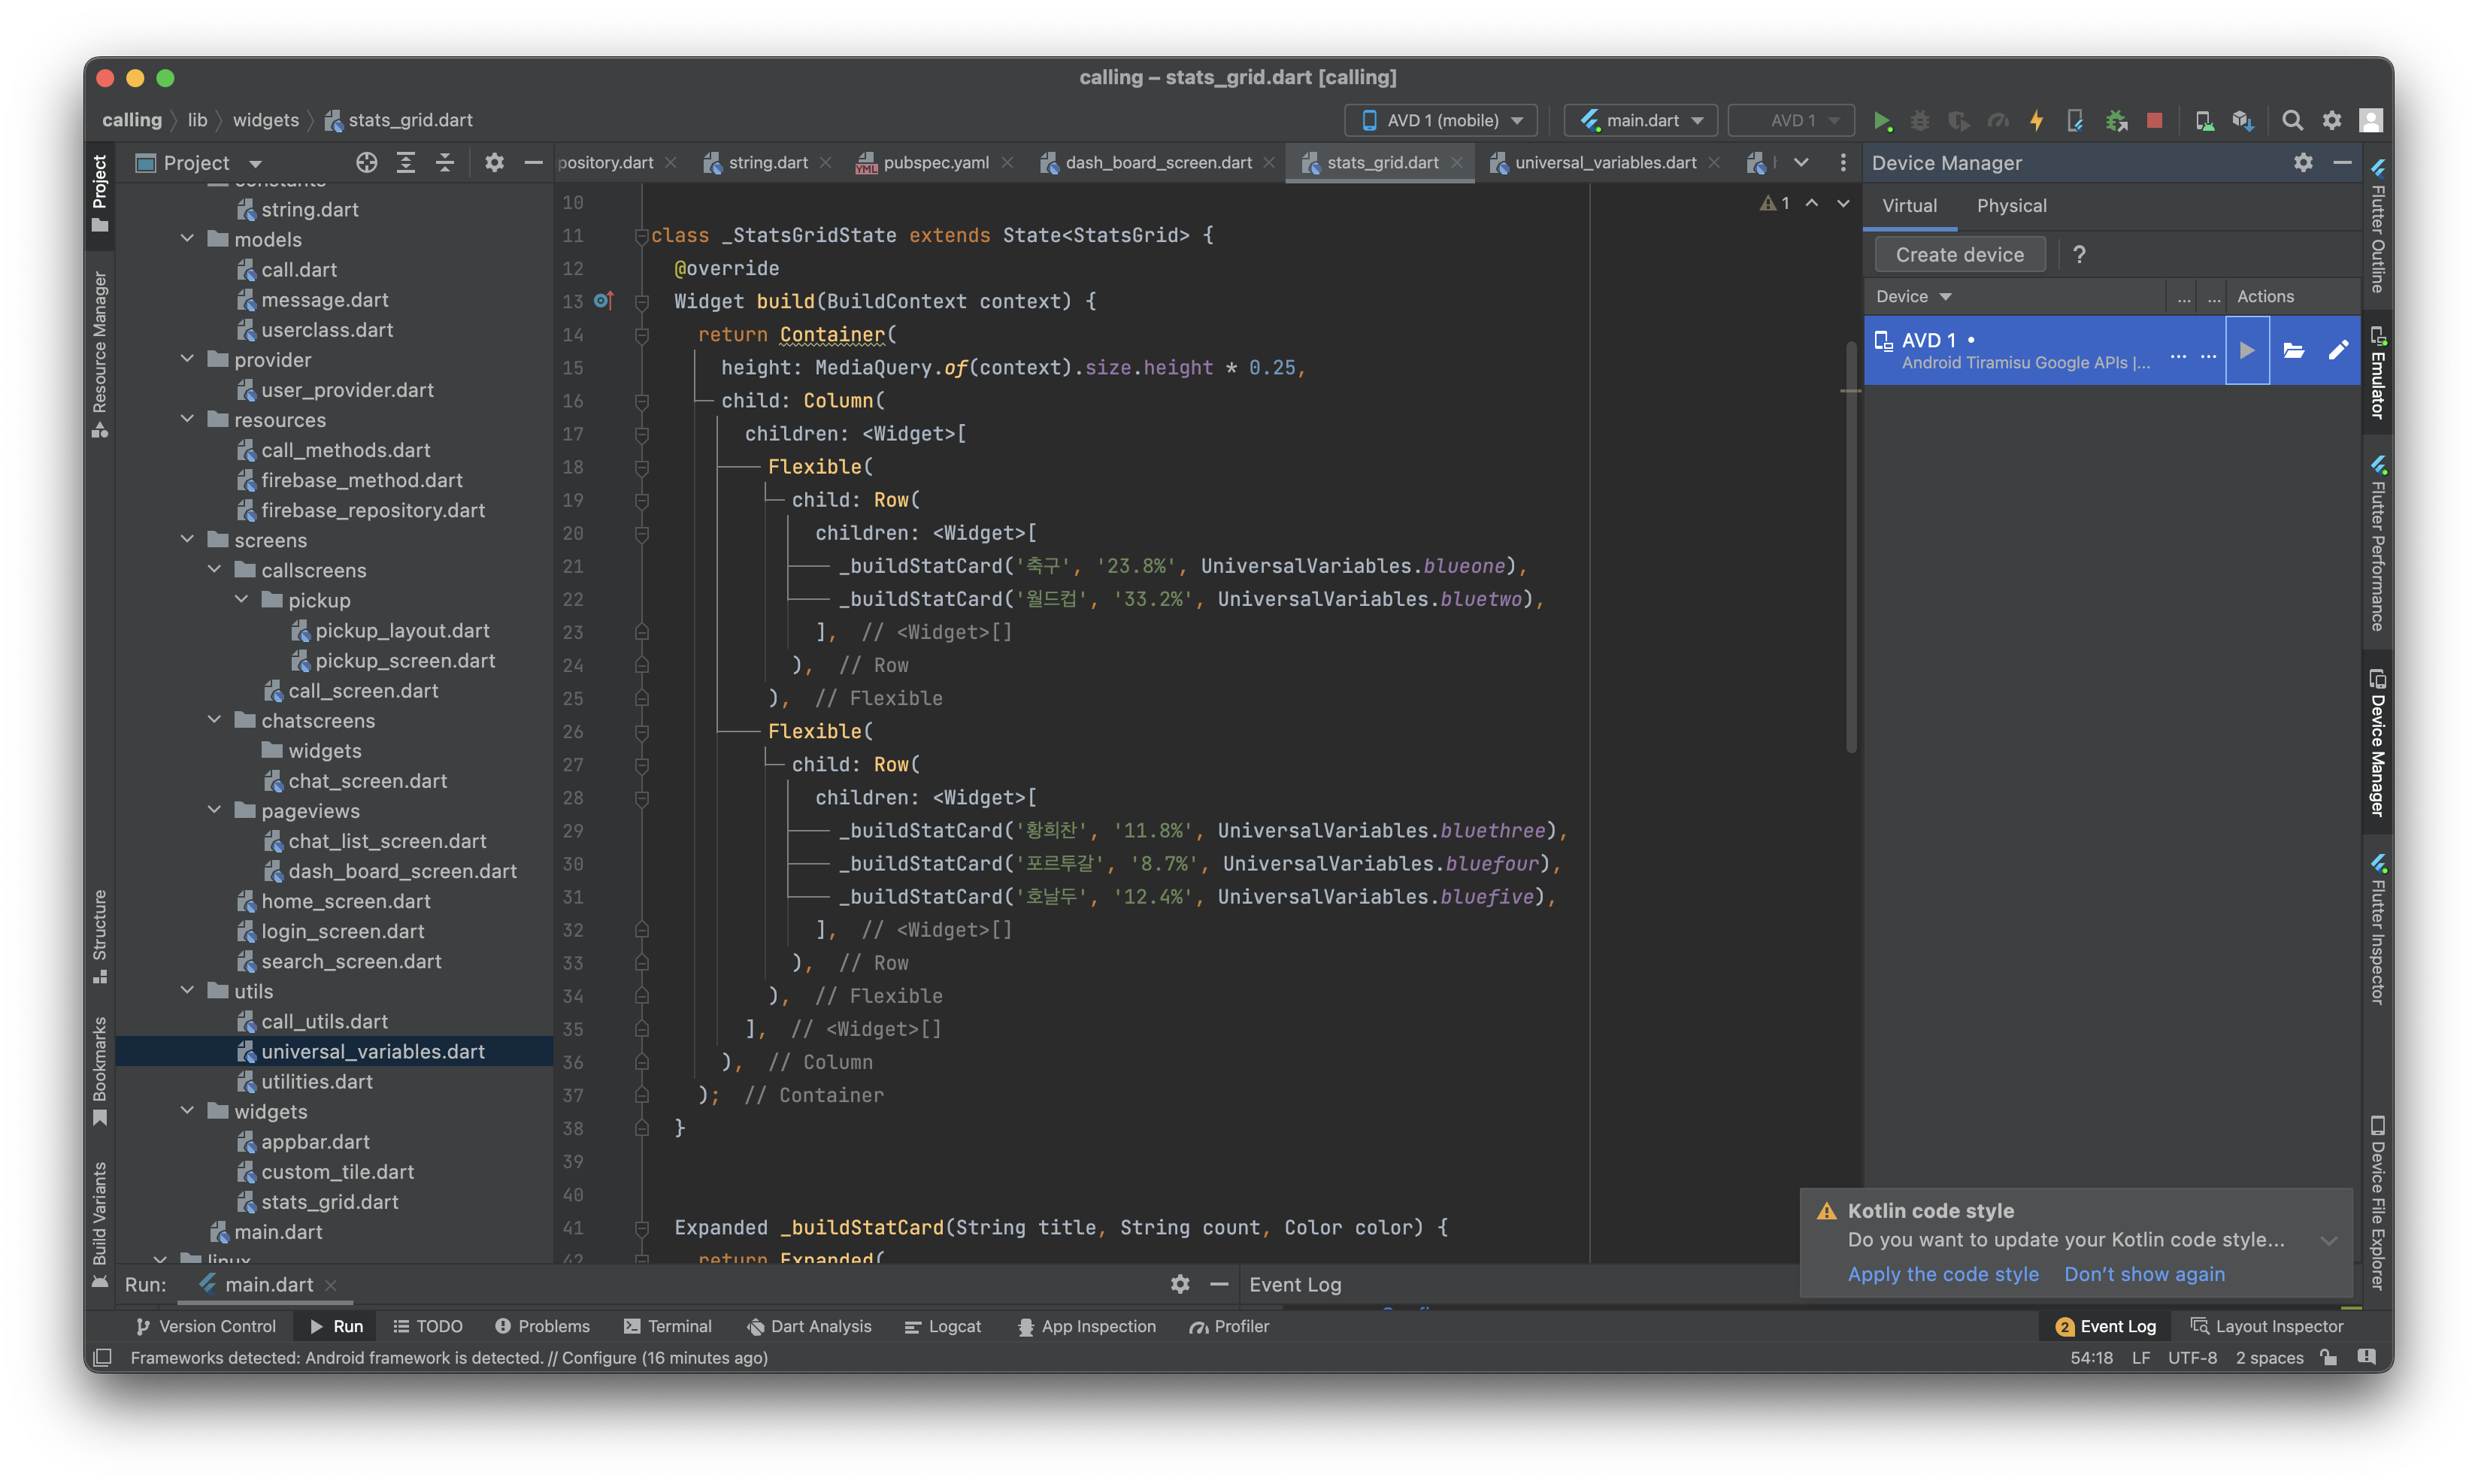
class _StatsGridState extends State<StatsGrid> { Widget build(BuildContext context) { return Container( height: MediaQuery.of(context).size.height * 0.25, child: Column( children: <Widget>[ Flexible( child: Row( children: <Widget>[ _buildStatCard('축구', '23.8%', UniversalVariables.blueone), _buildStatCard('월드컵', '33.2%', UniversalVariables.bluetwo), ], ), ), Flexible( child: Row( children: <Widget>[ _buildStatCard('황희찬', '11.8%', UniversalVariables.bluethree), _buildStatCard('포르투갈', '8.7%', UniversalVariables.bluefour), _buildStatCard('호날두', '12.4%', UniversalVariables.bluefive), ], ), ), ], ), ); }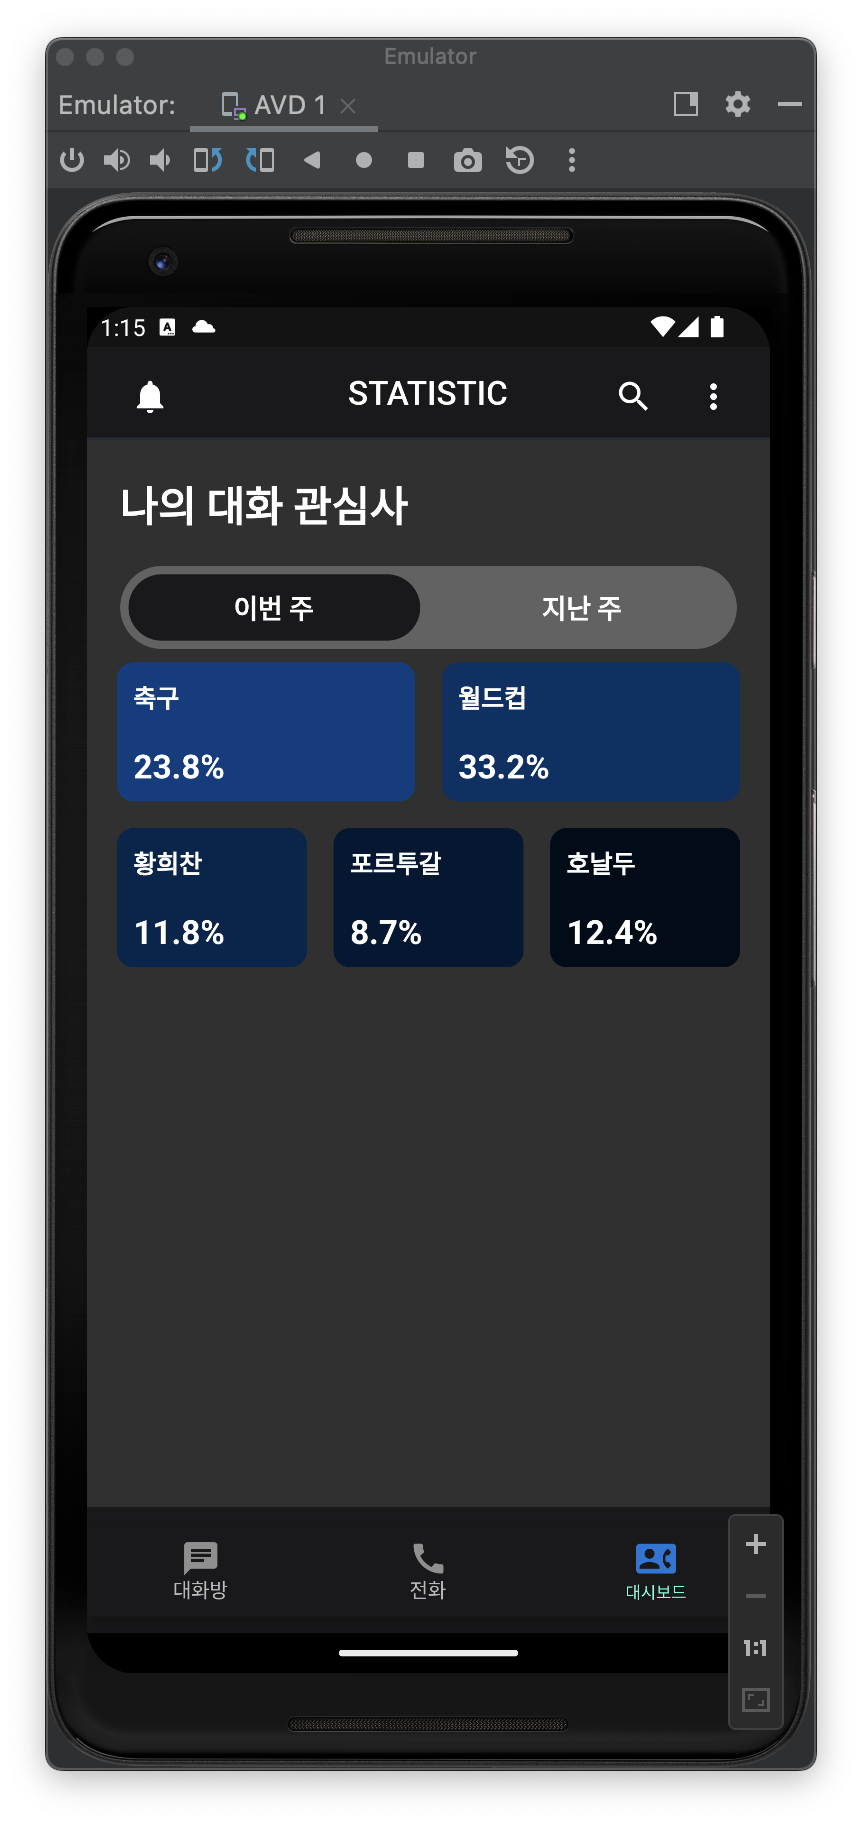
Keyword Bar Chart
-
keword bar chart를 나타내는 위젯 바디에 넣기
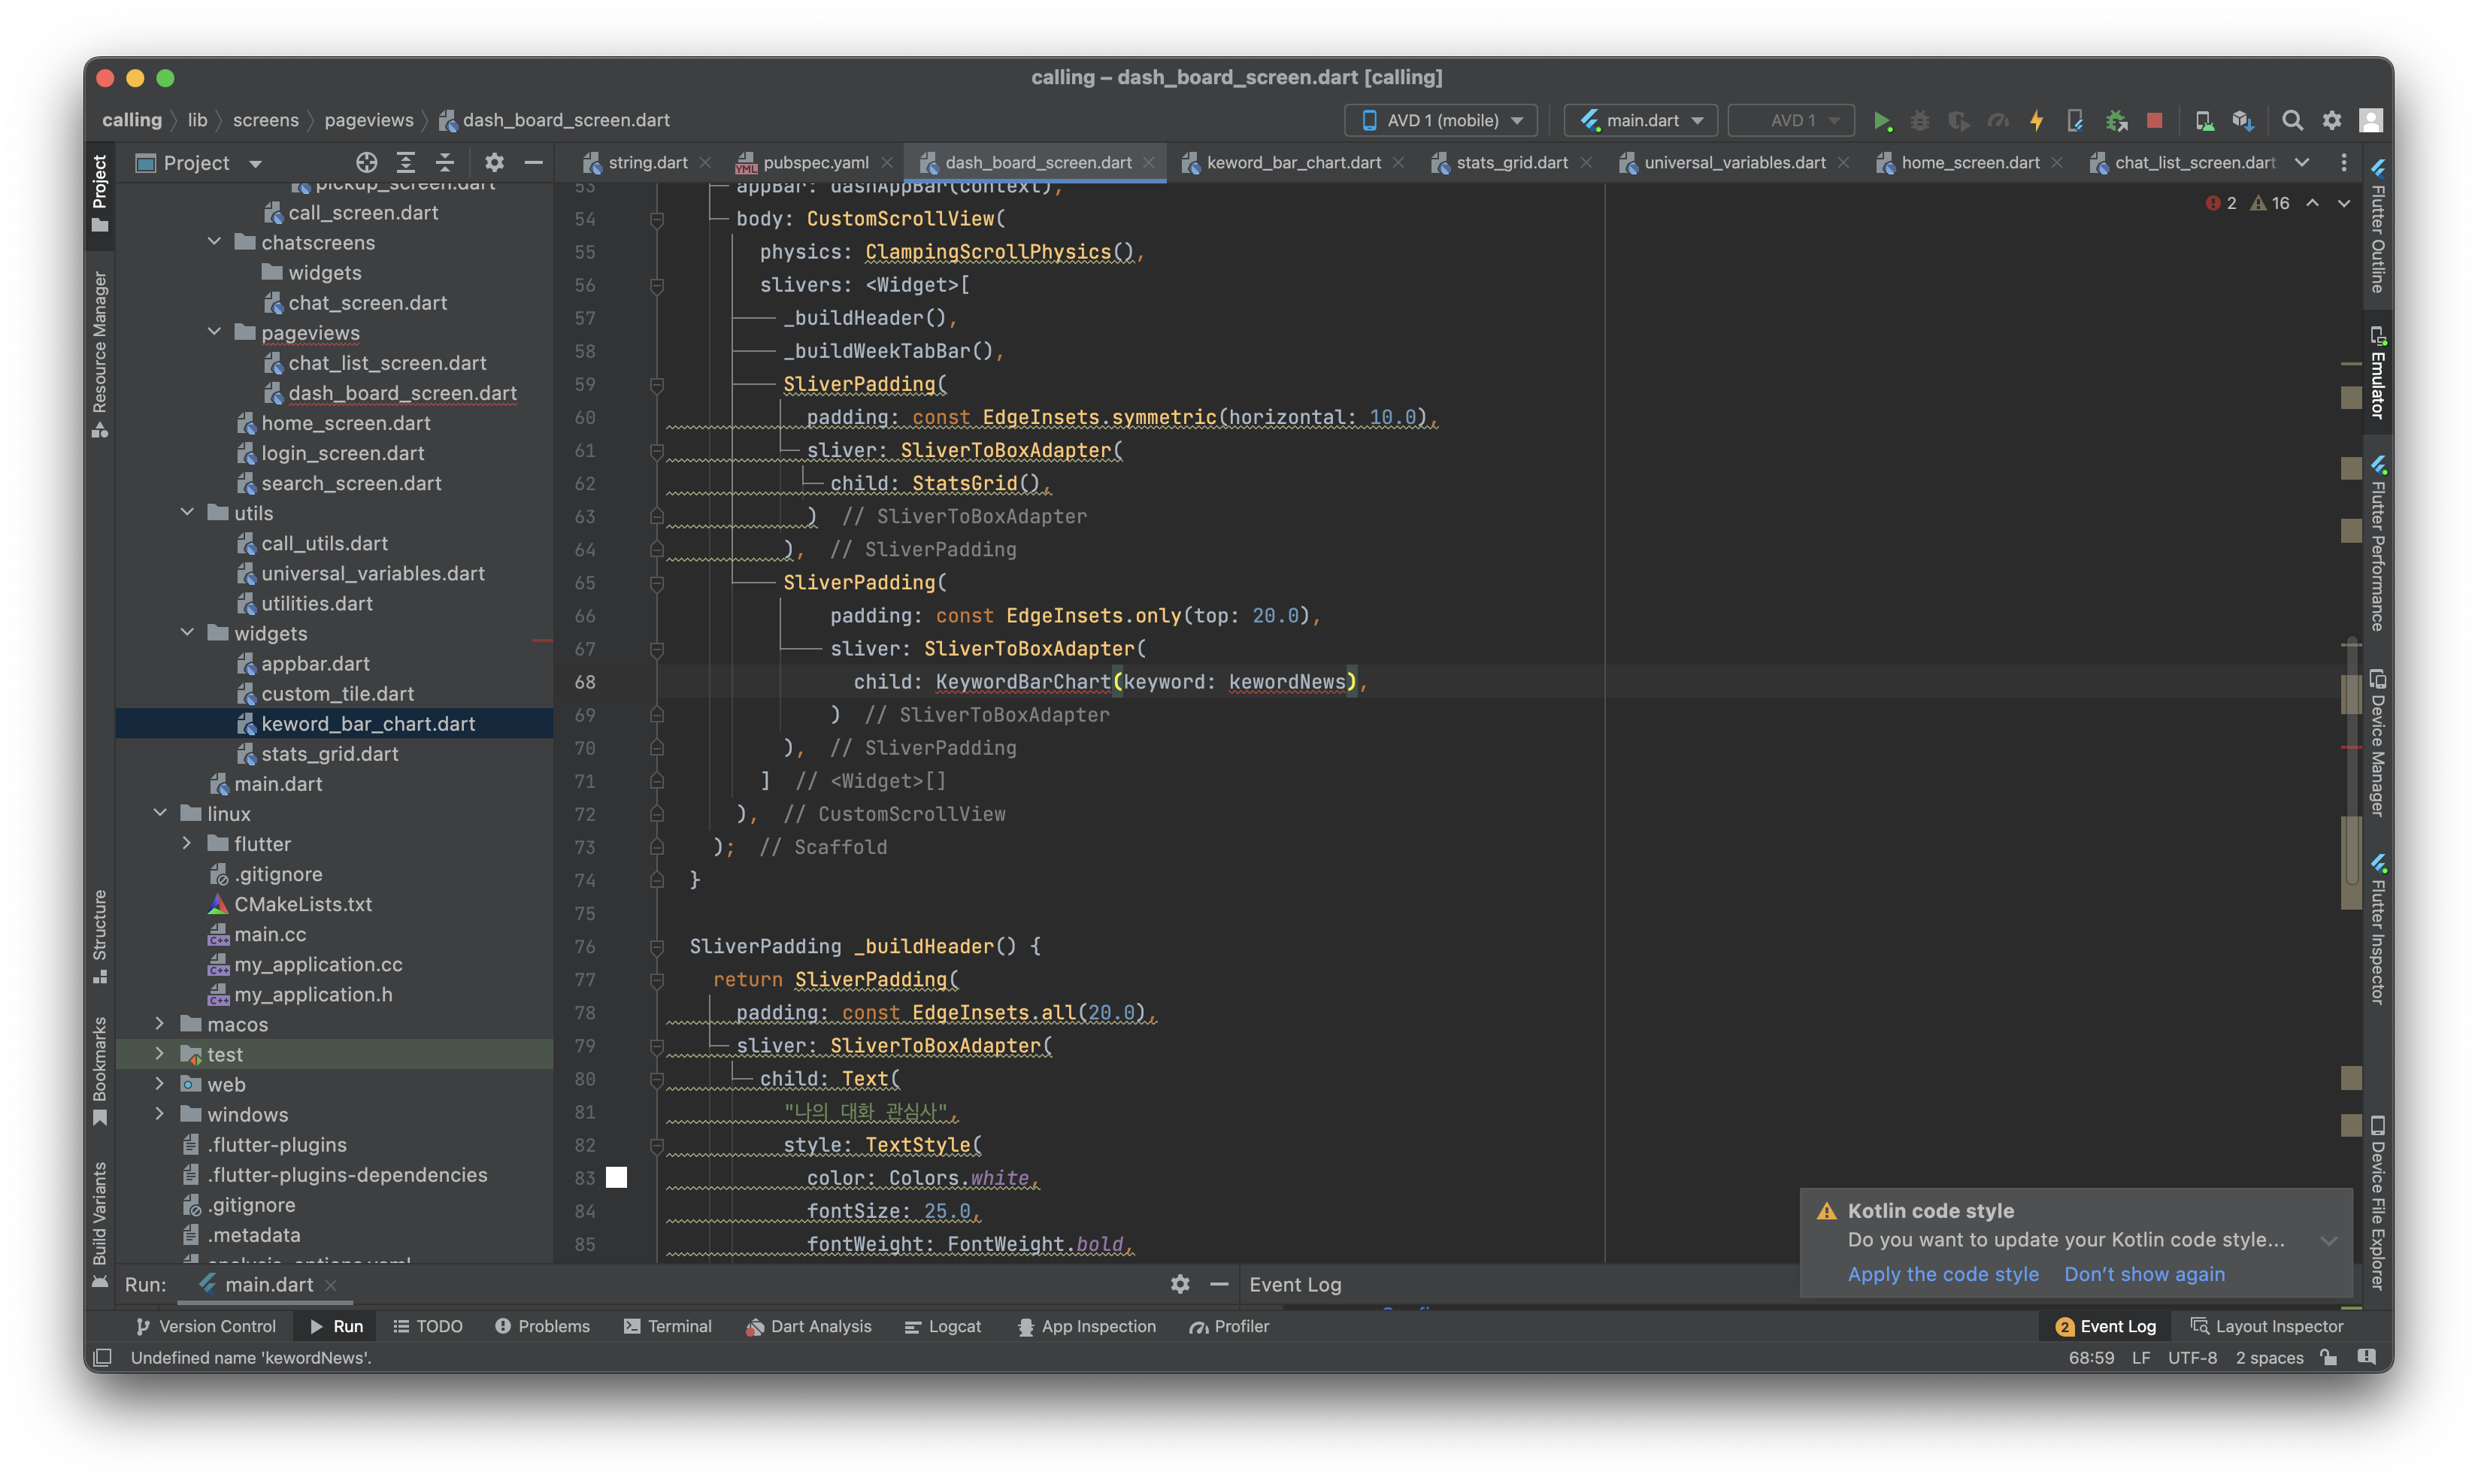
-
keyword bar chart 파일 만들어서 코드 작성
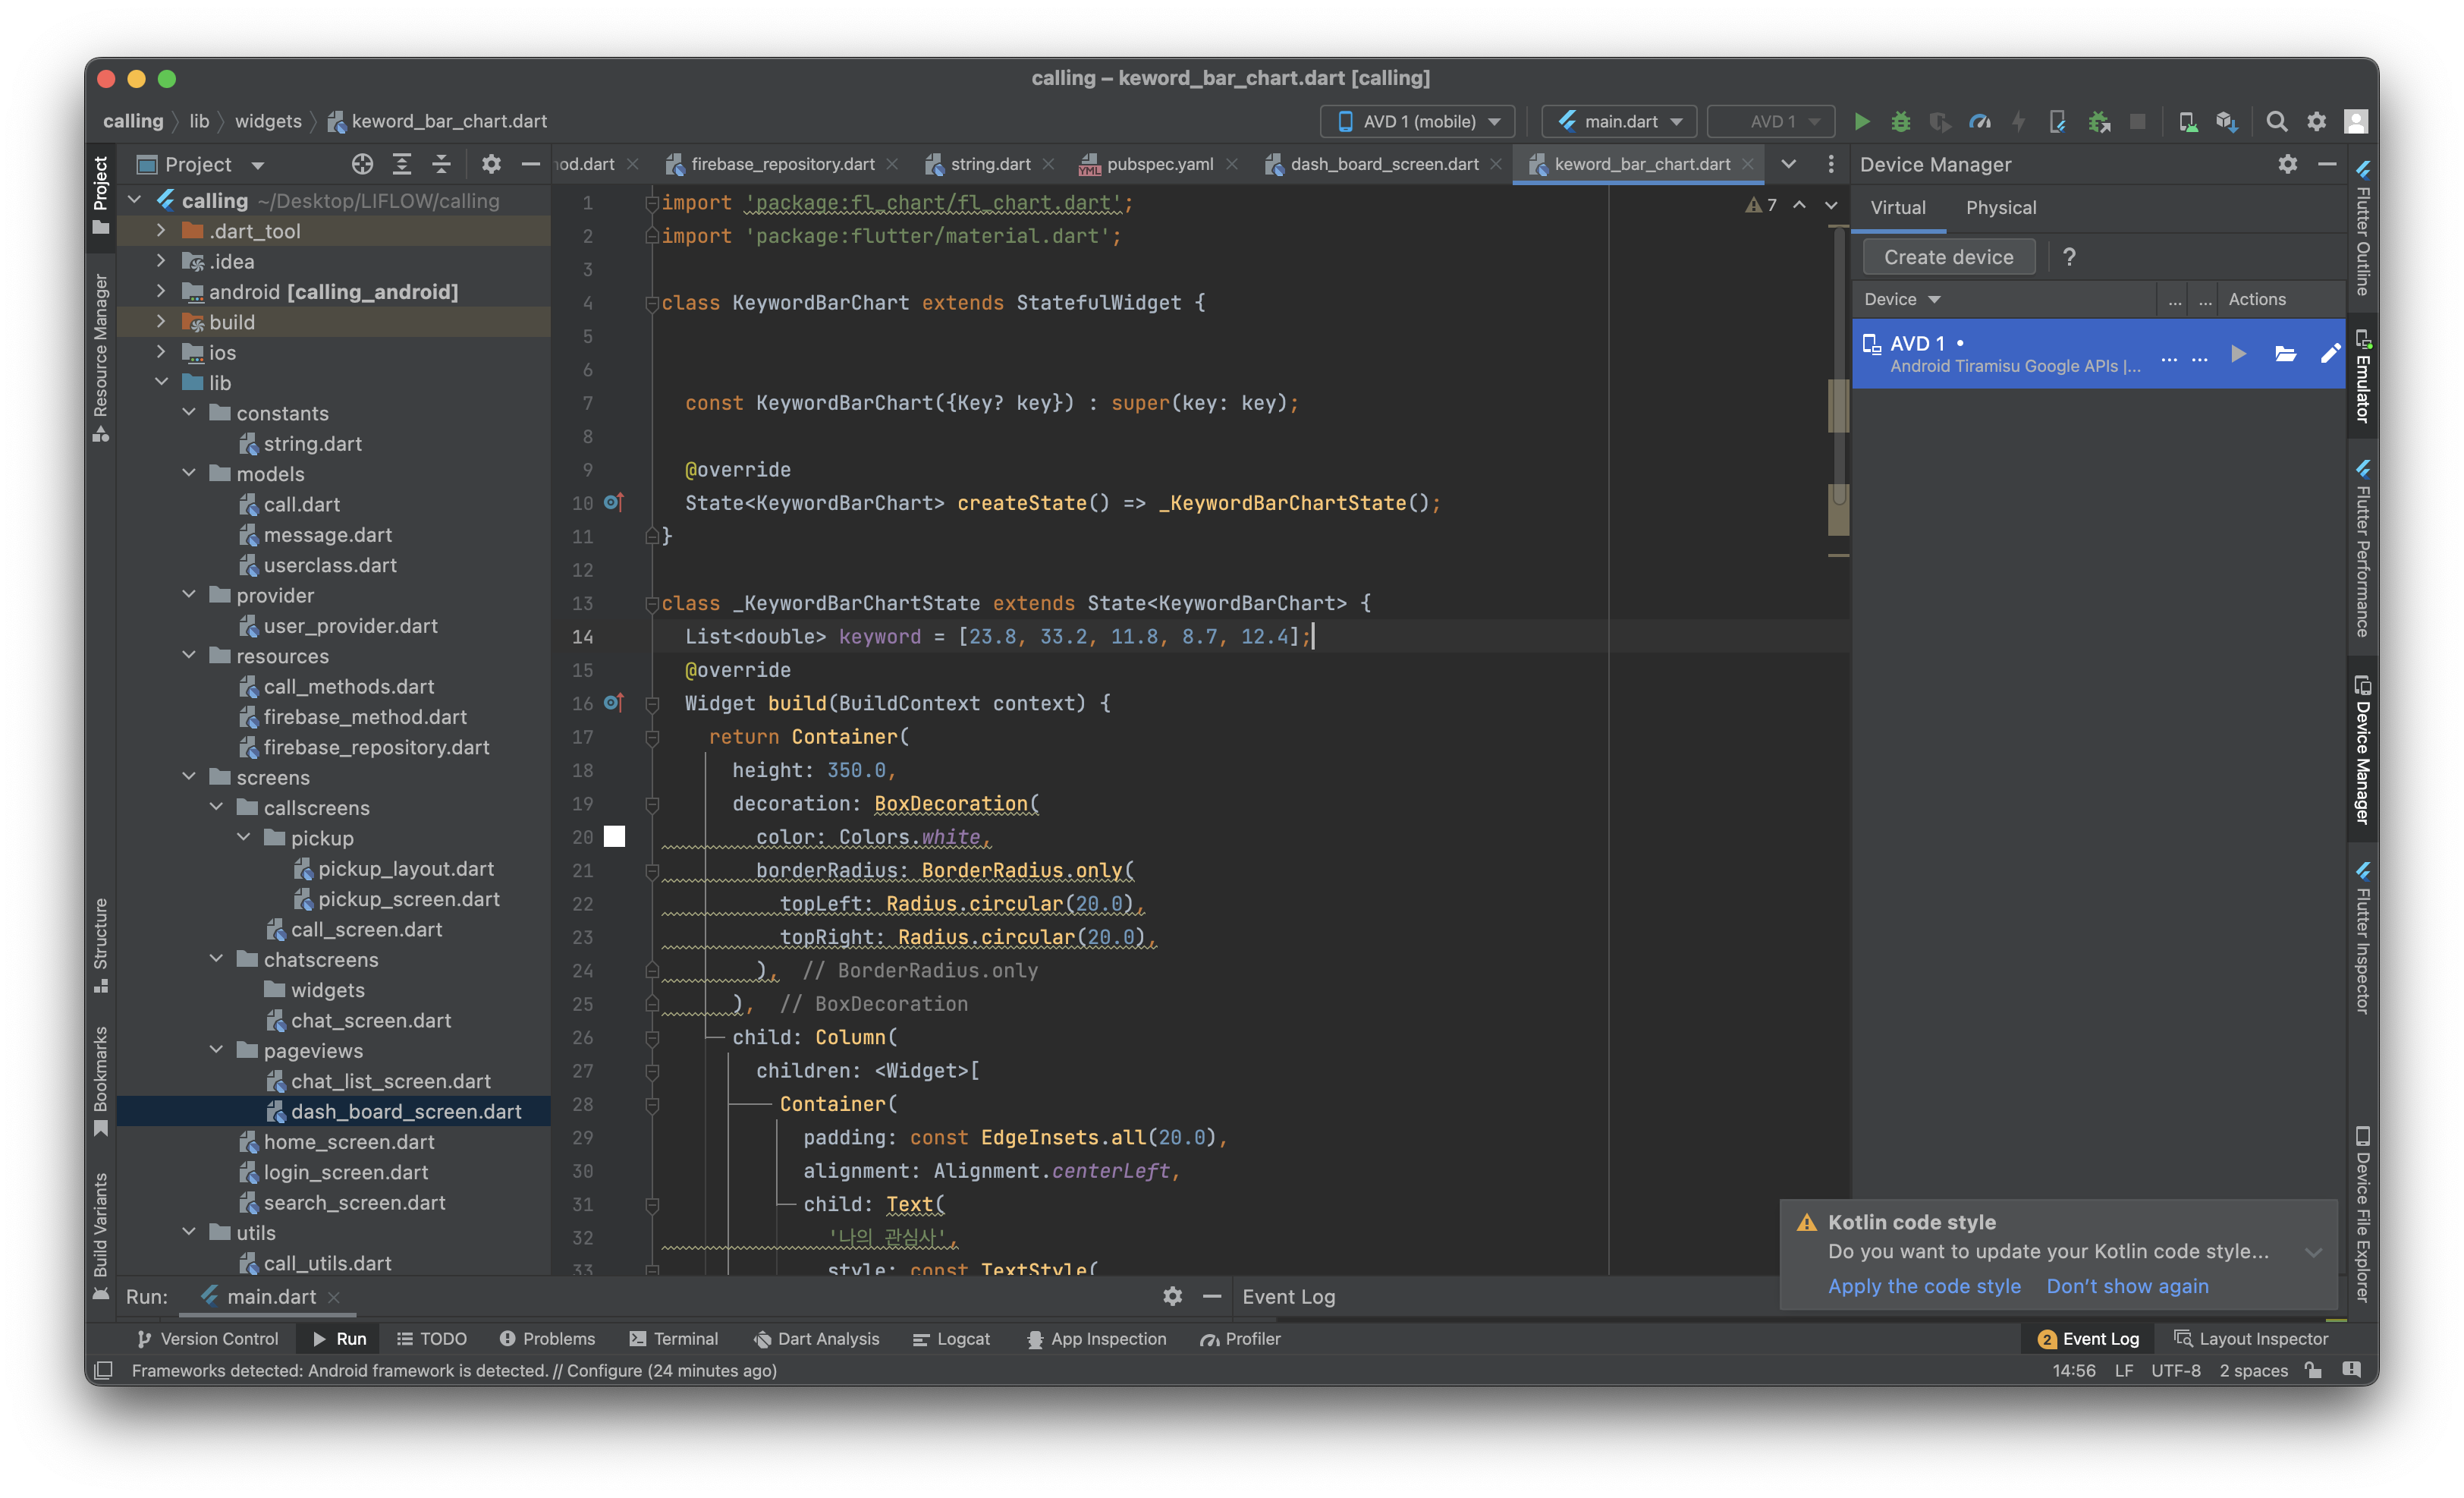
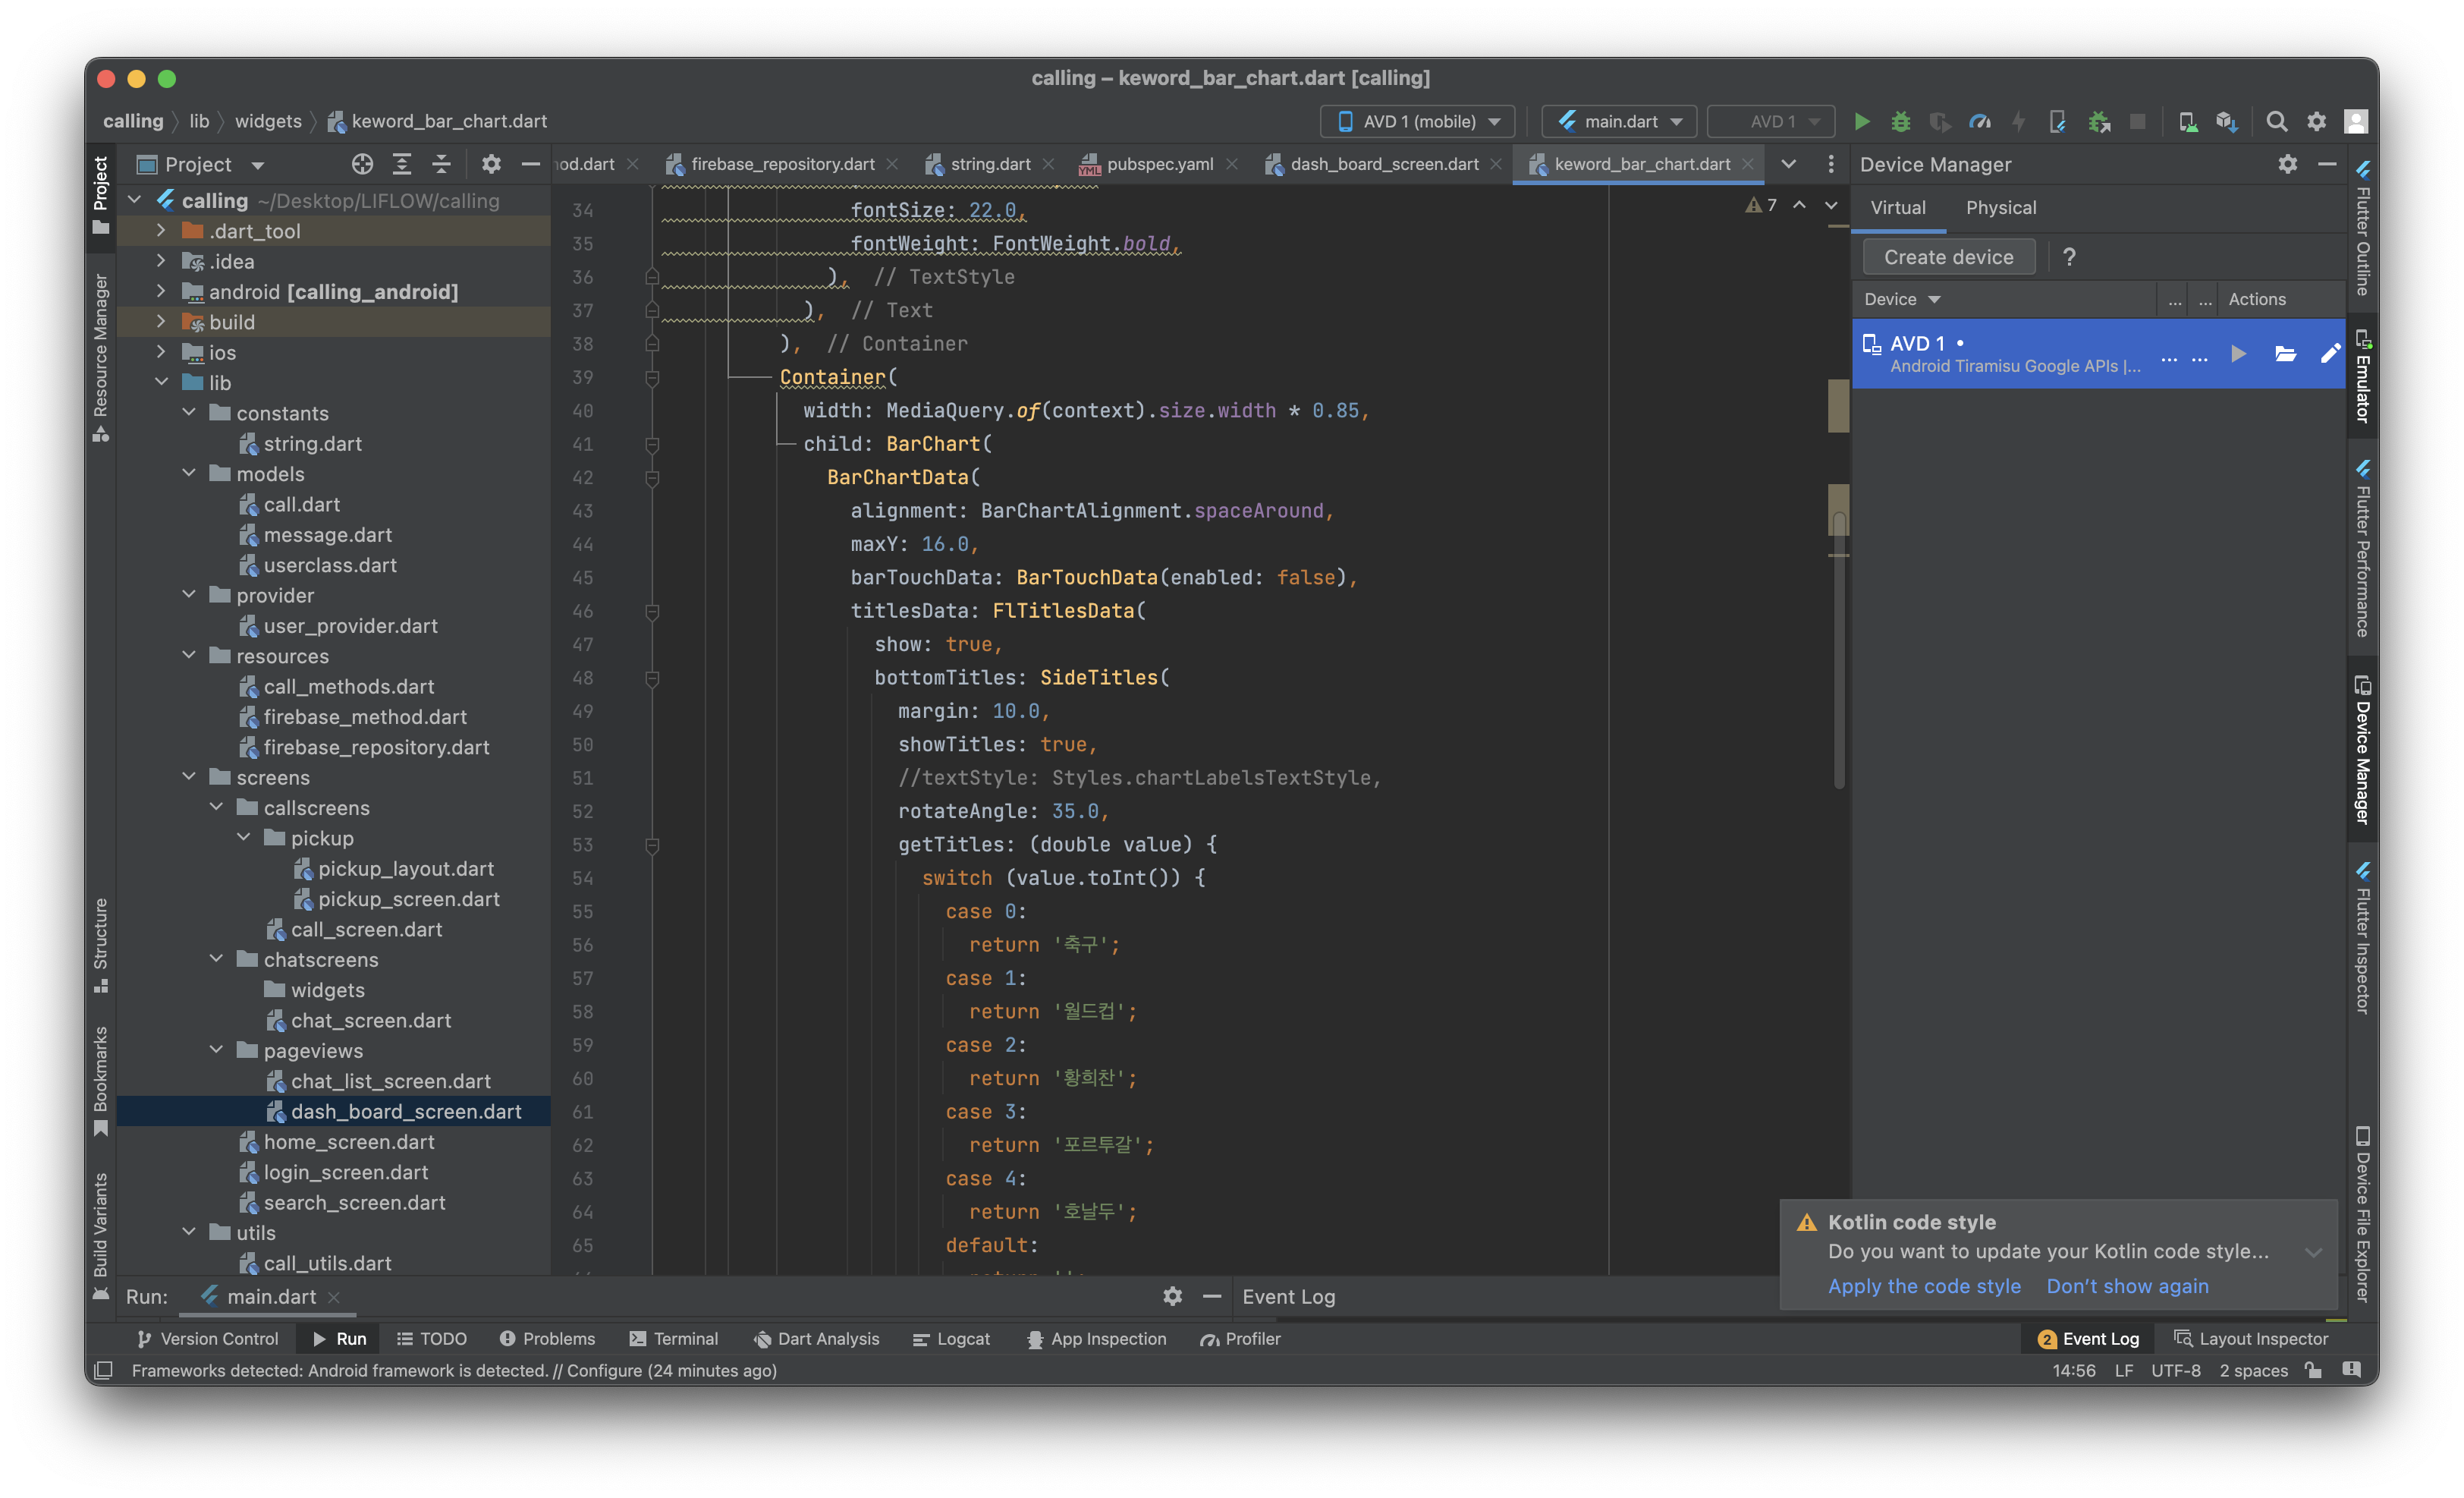
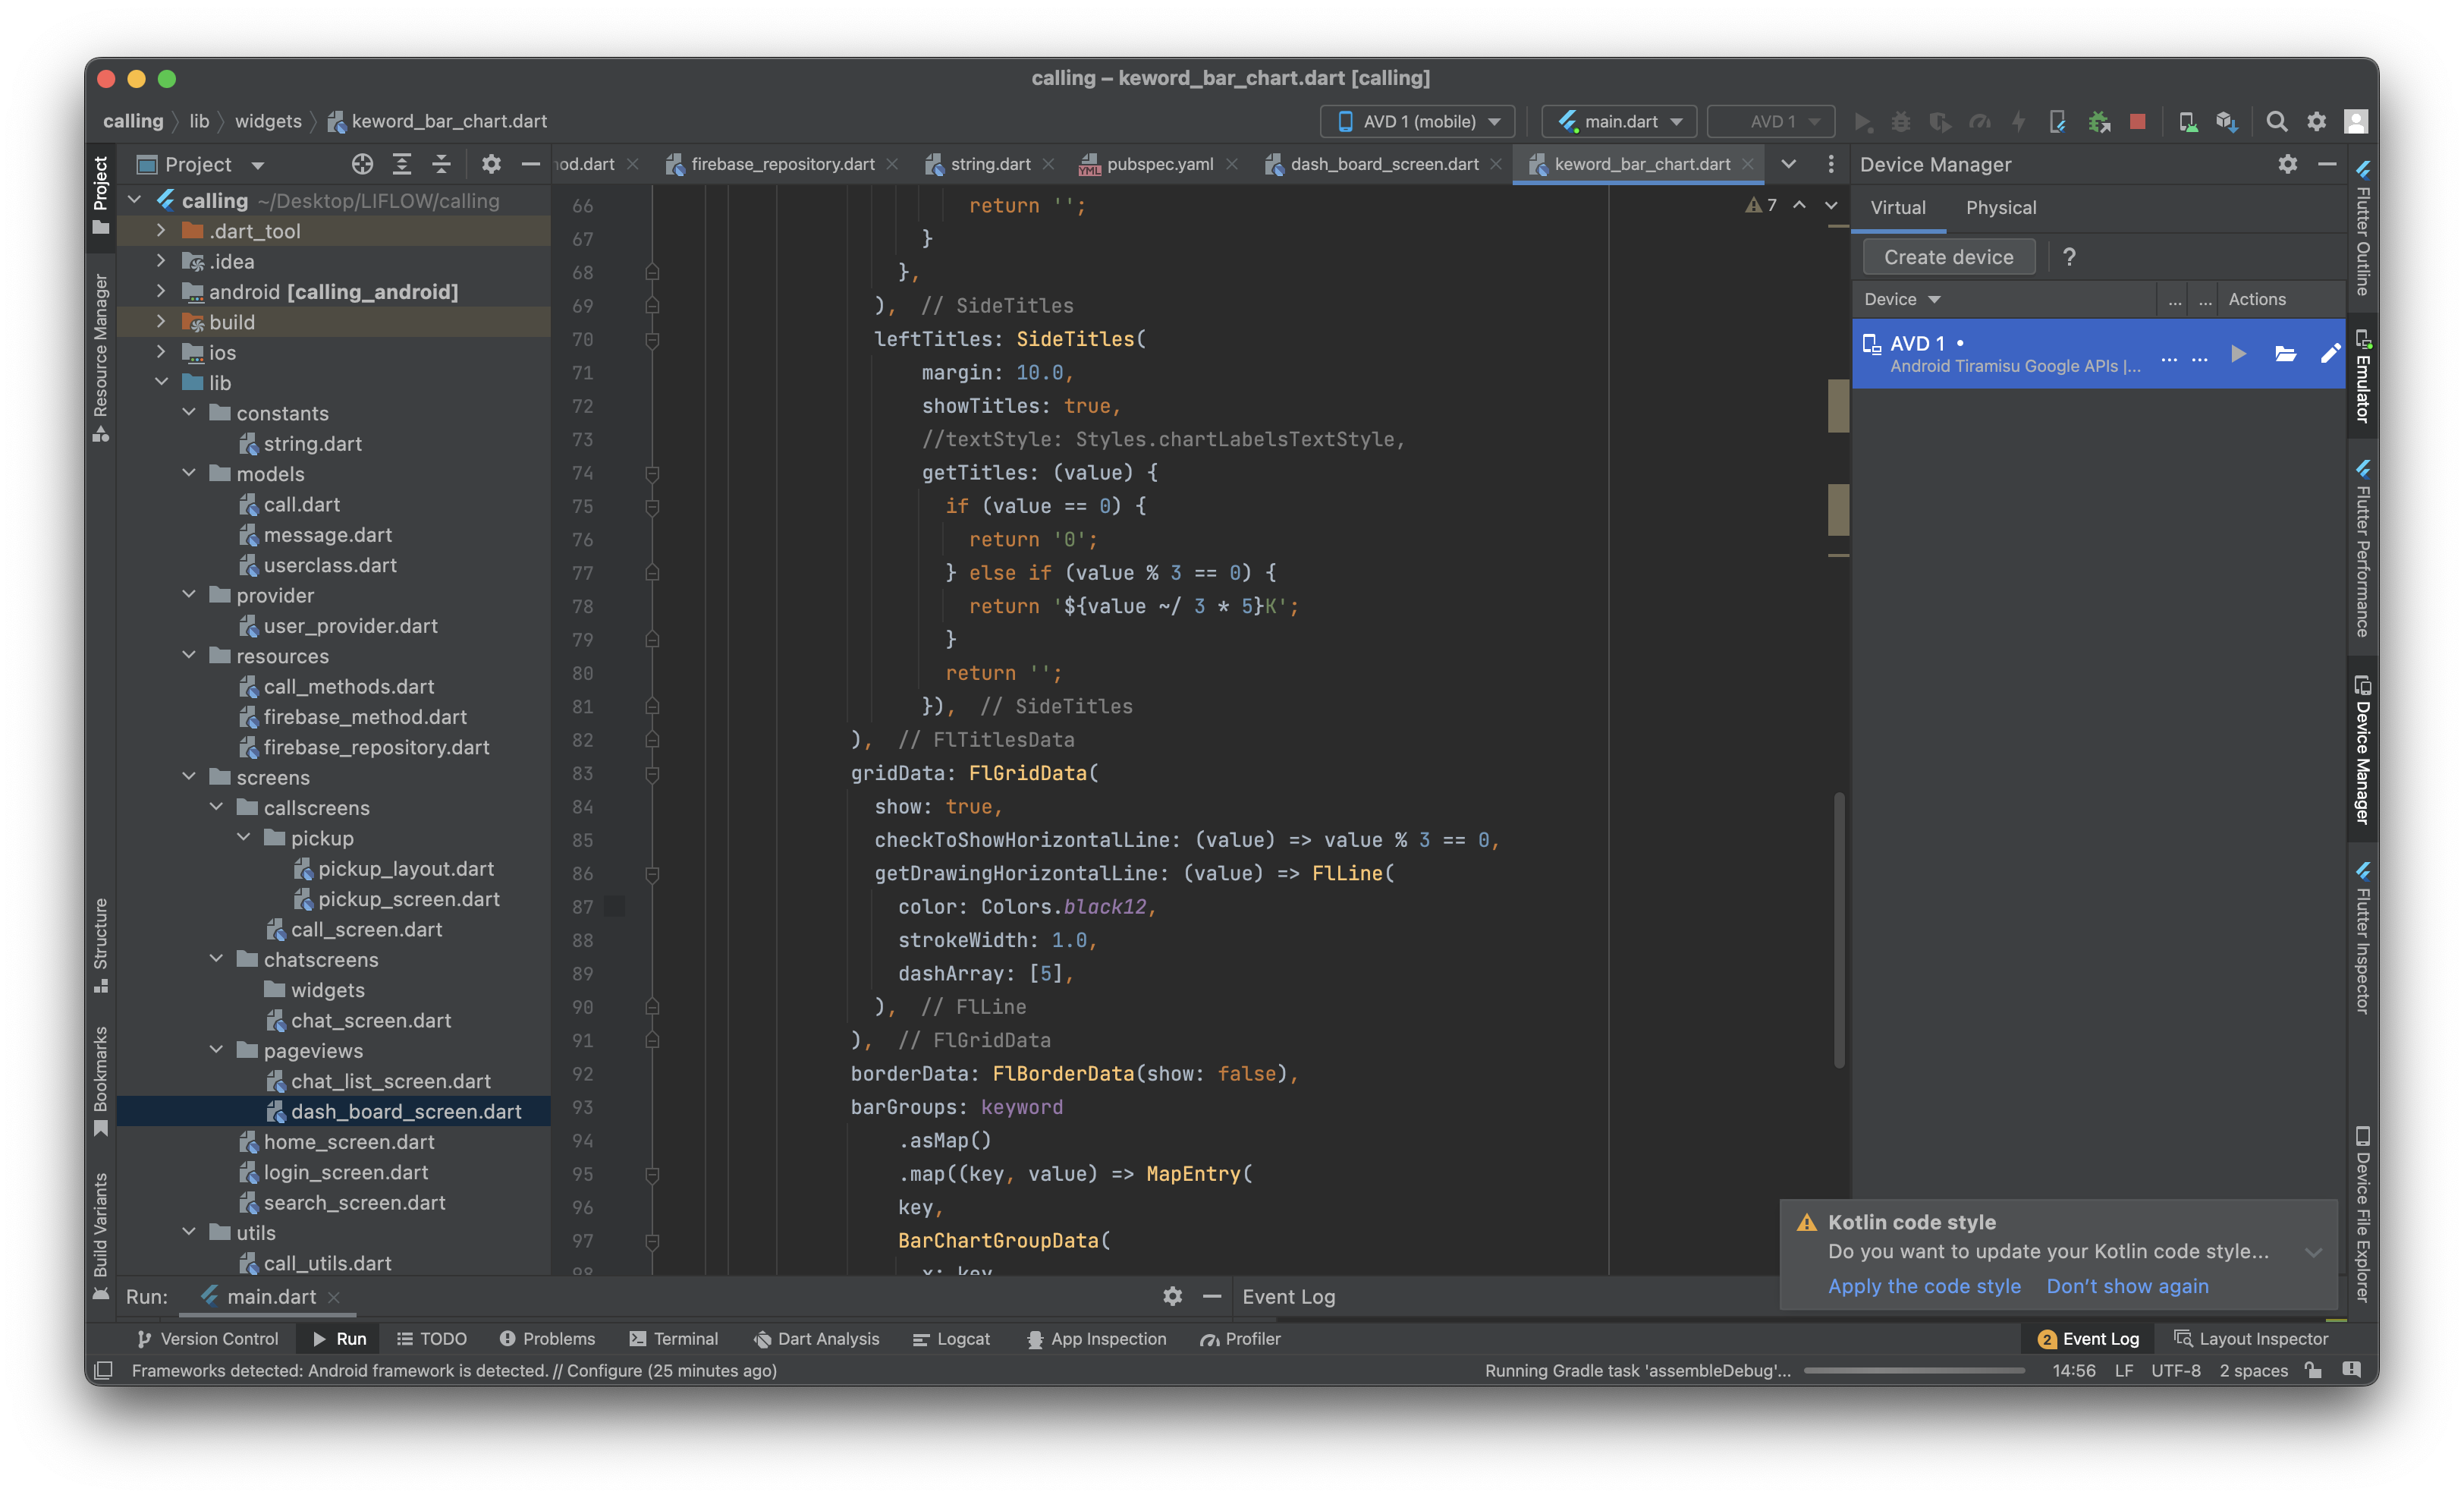
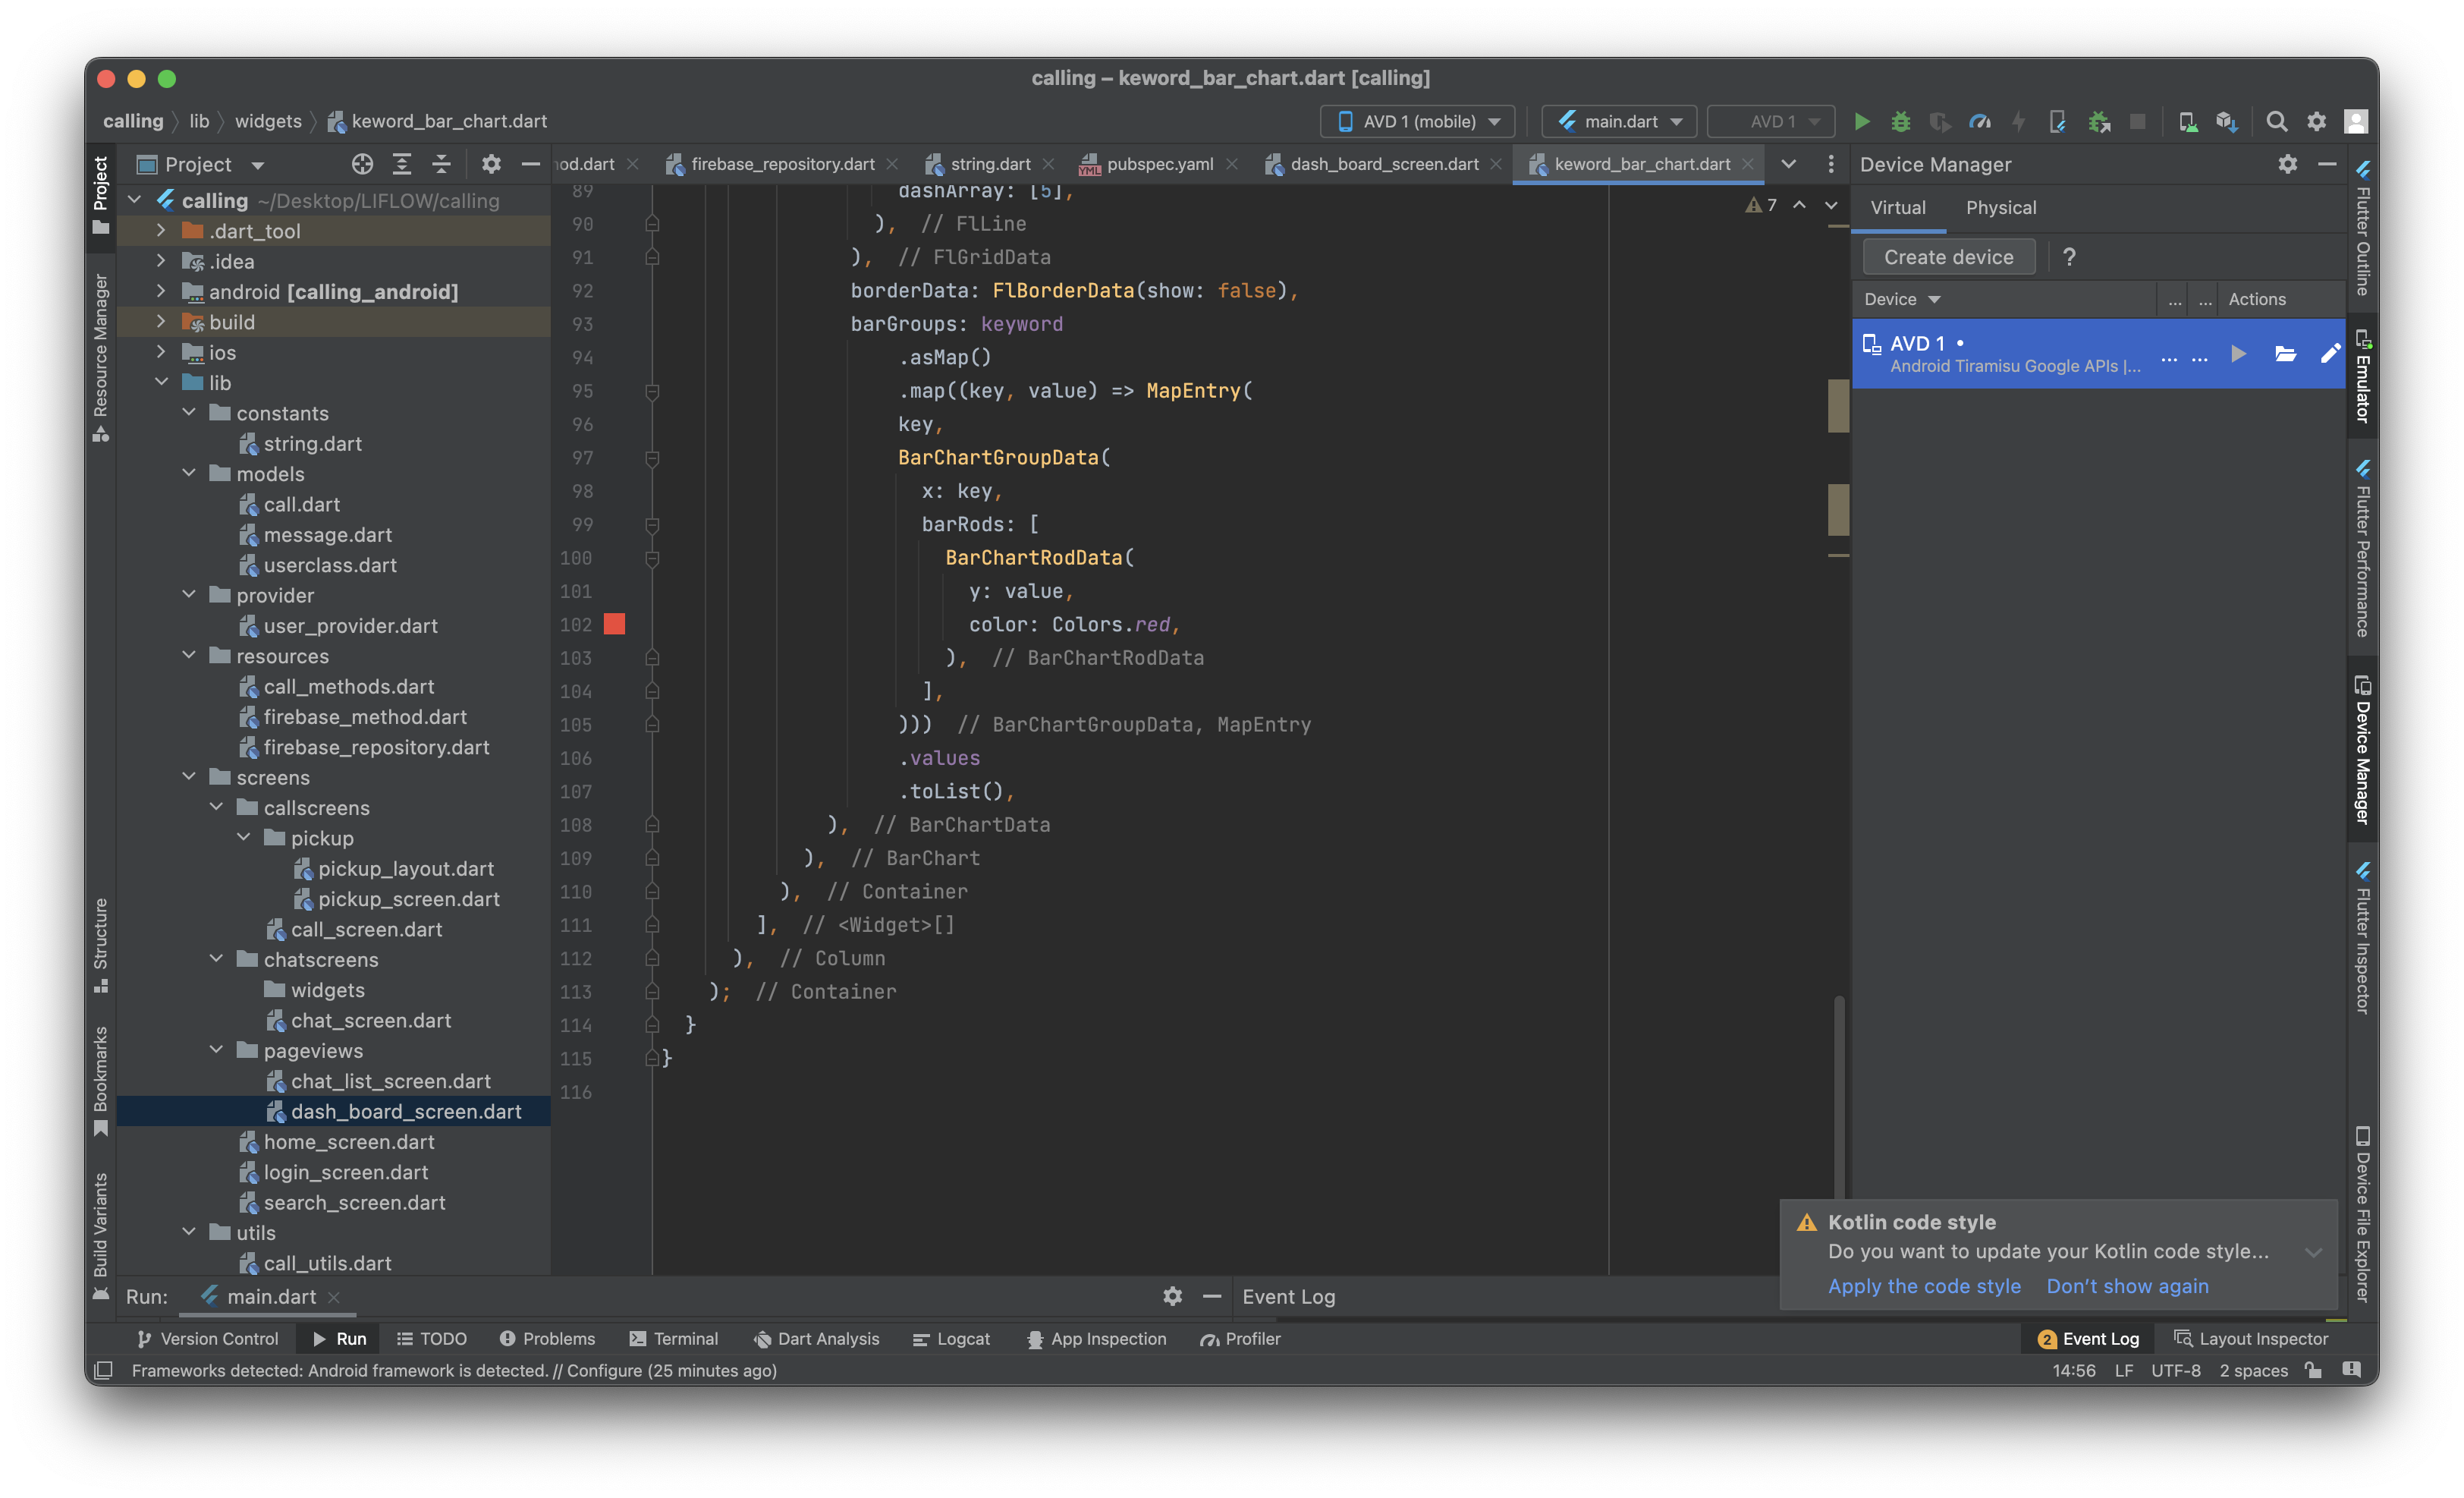
import 'package:fl_chart/fl_chart.dart'; import 'package:flutter/material.dart'; class KeywordBarChart extends StatefulWidget { const KeywordBarChart({Key? key}) : super(key: key); State<KeywordBarChart> createState() => _KeywordBarChartState(); } class _KeywordBarChartState extends State<KeywordBarChart> { List<double> keyword = [23.8, 33.2, 11.8, 8.7, 12.4]; Widget build(BuildContext context) { return Container( height: 350.0, decoration: BoxDecoration( color: Colors.white, borderRadius: BorderRadius.only( topLeft: Radius.circular(20.0), topRight: Radius.circular(20.0), ), ), child: Column( children: <Widget>[ Container( padding: const EdgeInsets.all(20.0), alignment: Alignment.centerLeft, child: Text( '나의 관심사', style: const TextStyle( fontSize: 22.0, fontWeight: FontWeight.bold, ), ), ), Container( width: MediaQuery.of(context).size.width * 0.85, child: BarChart( BarChartData( alignment: BarChartAlignment.spaceAround, maxY: 16.0, barTouchData: BarTouchData(enabled: false), titlesData: FlTitlesData( show: true, bottomTitles: SideTitles( margin: 10.0, showTitles: true, //textStyle: Styles.chartLabelsTextStyle, rotateAngle: 35.0, getTitles: (double value) { switch (value.toInt()) { case 0: return '축구'; case 1: return '월드컵'; case 2: return '황희찬'; case 3: return '포르투갈'; case 4: return '호날두'; default: return ''; } }, ), leftTitles: SideTitles( margin: 10.0, showTitles: true, //textStyle: Styles.chartLabelsTextStyle, getTitles: (value) { if (value == 0) { return '0'; } else if (value % 3 == 0) { return '${value ~/ 3 * 5}K'; } return ''; }), ), gridData: FlGridData( show: true, checkToShowHorizontalLine: (value) => value % 3 == 0, getDrawingHorizontalLine: (value) => FlLine( color: Colors.black12, strokeWidth: 1.0, dashArray: [5], ), ), borderData: FlBorderData(show: false), barGroups: keyword .asMap() .map((key, value) => MapEntry( key, BarChartGroupData( x: key, barRods: [ BarChartRodData( y: value, color: Colors.red, ), ], ))) .values .toList(), ), ), ), ], ), ); } }