프로메테우스란?
프로메테우스는 현재 돌아가는 서버 cpu 사용량, ram 사용량, 프로세스 사용량 등의 여러가지 메트릭스들을 수집하는 것을 도와주는 오픈소스 툴입니다.
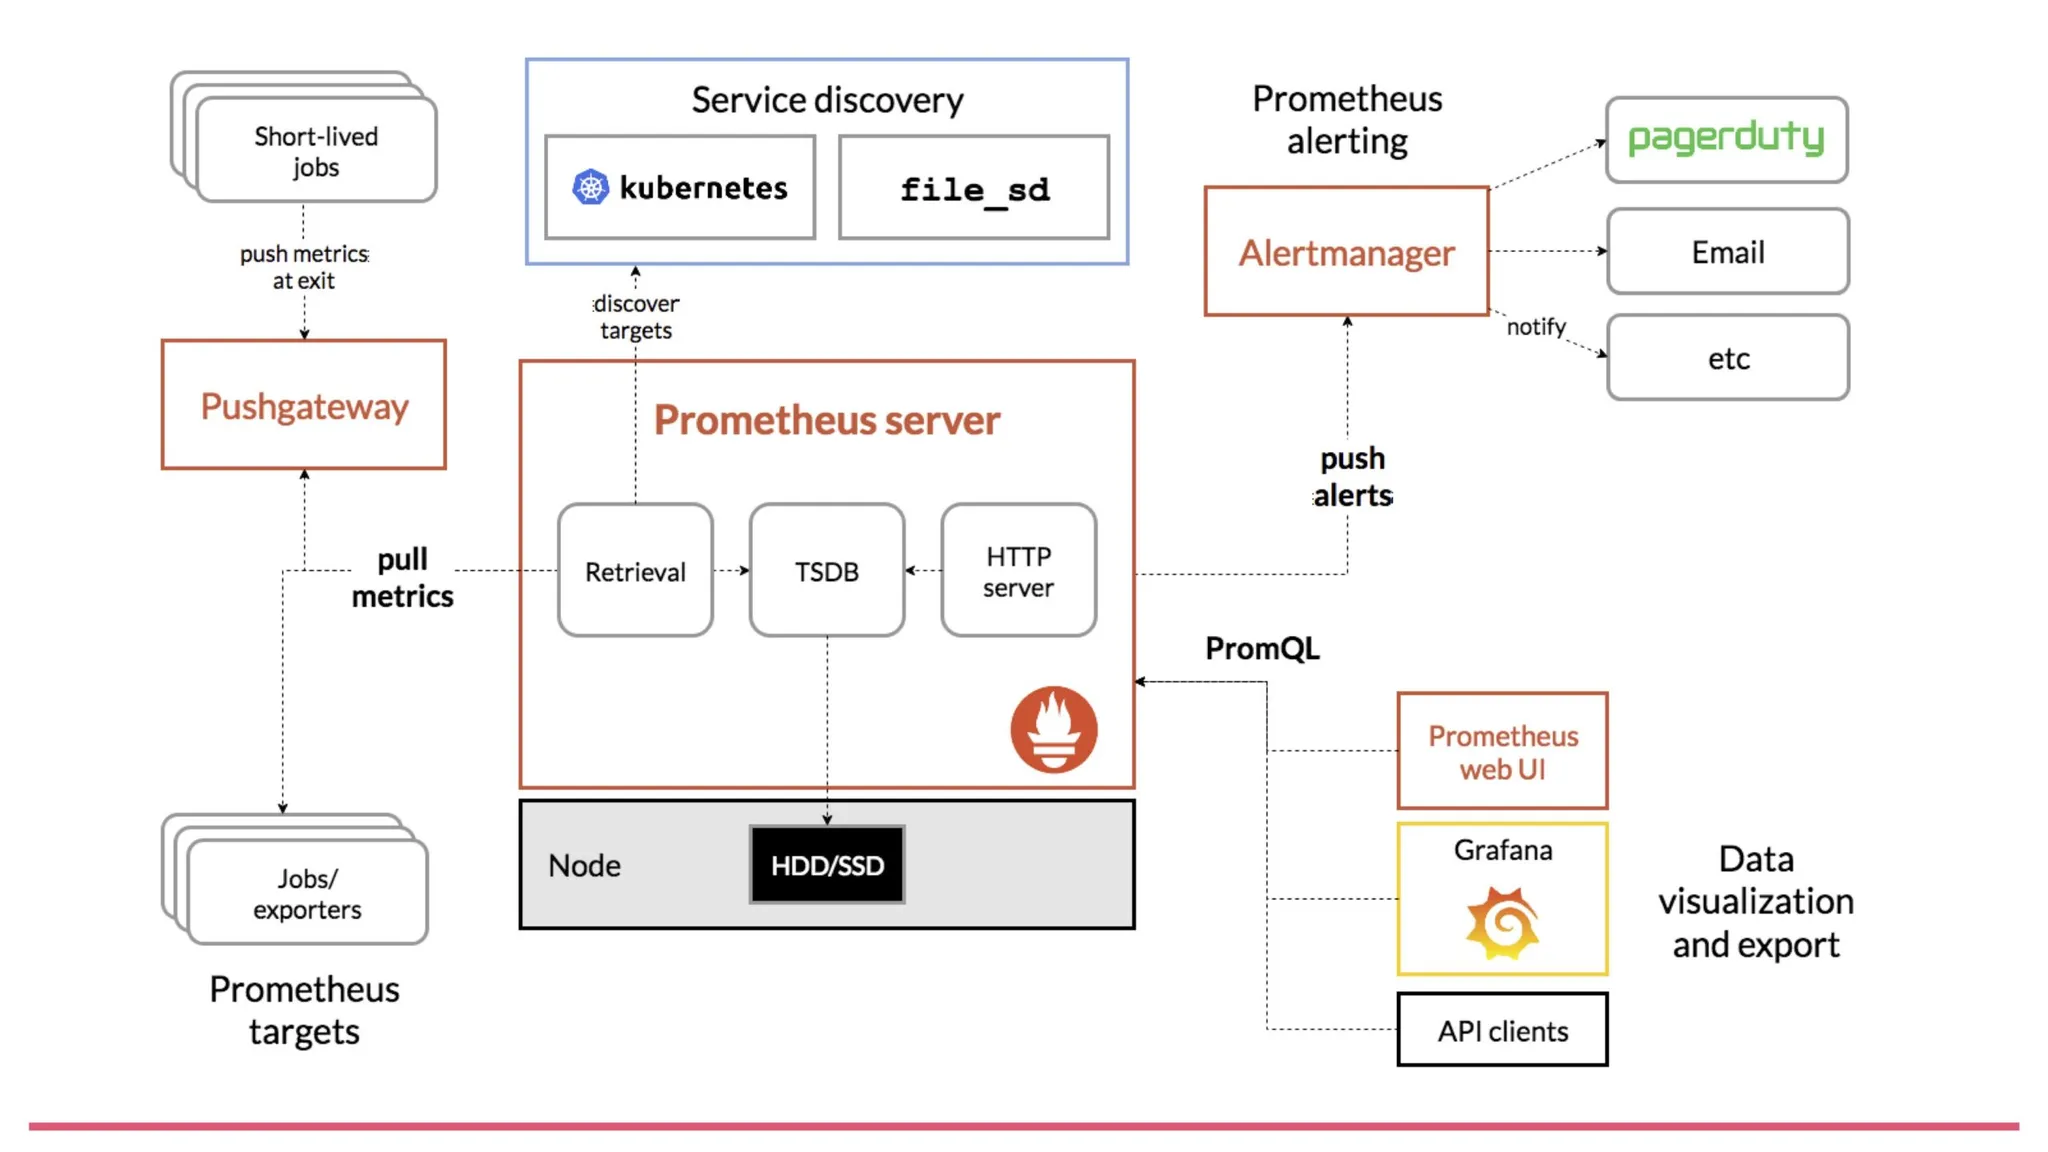
아키텍쳐 및 기능
- Prometheus Server
- 일반적으로 우리가 프로메테우스 라고 불리는 그 녀석의 본체입니다
- 어디서 모니터링 해올건지 target을 정하고(Service Discovery→ 각 툴에서 모니터링 할 대상을 자동으로 탐지 해주는 것)
- 현재는 일일히 모든 api입력했지만→ yml파일을 통해서 Service Discovery를 통해서 자동으로 탐지가 가능합니다
- 모니터링 대상의 metrics를 pull해오고(Retrieval)
- 쿼리문을 통해서 경고를 push합니다
- 여기서의 metrics 정보를 통해서 Grafana등의 시각화 툴로 이동됩니다
- Exporter
- exporter를 통해서 실제 metrics들을 가져옵니다
- Prometheus Server에서 metrics들을 일일히 각 규격에 맞게 가져오려면 꽤나 번거롭기 때문이죠.
- AlertManager
- AlertManager는 Prometheus에서 수집된 메트릭을 기반으로 경고(Alert)를 관리하고, 알림을 전송하는 도구입니다
- ex) cpu 사용량이 90퍼이상이야~네트워크 트래픽이 ~퍼 이상이야 서버 다운 되겠어~
- 이 AlretManger도 prometheus와 마찬가지로 yml파일로 어떤 상황일 때, 경고를 할 지를 정합니다
- 프로메테우스 내에 없는게 아쉽지만, 대신에 yml파일 내의 설정을 통해서 경고가 slack등의 다양한 알림 체널에 전송되게 설정이 가능하다고합니다.
   receivers:
     - name: 'slack_notifications'
       slack_configs:
         - api_url: 'https://hooks.slack.com/services/your/slack/webhook'
           channel: '#alerts'
           send_resolved: true
Grafana란?
Grafana는 위에서 prometheus로 부터 받은 메트릭스정보를 보기 쉽게 정리해줍니다
-
Grafana에서는 위처럼 보기 편한 대시보드를 제공하기 때문에, 시각적으로 훨씬 눈에 잘 보입니다
-
쿼리문을 통해서 정보를 가져올 수도 있는데, 쿼리문이 엄청 직관적이라 쓰기가 편한듯?
-
참고로 위의 그라파나 대시보드는 그라파나 랩이라는 대시보드를 모아둔 저장소에 있습니다
-
PromQL을 통해서 정보를 Grafana는 받습니다.→일종의 Get방식
https://grafana.com/grafana/dashboards/1860-node-exporter-full/
Prometheus와 Grafana적용기
- 먼저 ec2에 접속을 해서 Prometheus와 Grafana 그리고 node exporter를 다운 받아줍니다.
wget https://github.com/prometheus/prometheus/releases/download/v2.54.1/prometheus-2.54.1.linux-amd64.tar.gz
tar -xvf prometheus-2.54.1.linux-amd64.tar.gz
sudo apt-get update
sudo apt-get install grafana
wget https://github.com/prometheus/node_exporter/releases/download/v1.8.2/node_exporter-1.8.2.linux-amd64.tar.gz
tar -xvf node_exporter-1.8.2.linux-amd64.tar.gz
cd node_exporter-1.8.2.linux-amd64- 그 후에 Prometheus.yml파일을 구성하는데, 여기서 다음과 같이 구성했습니다.
-
devroute-job(http://ip주소:9090/metrics**)**: Prometheus 서버 자체의 성능 및 상태를 모니터링하는 메트릭을 수집. -
devroute-server(http://ip주소:8080/actuator/prometheus): Spring Boot 애플리케이션의 상태와 성능을 모니터링하는 Actuator 메트릭을 수집. -
node(http://ip주소:9100/actuator/prometheus**)**: 서버의 하드웨어 및 운영 체제 상태(CPU, 메모리, 디스크, 네트워크 등)를 모니터링하는 메트릭을 수집.→ nodeexporter를 통해서 수집.scrape_configs: # Prometheus 자체 모니터링 (자체 메트릭 수집) - job_name: 'prometheus' static_configs: - targets: ['ip주소:9090'] # Node Exporter 모니터링 - job_name: 'node_exporter' static_configs: - targets: ['ip주소:9100'] # Node Exporter의 엔드포인트 # Spring Boot 애플리케이션 모니터링 - job_name: 'spring_boot' static_configs: - targets: ['ip주소:8080'] # Spring Boot Actuator Prometheus 엔드포인트 -
이 단계가 바로 service discovey 로 대체가 가능한 부분
-
- 그 후 prometheus, nodeexporter를 실행.Grafana를 실행
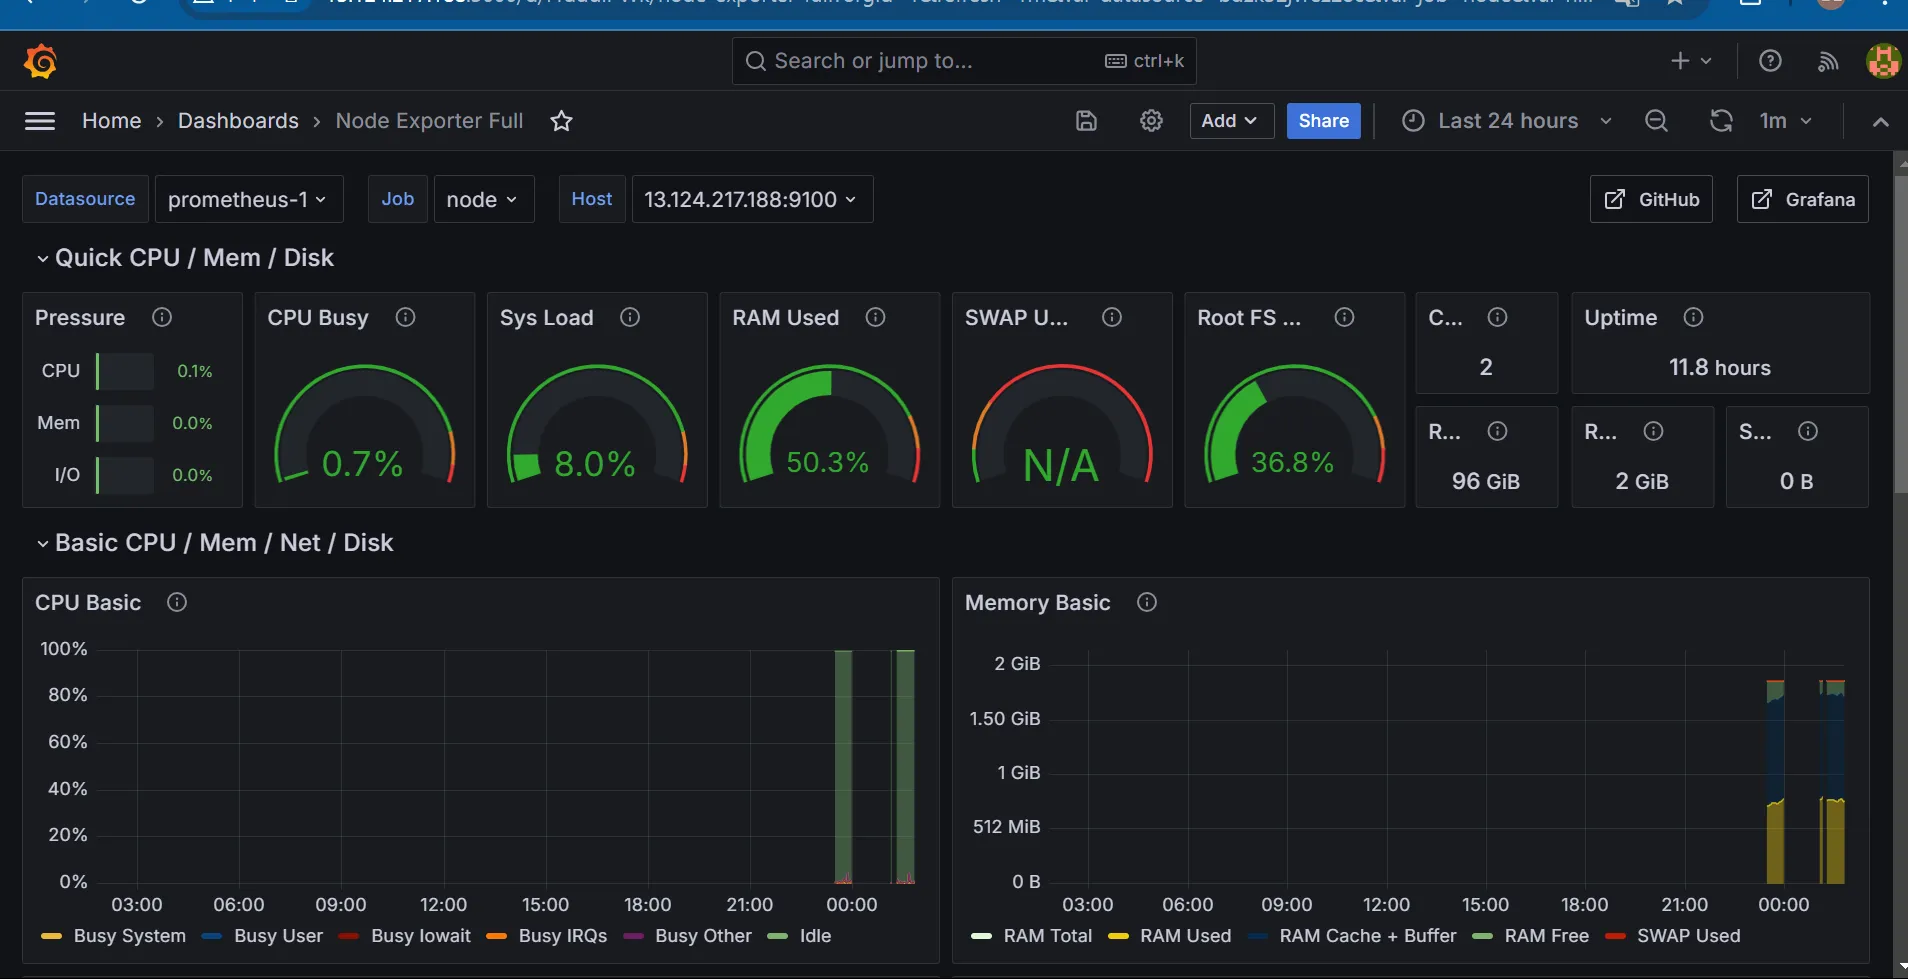
Prometheus, Grafana를 통해서 알 수 있는 것들

- Busy state of all CPU cores together
- RAM memory
- Used Root FS는 루트 파일 시스템(root filesystem)에서 사용된 디스크 공간
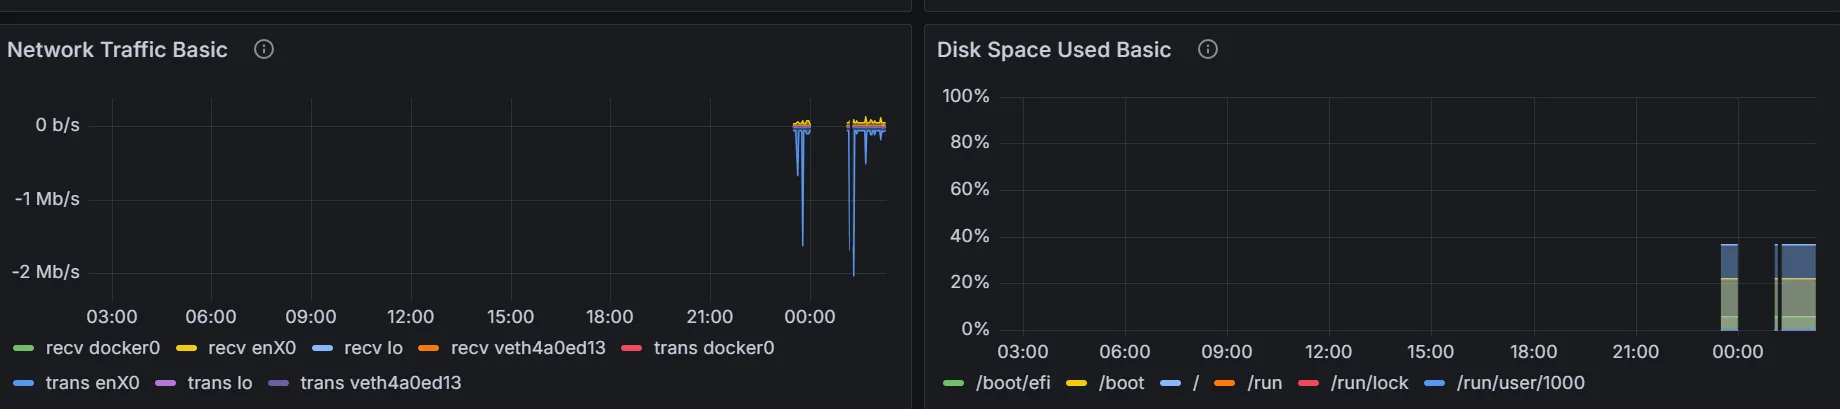
- 위와같은 송,수신 트래핏
- disk등의 정보를 볼 수 있음
결론
Prometheus와 Grafana는 서버 모니터링을 위한 강력한 도구 조합인듯합니다. Prometheus는 서버의 성능 메트릭을 수집하고 경고를 관리하며, Grafana는 수집된 데이터를 시각적으로 보여줌으로써 서버 모니터팅을 제공합니다. 이 두 도구를 사용하면 서버의 CPU, 메모리, 디스크 사용량, 네트워크 트래픽 등을 실시간으로 모니터링할 수 있으며, 경고 알림을 통해 시스템 장애를 사전에 감지하고 대응할 수 있습니다. 이러한 시스템은 IT 인프라의 효율적 관리와 문제 해결에 매우 유용하며, 자동화된 서비스 디스커버리 및 시각화를 통해 관리의 편의성을 극대화할 수 있습니다.
참고 자료