사용 목적
매매 페이지를 만들고 나서 실시간 캔들 차트를 구현해보고자 사용
설계 순서
1. 화면 첫 진입시 차트의 초기 데이터를 생성 해준다(redis or DB)
2. 실시간 차트는 기존 매매 페이지처럼 rabbitMq의 queue를 통해 받는다
코드 작성(샘플용)
큐 연결 관련해서는 자세한 코드는 생략하고 subscribe 부분만 기재
import { createChart, IChartApi, ISeriesApi, LineData, CrosshairMode, ColorType } from 'lightweight-charts';
const marketRefSubscriptionRef = React.useRef<StompSubscription | null>(null)
const [marketQueData, setMarketQueData] = React.useState<typeMarketQue>({});
// queue 연결 method
const connect = () => {
...
...
marketRefSubscriptionRef.current = stompClient.subscribe('/exchange/구독할 exchange/binding할 key', (message) => {
// 체결 된 데이터는 단건으로 받는다
const parseData = {...JSON.parse(message.body)};
// console.log("parseData :: ", parseData)
// 실시간 차트, 거래량 차트 update 위한 set
setMarketQueData(parseData)
});
}
const chartContainerRef = React.useRef<HTMLDivElement>(null);
const chartApiRef = React.useRef<IChartApi | null>(null);
const tooltipRef = React.useRef<HTMLDivElement | null>(null);
const candleSeriesApiRef = React.useRef<ISeriesApi<'Candlestick'> | null>(null);
const volumeSeriesApiRef = React.useRef<ISeriesApi<"Histogram"> | null>(null);
type typeCandleData = {
time: string, open: number, high: number, low: number, close: number,
}
const [candleData, setCandleData] = React.useState<typeCandleData[]>([])
// 첫 화면 진입 시 차트 데이터 설정 및 queue 연결
React.useEffect(() => {
if (chartContainerRef.current) {
// 차트 기본 설정 create
chartApiRef.current = createChart(chartContainerRef.current, {
width: 1000,
height: 600,
layout: {
background: {
type: ColorType.Solid,
color: 'white',
},
textColor: 'black',
},
grid: {
vertLines: {
color: 'rgba(197, 203, 206, 0.5)',
},
horzLines: {
color: 'rgba(197, 203, 206, 0.5)',
},
},
crosshair: {
mode: CrosshairMode.Normal,
},
localization: {
dateFormat : 'yyyy-MM-dd'
},
rightPriceScale: {
borderColor: 'rgba(197, 203, 206, 0.8)',
},
timeScale: {
borderColor: 'rgba(197, 203, 206, 0.8)',
},
});
// 툴팁 element 생성
tooltipRef.current = document.createElement('div');
tooltipRef.current.className = 'floating-tooltip-2';
chartContainerRef.current.appendChild(tooltipRef.current);
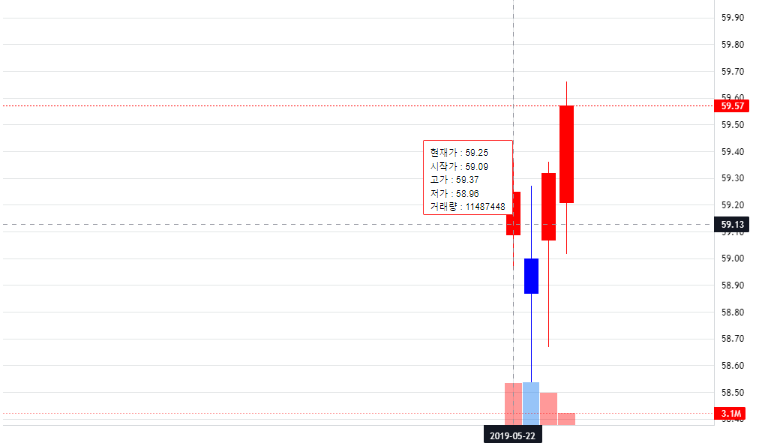
// mouse 이동 이벤트에 따른 툴팁 위치 및 내용 handle method
const handleCrosshairMove = (param) => {
if (param.time && [param.seriesData].length && tooltipRef.current) {
// param에서 data 꺼내기
// seriesData는 Map 형식이기 때문에 각각 설정할 때 생성해두었던 변수로 get
const candleSeriesData = param.seriesData.get(candleSeries);
const volumeSeriesData = param.seriesData.get(volumeSeries);
const toolTipDiv = `<div>
<div>현재가 : ${candleSeriesData.close}</div>
<div>시작가 : ${candleSeriesData.open}</div>
<div>고가 : ${candleSeriesData.high}</div>
<div>저가 : ${candleSeriesData.low}</div>
<div>거래량 : ${volumeSeriesData.value}</div>
</div>`
// Update the tooltip content with the time and prices
tooltipRef.current.innerHTML = toolTipDiv;
// Position the tooltip relative to the chart
tooltipRef.current.style.left = `${param.point.x}px`;
tooltipRef.current.style.top = `${param.point.y}px`;
// Show the tooltip
tooltipRef.current.style.display = 'block';
} else {
// Hide the tooltip if no valid data point is available
if(tooltipRef.current)tooltipRef.current.style.display = 'none';
}
};
// 캔들차트 설정
const candleSeries = chartApiRef.current.addCandlestickSeries({
upColor: 'red',
downColor: 'blue',
borderDownColor: 'blue',
borderUpColor: 'red',
wickDownColor: 'blue',
wickUpColor: 'red',
})
// 거래량 봉차트 설정
const volumeSeries = chartApiRef.current.addHistogramSeries({
color: '#26a69a',
priceFormat: {
type: 'volume',
},
priceScaleId: '',
});
// 거래량 봉차트 사이즈 설정
chartApiRef.current.priceScale('').applyOptions({
scaleMargins: {
top: 0.9,
bottom: 0,
},
});
// 첫 화면 진입시 서버에서 받아야 하는 데이터들(candleData, volumeData)
const tmpCandleData = [
{ time: "2019-05-22", open: 59.09, high: 59.37, low: 58.96, close: 59.25 },
{ time: '2019-05-23', open: 59.00, high: 59.27, low: 58.54, close: 58.87 },
{ time: '2019-05-24', open: 59.07, high: 59.36, low: 58.67, close: 59.32 },
{ time: "2019-05-28", open: 59.21, high: 59.66, low: 59.02, close: 59.57 },
]
let volumeData = [
{ time: '2019-05-22', value: 11487448.00, color: 'rgba(255, 0, 0, 0.4)' },
{ time: '2019-05-23', value: 11707083.00, color: 'rgba(47, 138, 241, 0.5)' },
{ time: '2019-05-24', value: 8755506.00, color: 'rgba(255, 0, 0, 0.4)' },
{ time: '2019-05-28', value: 3097125.00, color: 'rgba(255, 0, 0, 0.4)' },
]
// msg큐 받고 나서 update 진행할 수 있게 따로 잡아둔 candleData 배열에도 set
setCandleData([...tmpCandleData])
// 설정해놨던 Series에 각각 setData
candleSeries.setData([...tmpCandleData])
volumeSeries.setData([...volumeData])
candleSeriesApiRef.current = candleSeries
volumeSeriesApiRef.current = volumeSeries
// 툴팁 handle method subscribe
chartApiRef.current.subscribeCrosshairMove(handleCrosshairMove);
}
connect();
// Cleanup function
return () => {
if (chartApiRef.current) {
chartApiRef.current.remove();
chartApiRef.current = null;
}
disconnect();
};
}, []);
// queue 데이터 처리 부분
React.useEffect( () => {
if(candleData.length> 0){
// queue에서 온 message 기반으로 데이터 세팅
let currPrice = +marketQueData.currPrice
let basSecCode = marketQueData.basSecCode
let dateClass = new Date();
let year = dateClass.getFullYear();
let month = dateClass.getMonth() + 1
let day = dateClass.getDate()
let today = {
day,
month,
year
}
let currentBar ={
time: '',
open: 0,
high: 0,
low: 0,
close: 0,
}
// 해당 종목코드 일치할 경우에만
if(basSecCode === '종목코드'){
// 기준시간으로 바뀔 경우
if (JSON.stringify(candleData[candleData.length-1].time) !== JSON.stringify(today)) {
currentBar = {
time: `${year}-${String(month).padStart(2, '0')}-${String(day).padStart(2, '0')}` ,
open: currPrice ,
high: currPrice ,
low: currPrice ,
close: currPrice ,
}
setCandleData(candleData => {
return [...candleData, currentBar]
})
} else {
// 차트 data update용
let currentData = candleData[candleData.length-1]
currentBar.time = `${year}-${String(month).padStart(2, '0')}-${String(day).padStart(2, '0')}`
currentBar.open = currentData.open
currentData.high < currPrice ? currentBar.high = currPrice : currentBar.high = currentData.high
currentData.low > currPrice ? currentBar.low = currPrice : currentBar.low = currentData.low
currentBar.close = currPrice
candleData[candleData.length-1] = currentBar
}
if(candleSeriesApiRef.current){
candleSeriesApiRef.current.update(currentBar);
volumeSeriesApiRef.current?.update({
time: `${year}-${String(month).padStart(2, '0')}-${String(day).padStart(2, '0')}` ,
value: +marketQueData.tradeVol,
color: currentBar.open <= currPrice ? 'rgba(255,82,82, 0.8)' : 'rgba(47, 138, 241, 0.5)'
})
}
}
}
},[marketQueData])
..
..
...
return (
..
...
...
<div ref={chartContainerRef}></div>
...
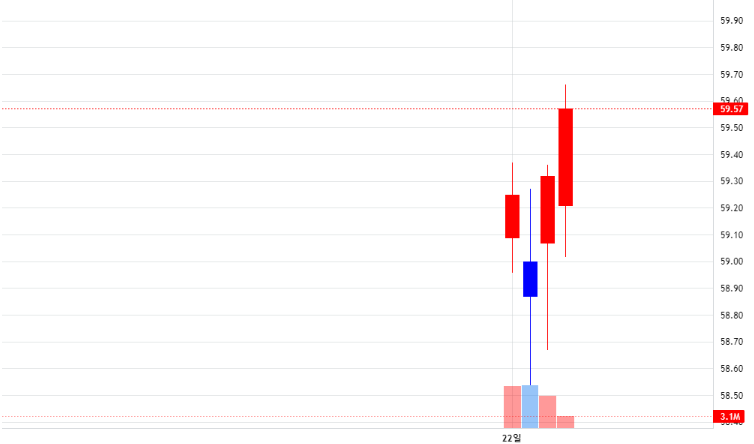
)결과

내일도 글쓰기