
Actuator는 어디에 쓰는건지?
애플리케이션의 상태를 종합적으로 정리 & 제공
스프링 부트에는 운영 중인 애플리케이션을 HTTP나 JMX를 이용해서 모니터링하고 관리할 수 있는 기능을 제공하는데, 이것이 spring actuator이다.
시스템을 운영하다 보면 기능들이 잘 돌아가는지 지속적으로 모니터링하거나 서버를 재기동하거나 로그 정보를 변경하거나 등등 범애플리케이션 관점에서 처리해야 할 일이 많이 있을 때가 있다.
그러한 기능을 외부에서 쉽게 조작하게 만들기 위한 프로젝트가 spring actuator다.
Actuator의 기본 설정
build.gradle추가
	implementation 'org.springframework.boot:spring-boot-starter-actutator'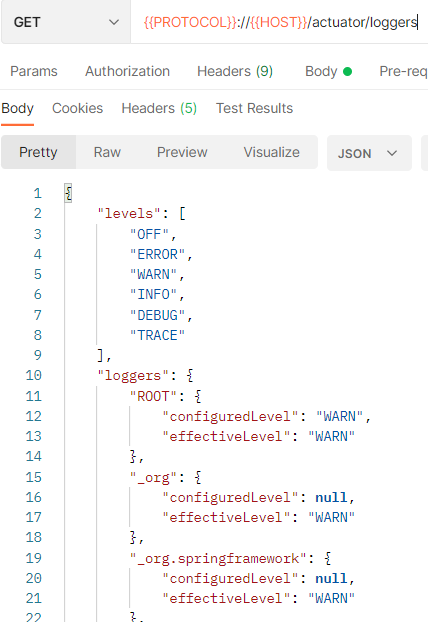
runtimeOnly 'io.micrometer-registry-prometheus'{{PROTOCOL}}://{{HOST}}/actuator으로 호출하면 아래와 같이 postman이 관련된 actuator endpoints 데려온다
계속 안된다고 떠서 뭐지 했는데 actuator을 get 으로 데려와야 하는데 postman에서 계속 post 붙이고 앉아있었음 ;; 바보 ㅇㅈ
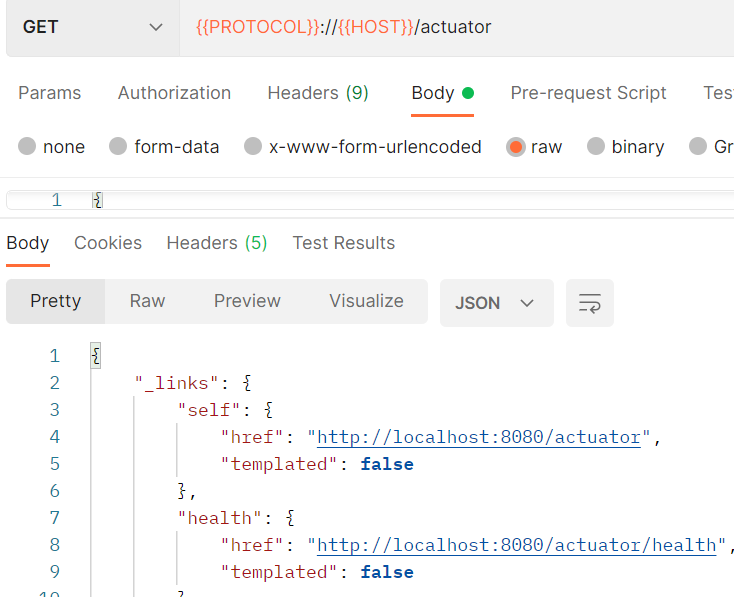
- health : 사용자 응답을 받을 수 있는 상태인지
- actuator을 통해서 우리 프로젝트 상태 체크 가능
Endpoint 활성화
management:
  endpoints:
    enabled-by-default: true
    web:
      exposure:
        include: health, info, loggers
  endpoint:
    health:
      show-details: always
      show-components: always
endpoints 추가
- enable : actuator가 차용하고 있는 빈을 실제로 차용할 지 말지
1) health
- endpoint : health : 부분이 health 엔드포인트를 어떻게 할 지 결정하는 곳
- 이때 health를 찍어본다면
status:UP이라고 나온다
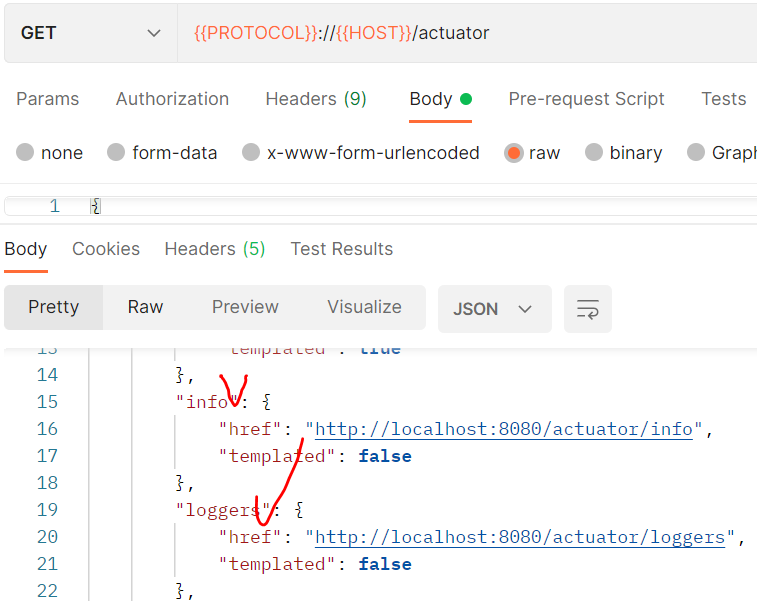
- 추가적으로 endpoints 들 생성됨
management:
  endpoints:
    enabled-by-default: false
    web:
      exposure:
        include: health, info, loggers
  endpoint:
    health:
      enabled: true
      show-details: always
      show-components: always
    info:
      enabled: true
    loggers:
enabled: true-
enabled-by-default: false였다면 나중에 하나하나 차용 여부 결정해야 함 & enabled가 디폴트로 false로 설정됨 -
따라서 health 엔드포인트 부분 true 로 기본값 false 였던 것을 변경해주자
-
enabled by default가 true 였다고 하더라도 endpoint.web.exposure.include 안에 들어있지 않는 것이 있다고 하면 그것은 엔드포인트 반영 x
=> 제대로 맵핑 되지 않기 때문 -
추가적으로 아까의 health와 달리 show-details 랑 show-components 값을 always로 추가해놓음
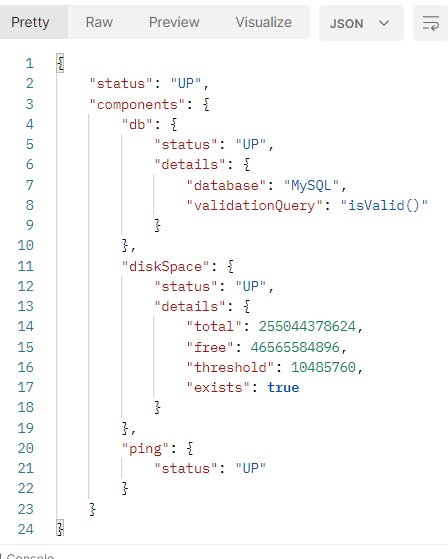
- components와 detail이 추가적으로 나옴
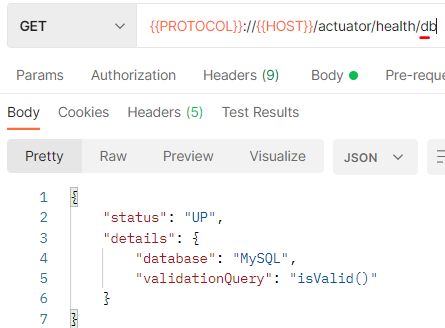
- 뒤에 db 라는 아이 하나 더 붙여도 이런 식으로 나온다
2) loggers
-
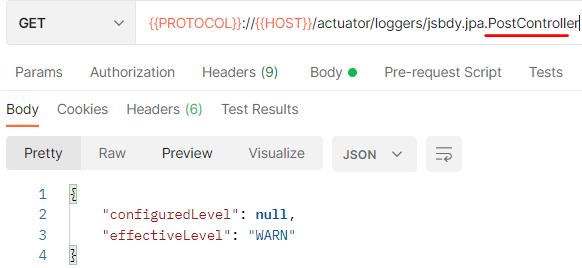
맨 뒤에 로거가 속한 패키지명 추가
-
The configuredLevel is the explicitly configured logging level for that logger and is null if not explicitly configured
-
If the configuredLevel is not null, the effectiveLevel is equal to the configuredLevel.
-
If the configuredLevel is null, the effectiveLevel is equal to the logging level of the logger's parent.
3) shutdown & prometheus 추가
   web:
      exposure:
        include: health, info, loggers, shutdown, prometheus
  endpoint:
    health:
      enabled: true
      show-details: always
      show-components: always
    info:
      enabled: true
    loggers:
      enabled: true
    shutdown:
      enabled: true
    prometheus:
enabled: true- prometheus
세계적으로 많이 사용하는 모니터링 도구
- 다양한 계측 정보를 HTTP 요청을 통해 받아옴
(이때 http 요청을 actuator에서 제공하는 것) - 계측 정보에 대한 내용을 GUI로 표시
- 위험상황에 대한 알림 보여줌
Prometheus 란? 출처
- Prometheus 는 오픈 소스 서비스 모니터링 시스템 이다.
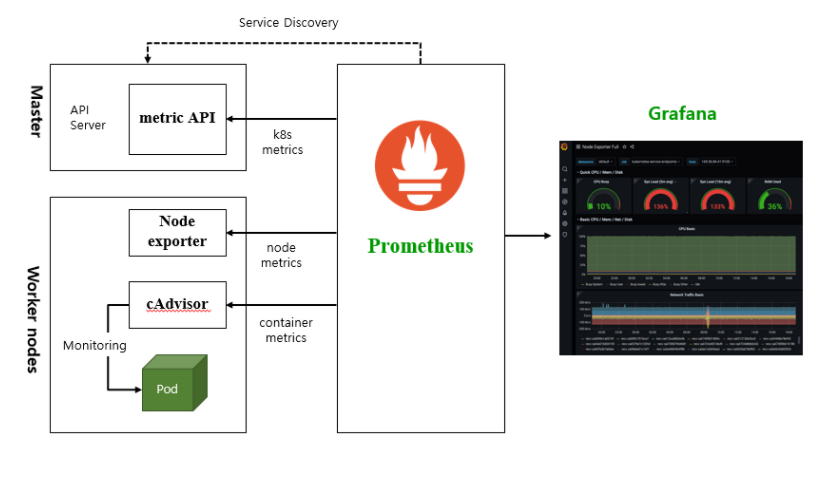
- Exporter는 모니터링 대상의 Metric 데이터를 수집한다. 호스트 서버의 CPU, Memory 등을 수집하는 node-exporter, Nginx의 데이터를 수집하는 Nginx-export 등이 있다.
- HTTP 엔드포인트를 오픈하여 (기본포트 9100) Prometheus 서버가 데이터를 수집해 갈 수 있도록 해준다.
블로그 글 출처
kubernetes 리소스의 metric(사용현황) 정보를 수집(prometheus)하여 대시보드로
제공 (grafana)할 수 있도록 하기 위해 prometheus와 grafana툴을 이용함
- prometheus는 json 형태 아닌 plain text 형태로 돌아온다
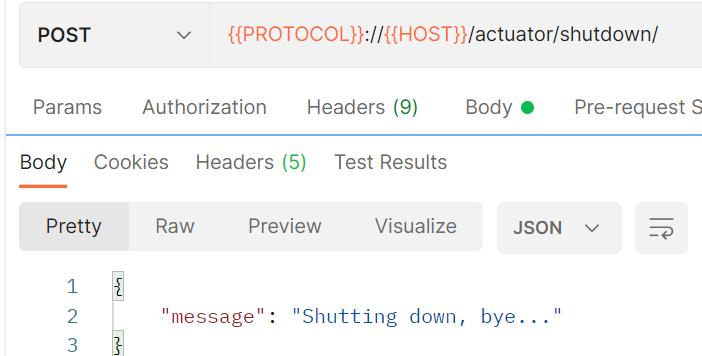
3-1 : shutdown
shutdown
Spring Boot 환경에서 application을 shutdown 하는 방법 중 대표적인 것이 actuator의 shutdown endpoint 기능을 이용하는 것입니다. 이 endpoint는 예상과 달리 처리 중인 요청이 있더라도 그냥 shutdown 처리
3-2 : prometheus 사용해보기
- build.gradle에서 runtimeOnly 'io.micrometer-registry-prometheus`가 꼭 있어야만 함
prometheus.yml정의
global:
  scrape_interval: 15s
  evaluation_interval: 15s

scrape_configs:
  - job_name: 'spring boot scrape'
    metrics_path: '/actuator/prometheus'
    scrape_interval: 1s
    static_configs:
      - targets: ['host.docker.internal:8080']
- cd 요청들을 거쳐서 resource 디렉토리로 오깅
docker run -d -v prometheus.yml -p 9090:9090 --name=prom-stub prom/prometheus 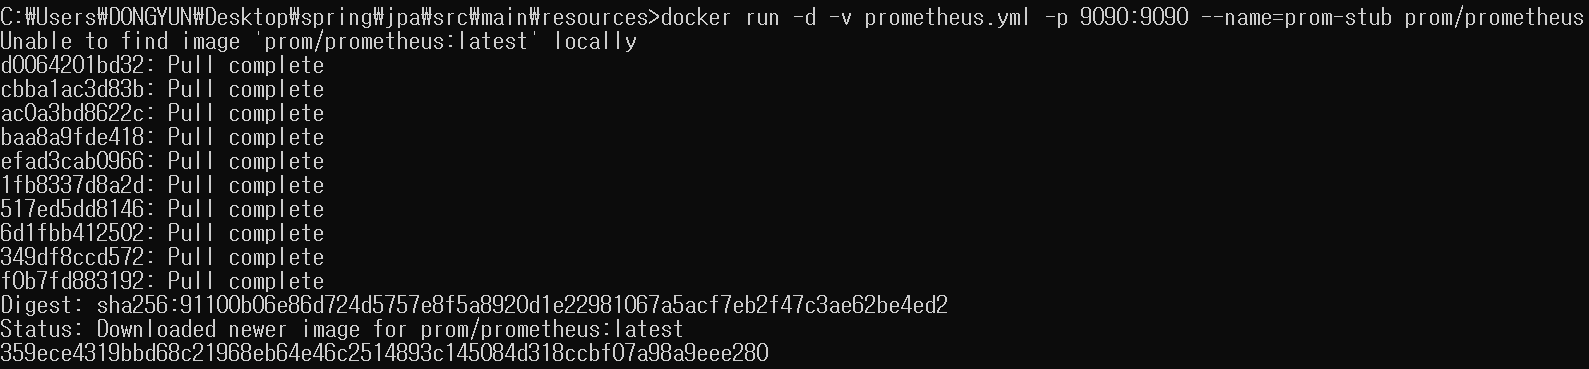
-
docker ps명령어로 확인해보니 잘 만들어짐

-
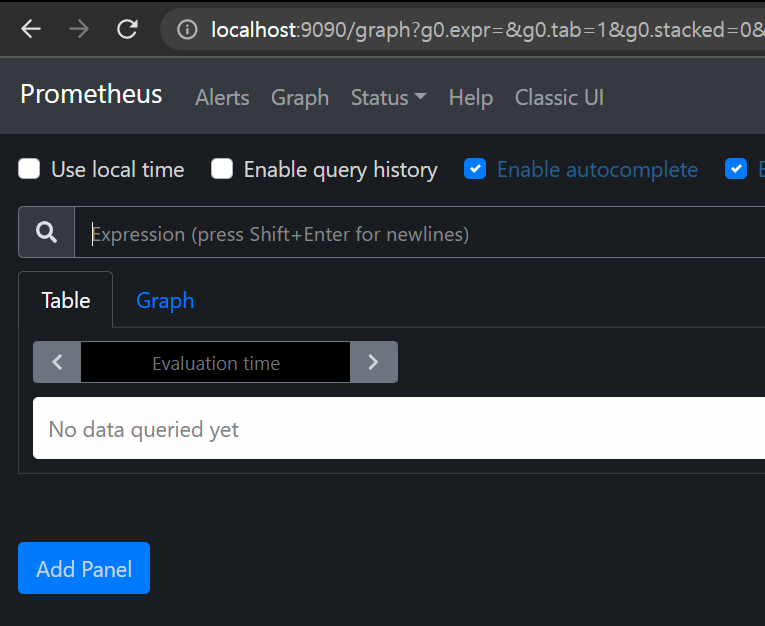
localhost:9090가보기 - 프로메테우스 잘 떠있음
아래 블로그 글 출처
1. Spring Boot Actuator 이해
1) WHY?
각 마이크로서비스는 고유의 목적을 가지고 개발되고 운영됩니다.
하지만 모든 마이크로서비스에는 공통으로 요구되는 기능이 있습니다.
예를 들어 Health Check와 상태정보(Metrics) 제공같은 기능들이 그것입니다.
이러한 공통 기능들을 각각 만드는 것은 매우 비효율적입니다.
Spring Boot Actuator가 필요한 이유는 어플리케이션을 관리하고 제반 정보를 제공하는 공통 기능을 쉽게 적용하기 위해서입니다.
참고) Actuator 어원
An actuator is a manufacturing term that refers to a mechanical device
for moving or controlling something.
Actuators can generate a large amount of motion from a small change.
Actuator는 무언가를 옮기거나 통제하기 위한 물리 장치를 의미하는 제조 용어입니다.
Actuator는 작은 변화로 큰 움직임을 발생시킬 수 있습니다.
actuator는 '무언가를 작동시키는 것'이라는 뜻입니다.
다양한 metric을 요청하는 end point들, config를 재 로딩 요청하는 '/actuator/refresh',
circuit breaker 상태를 요청하는 '/actuator/hystrix.stream' 등 애플리케이션에게 무언가를 요청하여 동작하게끔 한다는
의미로 붙여진 것 같습니다.
Actuator는 Spring Cloud component가 아니라, Sprint Boot의 component입니다.
2) HOW?
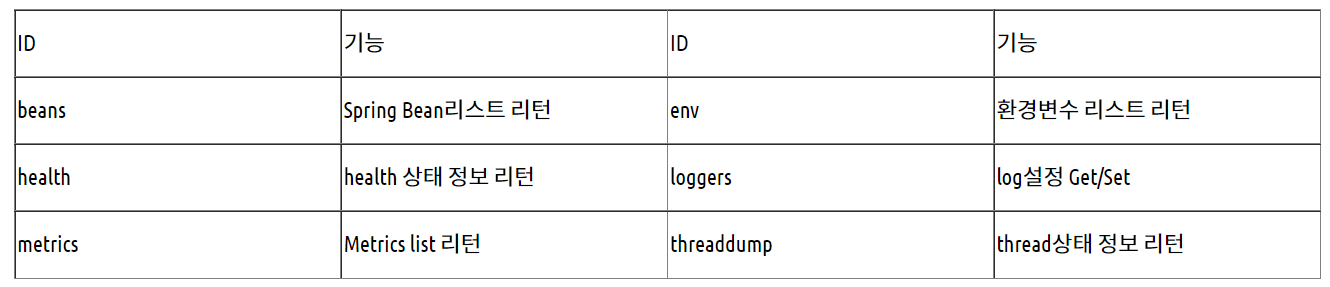
현재 Actuator가 제공하는 기능은 아래와 같습니다.
주요 기능을 위한 end point는 아래와 같습니다. http://{app host}:{app port}/actuator/{end point}로 호출합니다.
 .
.
이 중에 제일 많이 사용되는 기능은 역시 Metrics입니다.
Actuator의 Metric기능은 Micrometer라는 오픈소스를 사용합니다.
Micrometer는 각 모니터링 제품별로 메트릭을 수집하는 클라이언트(에이젼트)를 위한 표준 Facade(인터페이스)를 제공하는 제품입니다.
Micrometer가 표준형식으로 Metric을 제공하면, 각 모니터링 제품 클라이언트가 자기 format대로 metric형식을 변화하면 됩니다.
따라서 특정 벤더에 종속되지 않고, 필요에 따라 적절한 모니터링 제품으로 쉽게 바꿀 수 있습니다.
우리는 아래와 같이 Prometheus와 Grafana를 이용하여 어플리케이션에 대한 모니터링을 실습해 보고자 합니다.
각 어플리케이션에는 Micrometer툴이 사용된 Actuator metric과 Prometheus client를 적용합니다.
Prometheus서버는 Prometheus client를 통하여 Metrics정보를 형 변환하여 주기적으로 pulling합니다.
Grafana서버는 Prometheus에 수집된 데이터를 주기적으로 읽어 대시보드로 제공합니다.
또한, 정해진 Alert규칙에 따라 여러 채널로 통보합니다.
https://medium.com/@sonus21/monitoring-and-profiling-spring-boot-application-a35d7e7f9290
에러
circular view path [post]: would dispatch back to the current handler url [/post] again. check your viewresolver setup! (hint: this may be the result of an unspecified view, due to default view name generation.)
- 이전에 작성했던 어드바이스가
@ControllerAdvice로 돼있었음, RestController로 붙여줌
참고 스택오버플로우