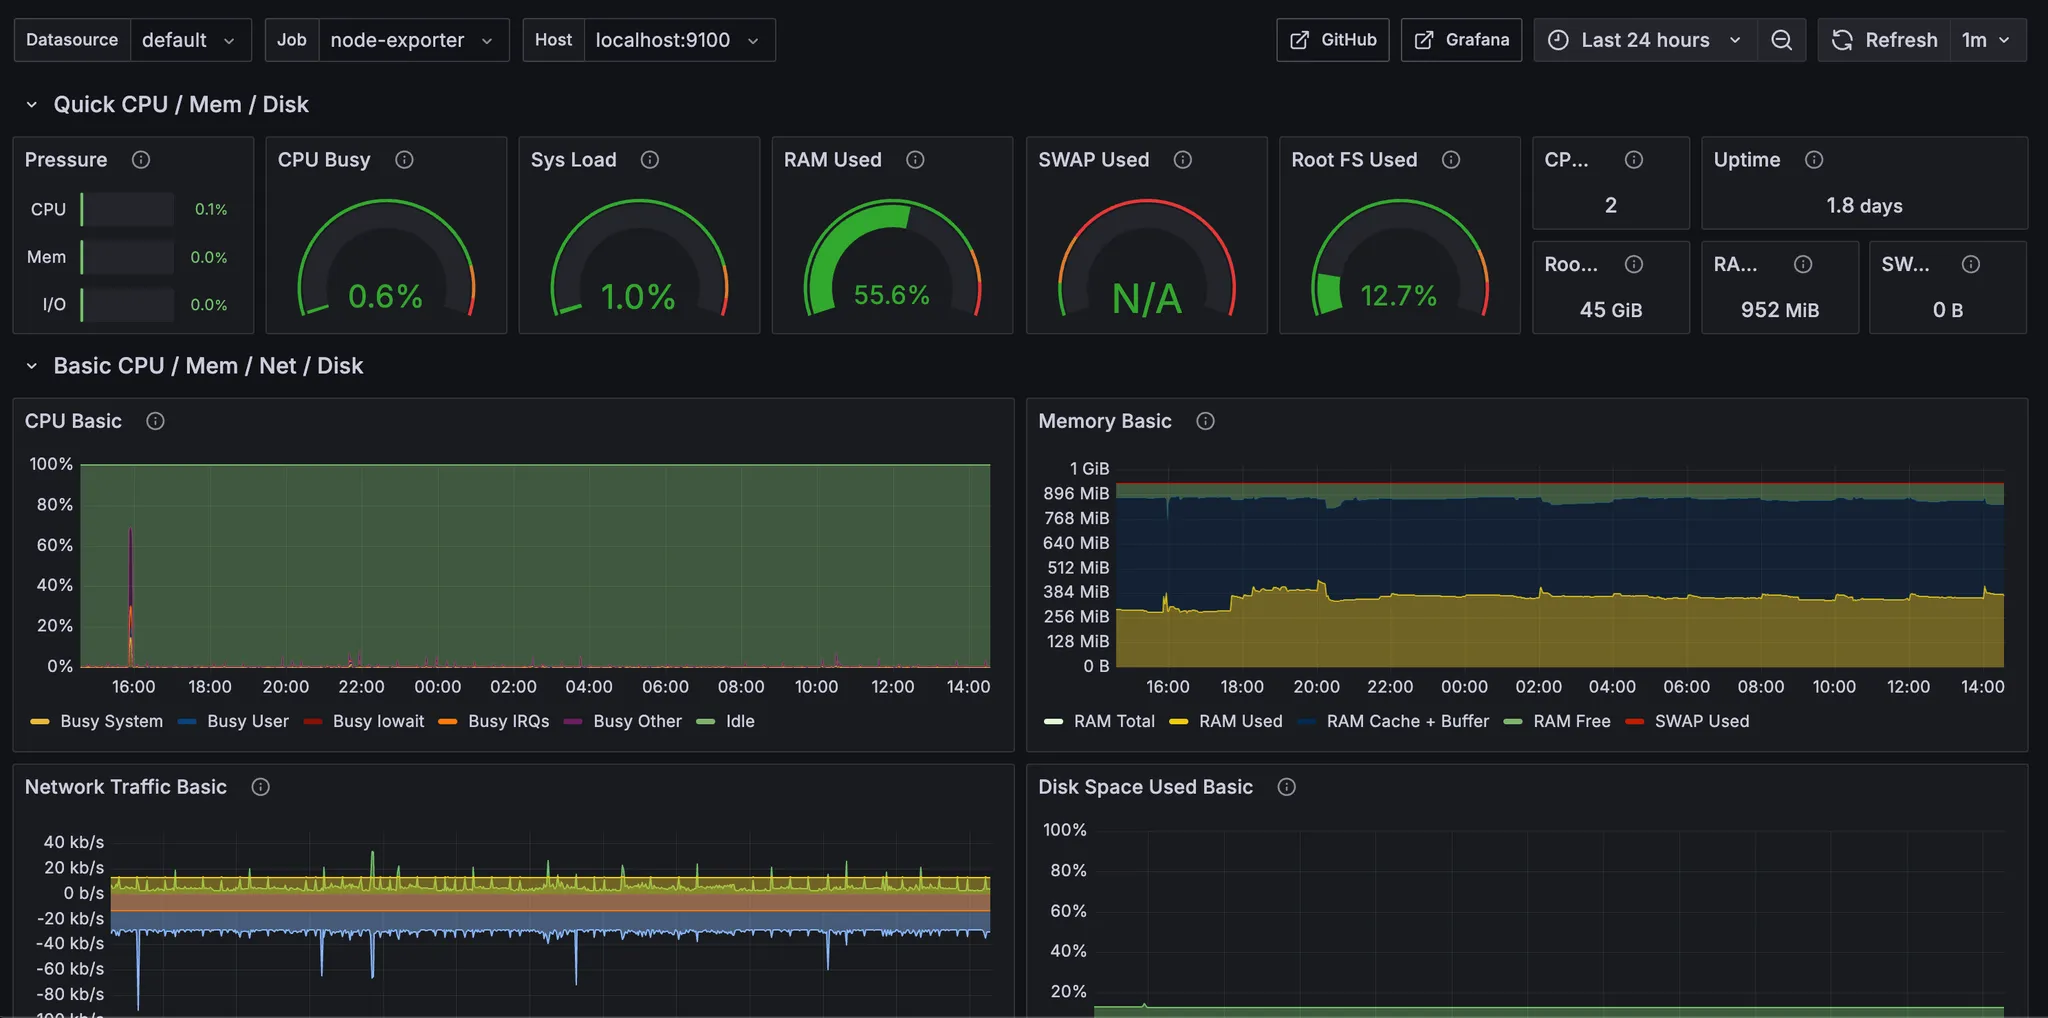
최종 결과 대시보드!
대시보드 구성
Node Exporter
시스템 리소스 정보(CPU, 메모리, 디스크, 네트워크 등)를 HTTP endpoint로 제공
- localhost:9100/metrics 로 시스템 리소스 정보를 제공
Prometheus
다양한 지표를 수집하고 저장하는 시스템
- 대상(예 : node-exporter) 에 주기적으로 접근하여 메트릭 데이터를 가져옴
Grafana
메트릭 데이터를 불러와 대시보드 형태로 시각화해주는 툴
관계 요약
| Element | 역할 |
|---|---|
| Node Exporter | 메트릭 데이터 제공 |
| ⬇️ | |
| Prometheus | 데이터 수집 및 저장 |
| ⬇️ | |
| Grafana | 데이터 시각화 |
설치 & 실행 & 설정
OS : Ubuntu, sudo su 로 관리자 계정에서 진행합니다.

Node Exporter
https://prometheus.io/download/#node_exporter
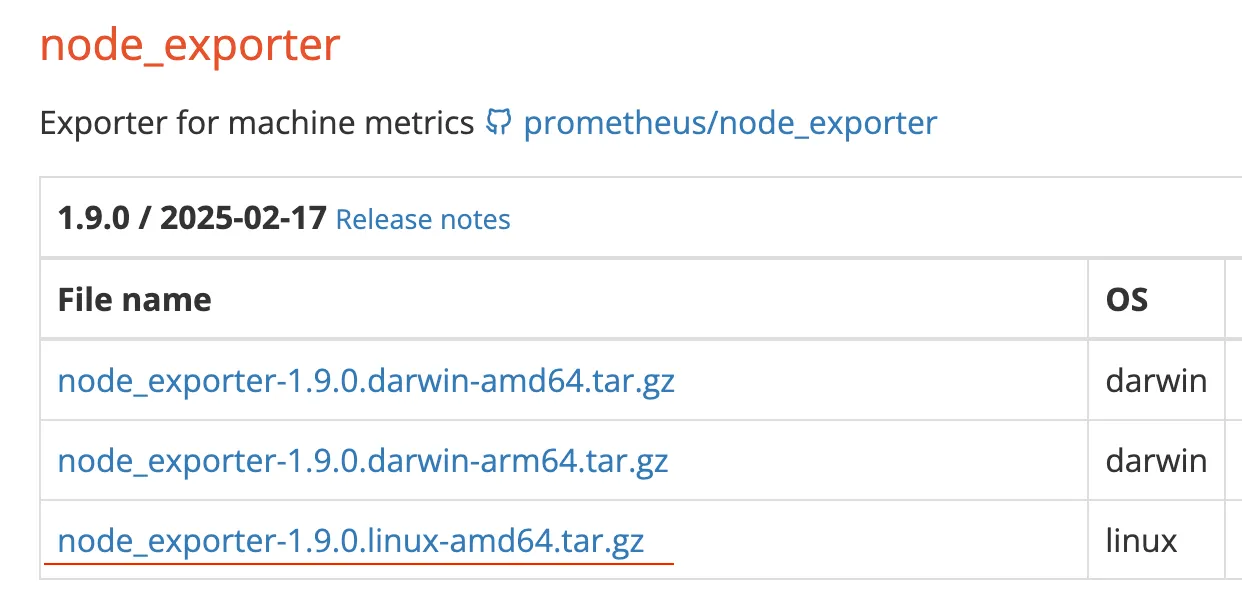
리눅스 버전의 다운로드 링크를 복사합니다.
wget 명령어를 통해서 압축파일을 다운받습니다.
wget https://github.com/prometheus/node_exporter/releases/download/v1.9.0/node_exporter-1.9.0.linux-amd64.tar.gz압축파일 다운로드가 완료되었다면 아래 명령어로 파일이 존재하는지 확인합니다.
ls node_exporter*
파일이 존재한다면 압축을 풀어준 뒤, 압축해제된 경로로 이동합니다.
tar xzvf node_exporter-1.9.0.linux-amd64.tar.gz
cd node_exporter-1.9.0.linux-amd64
ls 명령어로 디렉토리의 파일 목록을 확인하면 다음과 같습니다

이제 node_exporter 파일을 /usr/local/bin 폴더로 옮겨줍니다.
mv node_exporter /usr/local/bin파일을 옮겼다면, 시스템 서비스 등록을 합니다.
vim /etc/systemd/system/node-exporter.service아래 내용을 복사 붙여넣기 한 뒤 저장합니다.
[Unit]
Description=Node Exporter
After=network.target

[Service]
User=nobody
ExecStart=/usr/local/bin/node_exporter

[Install]
WantedBy=default.target
서비스를 시작하고, 부팅 시 자동 실행하도록 설정합니다.
systemctl daemon-reexec
systemctl daemon-reload
systemctl start node-exporter
systemctl enable node-exporter
아래 명령어를 통해 시스템이 정상작동하고 있는지 확인합니다.
systemctl status node-exporter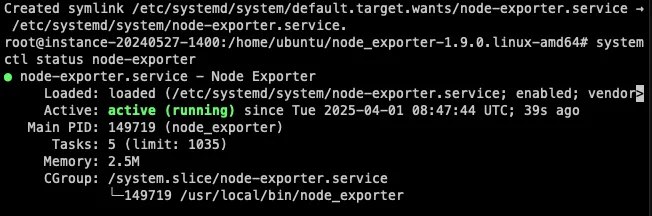
curl http://localhost:9100/metrics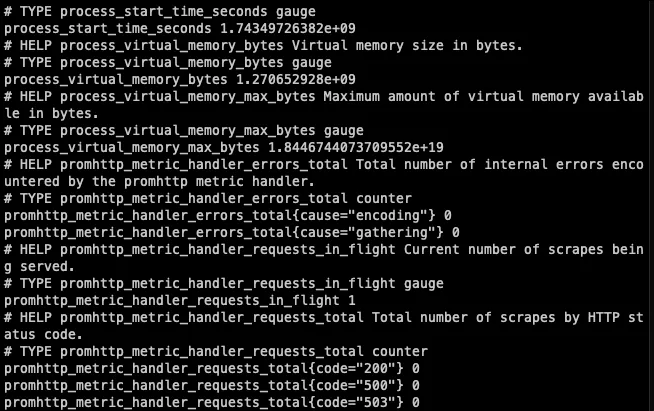
Prometheus
node-exporter 설정이 끝났으니 prometheus 를 설치해 봅니다.
먼저, Prometheus 시스템 그룹을 생성합니다.
groupadd --system prometheusprometheus 사용자를 추가하고, 생성된 그룹에 할당해 줍니다.
useradd -s /sbin/nologin --system -g prometheus prometheus그리고 prometheus를 위한 디렉토리를 생성해 줍니다.
mkdir /etc/prometheus다음으로 아래 링크에 들어가서 프로메테우스 다운로드 링크를 복사합니다.
https://prometheus.io/download/#prometheus
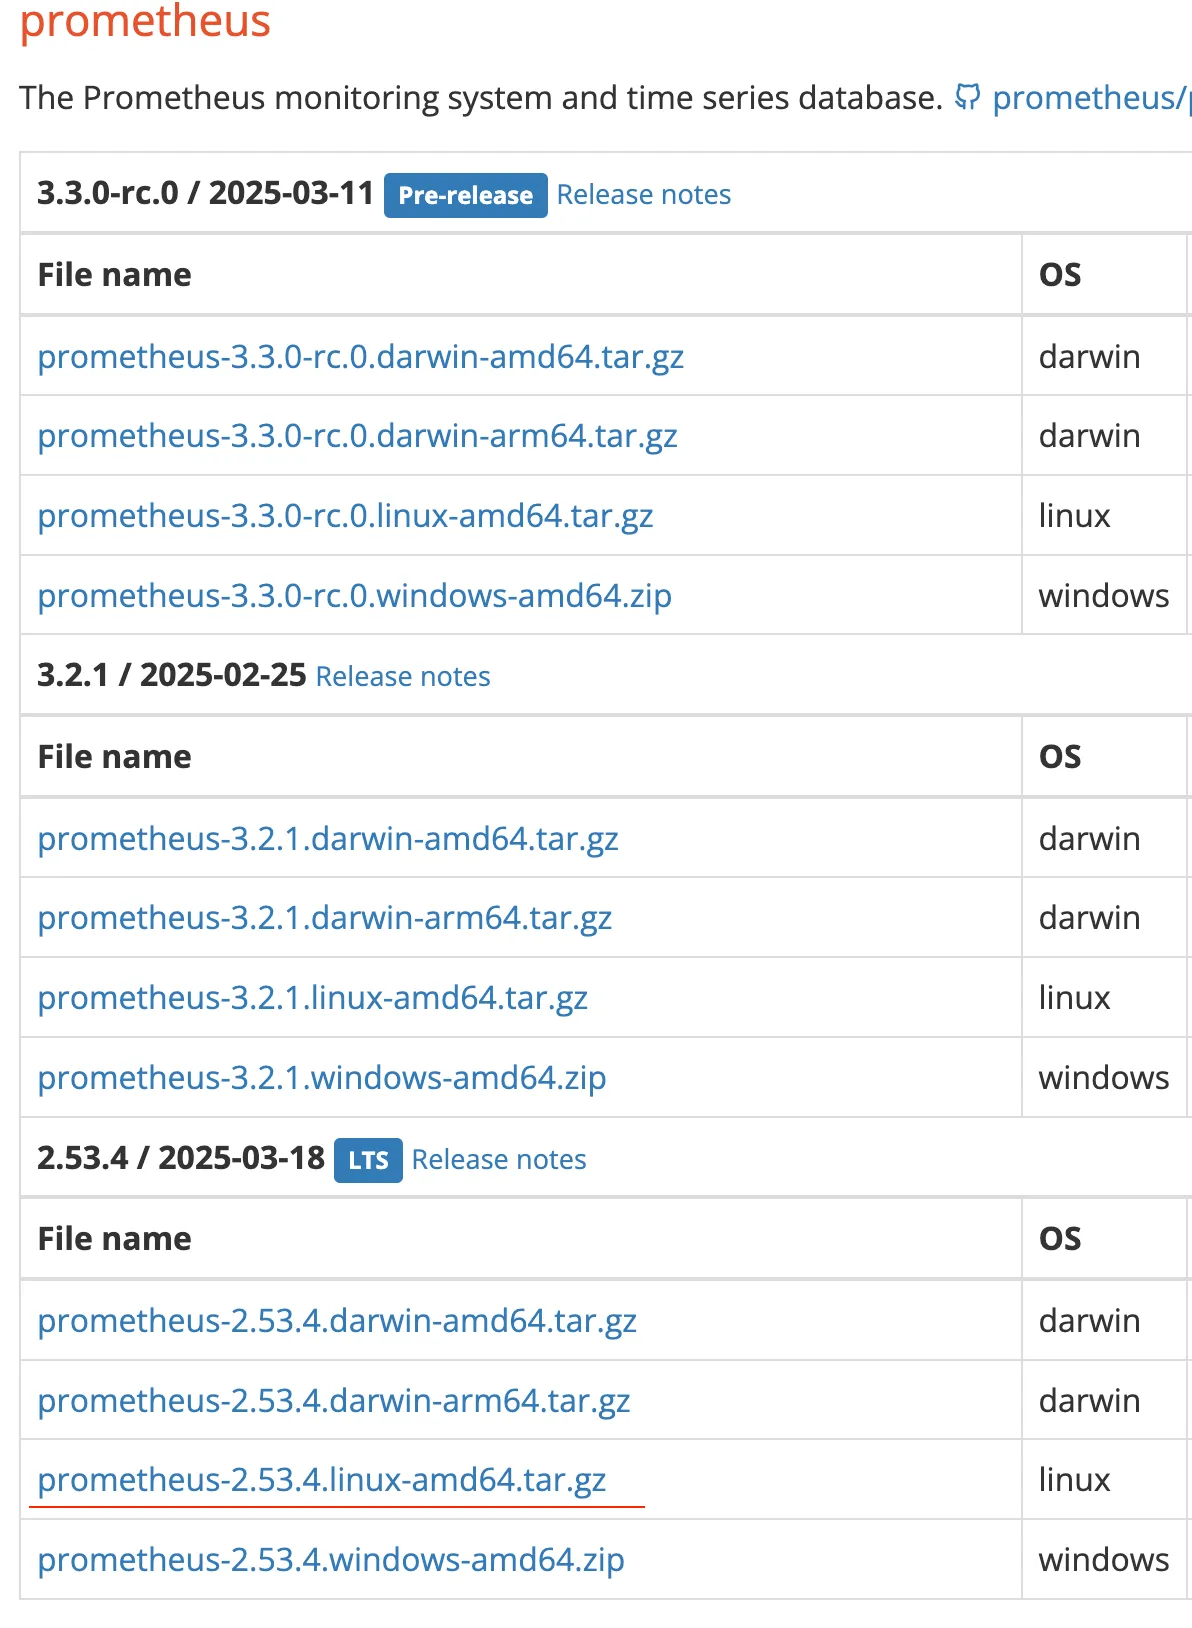
LTS 버전을 받도록 하겠습니다.
wget 명령어를 통해서 압축파일을 다운받습니다.
wget https://github.com/prometheus/prometheus/releases/download/v2.53.4/prometheus-2.53.4.linux-amd64.tar.gz압축파일을 풀어준 뒤 압축이 해제된 디렉토리로 이동해줍니다.
tar xzvf prometheus*.tar.gz
cd prometheus*/
해당 폴더에 있는 prometheus 바이너리 파일을 옮겨준 뒤 버전을 확인합니다.
mv prometheus promtool /usr/local/bin/
prometheus --version
그럼 이제 아까 만들어둔 prometheus 폴더에 구성 파일을 옮겨줍니다.
mv prometheus.yml /etc/prometheus/prometheus.yml
mv consoles/ console_libraries/ /etc/prometheus/
파일을 옮긴 뒤 구성파일의 내용을 확인해 줍니다.
cat /etc/prometheus/prometheus.yml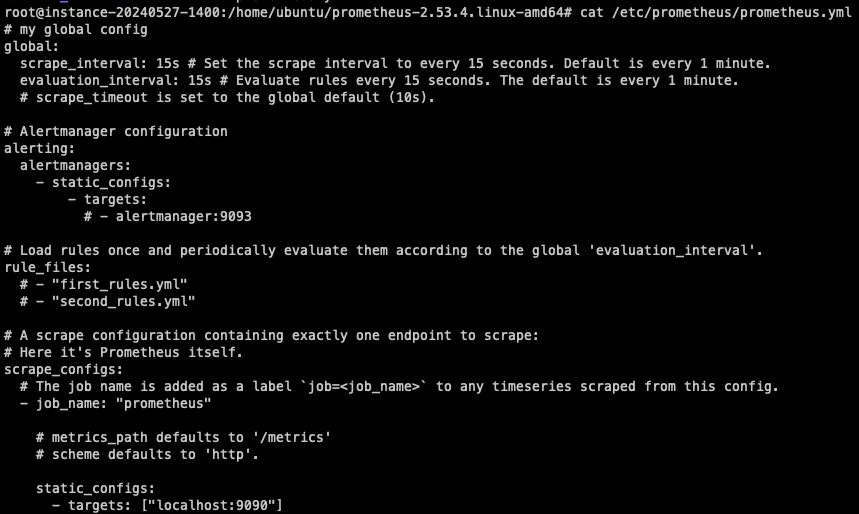
이제 프로메테우스 시스템을 등록합니다.
vim /etc/systemd/system/prometheus.service위 명령어로 에디터를 열어서, 아래 내용을 붙여넣어 줍니다.
[Unit]
Description=Prometheus
Documentation=https://prometheus.io/docs/introduction/overview/
Wants=network-online.target
After=network-online.target
[Service]
User=prometheus
Group=prometheus
Type=simple
ExecStart=/usr/local/bin/prometheus \
--config.file /etc/prometheus/prometheus.yml \
--storage.tsdb.path /var/lib/prometheus/ \
--web.console.templates=/etc/prometheus/consoles \
--web.console.libraries=/etc/prometheus/console_libraries \
--web.listen-address=0.0.0.0:9090 \

[Install]
WantedBy=multi-user.target
/var/lib/prometheus/ 디렉토리를 storage path 로 설정해 놓았기 때문에, 해당 디렉토리를 생성하고, 권한을 부여합니다.
mkdir /var/lib/prometheus
chown -R prometheus:prometheus /var/lib/prometheus
이제 prometheus 설정은 끝났으니 실행시켜 봅니다.
systemctl daemon-reload
systemctl start prometheus
systemctl enable prometheus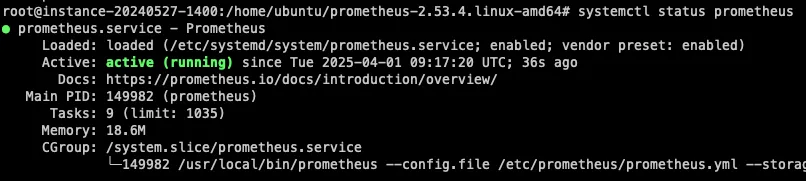
잘 작동하고 있음을 확인할 수 있습니다.
node-exporter <> prometheus 연동
Prometheus 의 설정파일을 수정해줍니다.
vim /etc/prometheus/prometheus.yml최하단에 있는 scrape_configs: 부분에 아래 내용을 추가해 줍니다.
- job_name: 'node-exporter'
    static_configs:
      - targets: ['localhost:9100']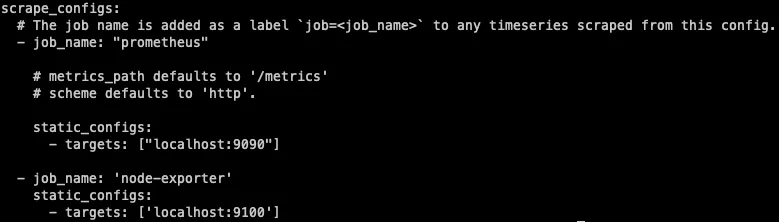
prometheus를 재시작 하고, 연동이 잘 되었는지 확인합니다.
systemctl restart prometheus
curl http://localhost:9090/api/v1/targets
activeTargets 에 localhost:9100/metrics 가 있는지 확인합니다.
Grafana
먼저 apt 업데이트를 진행한 뒤, 필요 패키지를 다운받습니다.
apt update -y && sudo apt upgrade -y
apt install -y apt-transport-https software-properties-common wget
Grafana GPG 키를 추가해주어야 합니다.
아래 명령어를 통해 GPG 키를 다운받아 줍니다.
sudo mkdir -p /etc/apt/keyrings/
wget -q -O - https://apt.grafana.com/gpg.key | gpg --dearmor | sudo tee /etc/apt/keyrings/grafana.gpg > /dev/null
Grafana APT 저장소를 추가해 준 뒤 grafana 를 설치해 줍니다.
echo "deb [signed-by=/etc/apt/keyrings/grafana.gpg] https://apt.grafana.com stable main" | sudo tee -a /etc/apt/sources.list.d/grafana.list
apt update
apt install grafana
설치가 완료되었다면 제대로 설치가 되었는지 확인하고, 서비스를 시작합니다.
grafana-server -v

systemctl start grafana-server
systemctl enable grafana-server

systemctl status grafana-server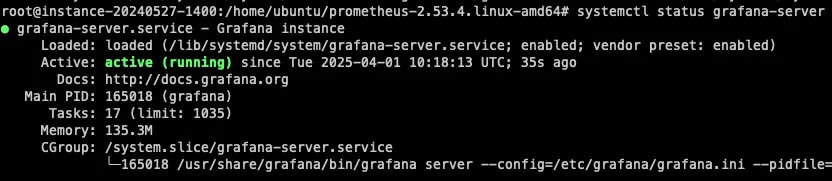
잘 동작하고 있는것을 확인할 수 있습니다.

grafana 가 동작하는 3000번 포트를 개방하고 접속해보겠습니다.
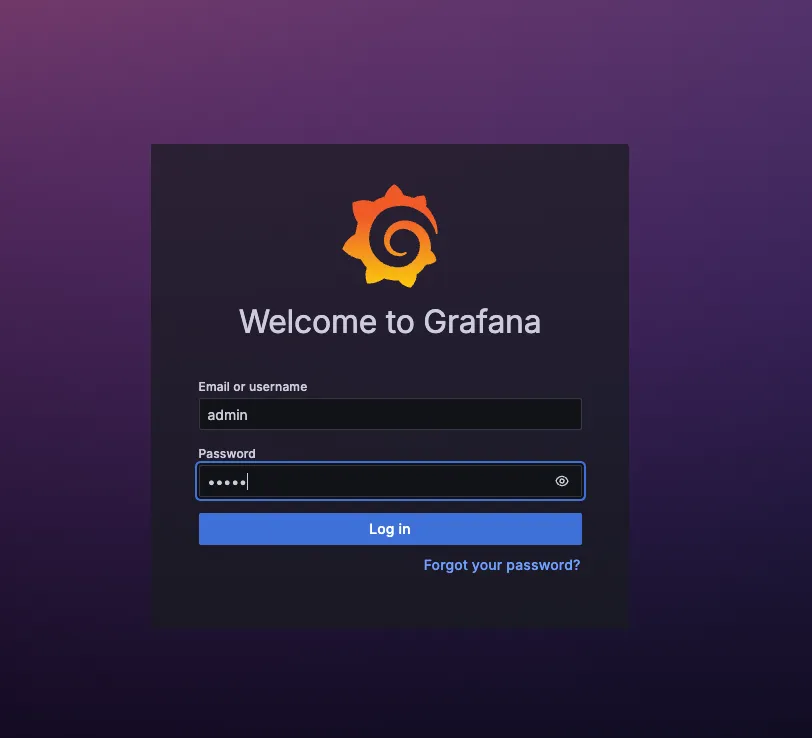
최초 자격증명은 admin/admin 입니다.
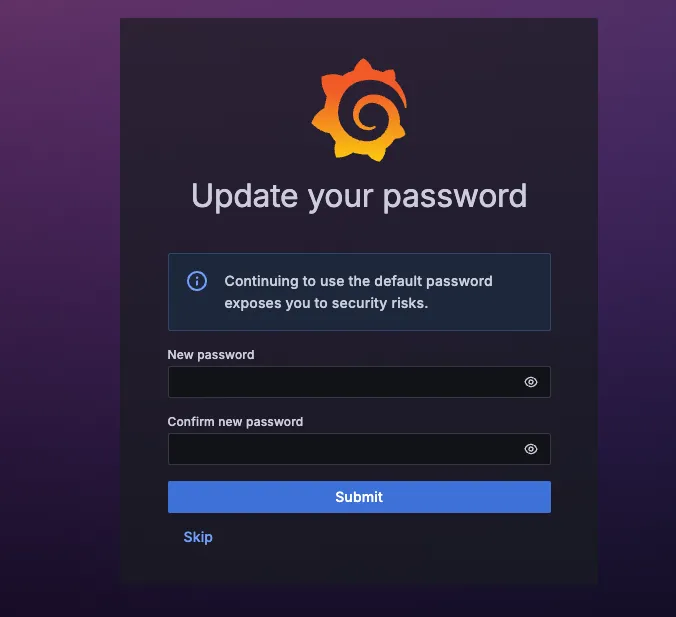
비밀번호를 변경하라는 창이 뜹니다만 skip 하겠습니다.
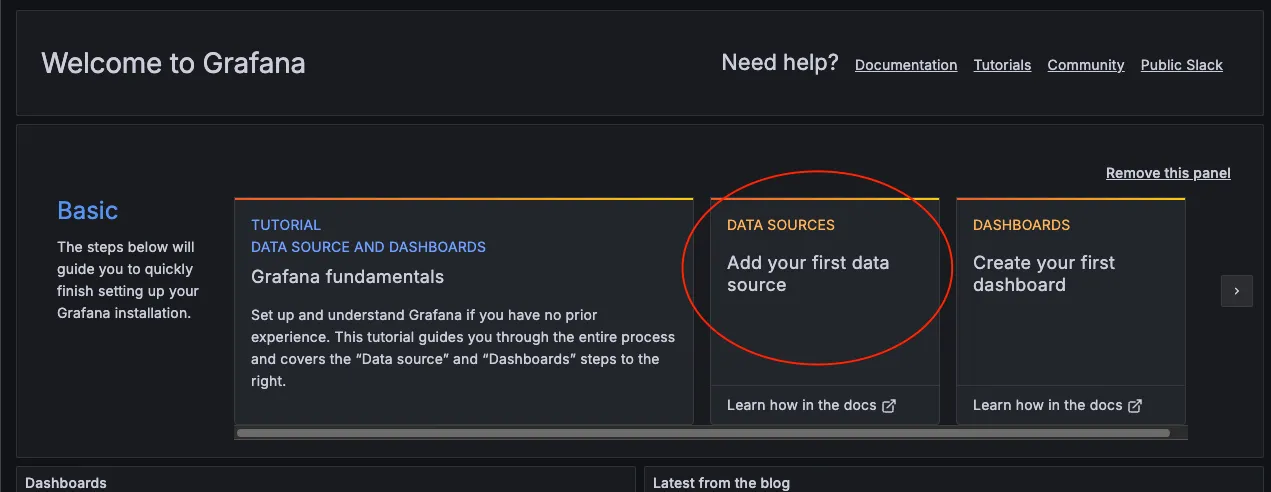
먼저 데이터 소스를 추가해 주겠습니다.
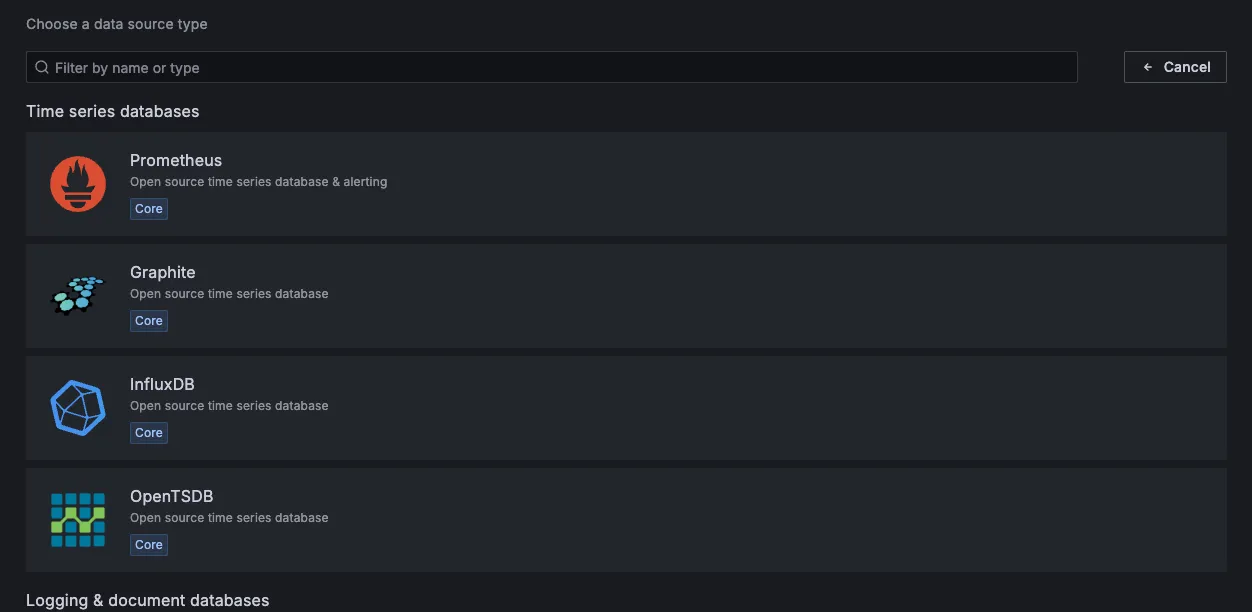
프로메테우스 클릭
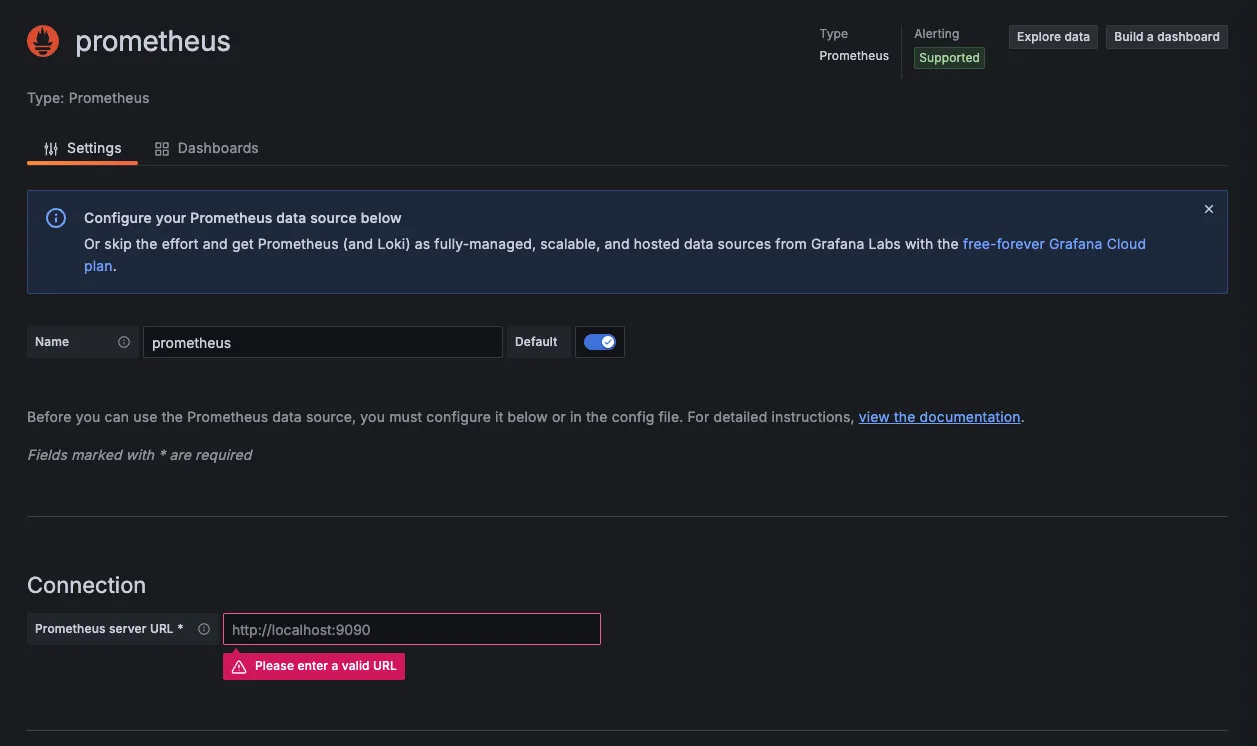
connection 에는 http://localhost:9090 을 입력해줍니다.
제일 밑에 save&test를 누르면 쿼리에 성공했다는 메세지가 나옵니다.

그렇다면 다시 홈으로 돌아와서 dashboard 설정을 해보겠습니다.
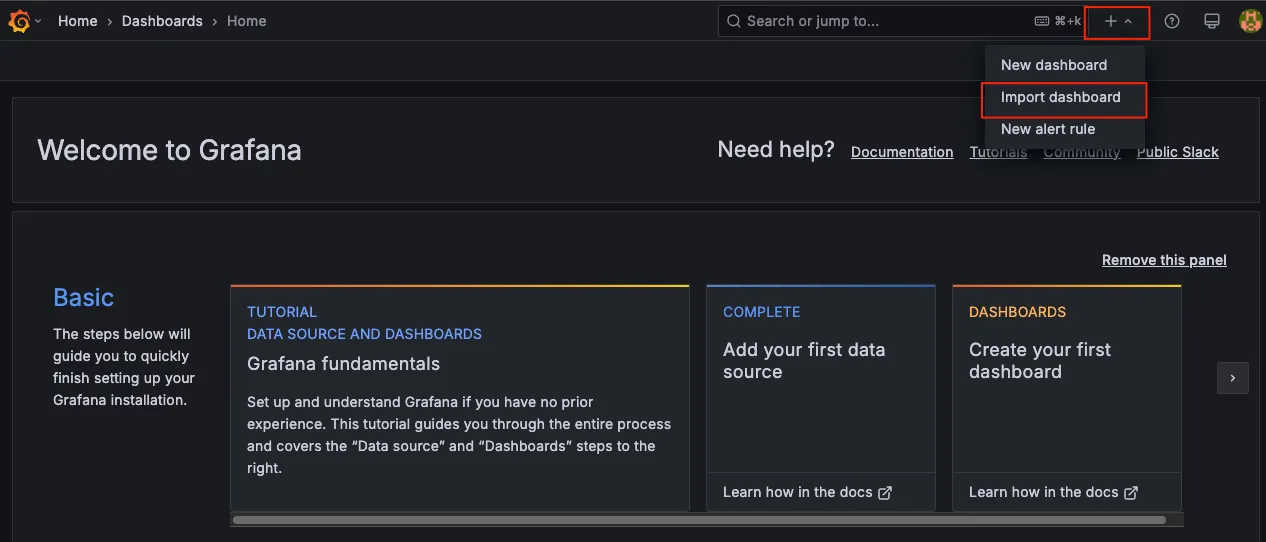
우측 상단의 + 버튼을 누르고 import dashboard를 클릭
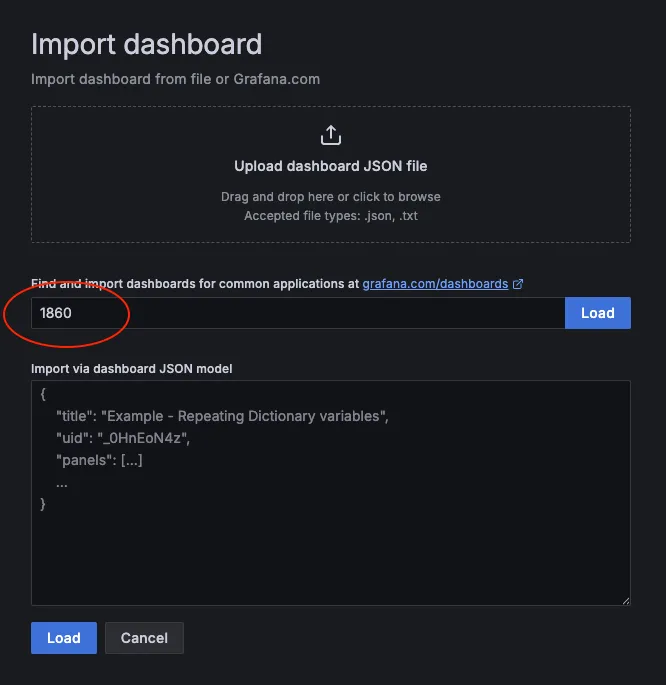
node exporter 기본 템플릿을 불러옵니다.
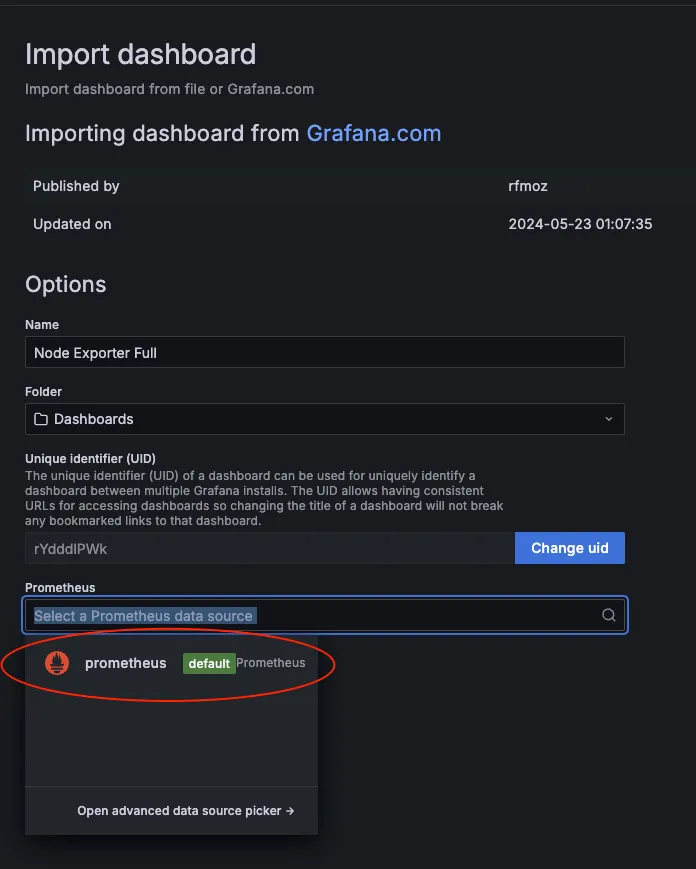
데이터 소스를 프로메테우스로 선택해주면
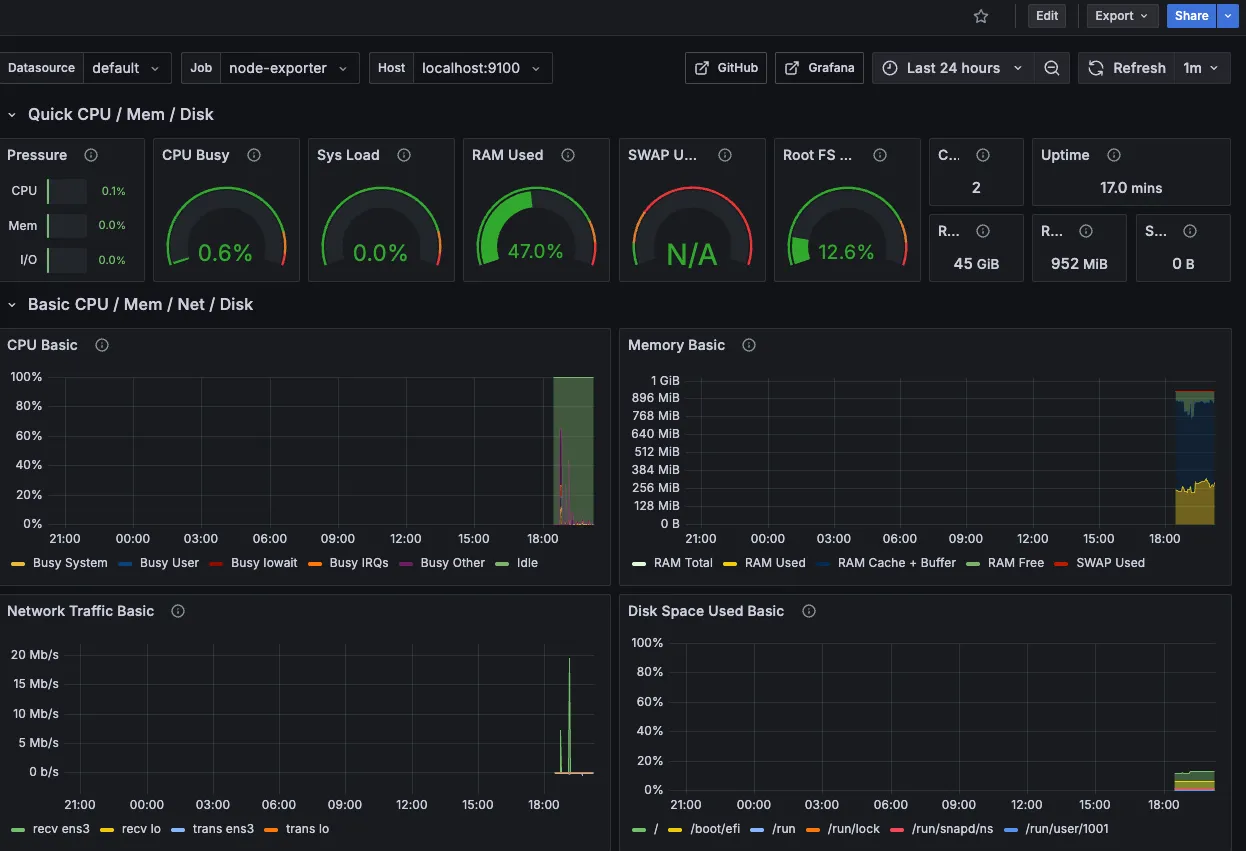
대시보드 설정 완료입니다.