만약 내가 대규모 공장의 책임자라면 공장시스템이 아무 일 없이 잘 돌아가길 바랄 것이다. 하지만 시스템이 언제나 늘 정상적으로 흘러가지 않을 수 있다. 가끔 오류가 나기도 할 것이다. 이때 나는 이 오류에 대한 이상징후를 빠르게 파악해서 미리 대비한다면 큰 손실을 막을 수 있을 것이다.
그래서 기존의 데이터들을 이용해, 이상한 데이터를 찾아내어 정상적인 흐름을 만들어낸 후 갑자기 이상치가 보인다 한다면 그것에 대한 대비를 할 수 있다는 뜻이다.
데이터의 오염
생성/측정 단계
- 관측자의 실수 (휴먼에러)
- 측정 장비의 오류
수집/전달 단계
- 데이터 수집 프로그램의 오류 (버그)
- 데이터 관리자의 실수 (휴먼에러)
- 데이터 전달 프로그램의 오류 (Open API)
이상치 구분
- 이상치(Anomailies) = 극단치 + 특이치
- 극단치는 제거해야 모형에 좋다.
- 특이치는 남겨둬야 모형에 좋다.
극단치 outlier
- 통계적 자료 분석의 결과를 왜곡시키거나, 자료 분석의 적절성을 위협하는 변숫값 또는 사례
- 교정하지 않으면 자료 분석에 방해가 된다는 특징이 있다.
- 교정방법
- 참값으로 대체
- 보간으로 대체
- 삭제
특이치 Novelties
- 정상적인 수집과정에 의한 이상치(이전까지는 보지 못한 패턴이나 데이터)
- 특이치는 극단치와 다르게 원본데이터를 수정하지 않는다. 나중에 특이치가 또 생기면 모델이 대처해야하기 때문이다. 예를들어 코스피데이터에서 코로나로 인한 주식하락 같은 것도 일종의 특이치라고 볼 수 있다.
이상치 탐색 방법
전제 : 대부분의 데이터는 참이고, 이상한 데이터는 극히 일부일 것
1) 재측정
시계열데이터의 특성 상 과거로 돌아가 다시 측정하는 방법은 불가
2) Supervised
- 같은 데이터의 다른 출처를 찾아 비교
- 각 데이터를 비교해 다른 데이터를 찾는다.
- 서로 같은 데이터는 정상으로 분류
- 서로 다른 데이터 중 '더 이상한' 데이터를 이상치로 분류
- 라벨링된 분류 결과로 이상치 탐색 모델을 학습
3) Unsupervised
- 데이터 스스로의 특징을 활용해서 찾아냄
- 대부분의 데이터는 참이라는 전제하에 이상치를 찾아내는 것
- 데이터의 스스로의 특징을 분석
- 특정 기준보다 '더 이상한'데이터를 이상치로 분류
4) Auto encoder
- 오토인코더는 인코더와 디코더로 구성
- 인코더는 입력데이터로부터 중요한 정보(Compressed Feature Vector)를 뽑아낸다.
- 이 과정에서 입력데이터보다 압축된 형태의 데이터를 얻는다.
- 디코더는 중요한 정보로 입력데이터와 유사한 형태를 재생성(Generate)한다.
인코더가 중요한 정보를 잘 뽑아낸다면 디코더는 입력데이터를 거의 똑같이 생성해낼 수 있다. 그렇게 되면 비정상적인 데이터들은 디코더가 똑같이 생성하기 어려울 것이다.
ex 1) 주가데이터는 여러 곳에서 제공하고 있다. 만약 네이버의 주가데이터가 의심된다면 어떻게 이상치를 찾아낼 수 있을까? → 다른 곳에서 제공하는 같은 데이터와 비교해보고 찾아낼 수 있다.
ex 2) 기상청데이터를 수집했는데 1~3시 기온이 20,45,22라고 나왔다. 이 때 어떻게 이상치를 찾아낼 수 있을까? → 다른 곳에서 제공하는 같은 데이터가 없다면, 기온의 분포를 파악하여 그 분포에서 크게 벗어난 기온을 이상치로 판단할 수 있다.
z-test(신뢰구간 이상치 탐색)
데이터가 정규분포를 따를 때 사용가능한 신뢰구간으로 이상치 탐색
어떤 데이터가 평균과 표준편차로 주어지는 정규분포를 따른다면 아주 높은 확률로 그 데이터는 어떤 신뢰구간내에 있을 거라고 가정할 수 있으며 그 신뢰구간 밖에 있는 데이터는 이상치라고 판단할 수 있을 것이다.
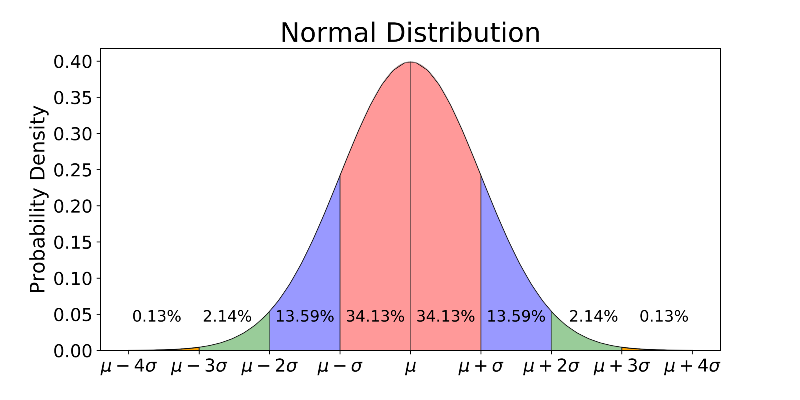
- 2σ 기준 : 95.5% 정상, 4.5% 이상치
- 3σ 기준 : 99.7% 정상, 0.27% 이상치
데이터가 정규분포를 따를 때만 쓸 수 있는 것은 아니다. 데이터가 t-분포 등 특정 확률분포에 피팅이 된다면 그 확률분포의 신뢰구간 결정 방법을 적용할 수 있다.
Time series decomposition
시계열 데이터 중에서 정규분포에 가까운 데이터를 뽑아내는 방법
-
Stationary
- 정상성 또는 안정성
- 평균, 분산, 공분산이 일정한 Stationary 시계열에 대해서만 미래 예측이 가능하다
-
시계열 데이터는 Stationary하지 않고 계속 변화하는 패턴을 보이는데, 이때 시계열을 Stationary한 컴포넌트와 Non-Stationary한 컴포넌트로 나누어 분석하기 위해 주로 사용하는 기법
-
Time series decomposition을 통해 시계열 데이터는 3가지 성분으로 분리되고, 그중 Residual 성분의 데이터가 Stationary에 가까운 형태를 가진다.
-
Stationary에 가까운 데이터는 정규분포를 따른다. 이 residual 데이터를 사용해 신뢰구간을 구할 수 있다.
-
시계열데이터의 3가지 성분
- trend 추세
- seasonality 계절성
- residual 잔차
-
Time series decomposition
- additive 방법
- Observed[t] = trend[t] + seasonal[t] + resid[t]
- multiplicative 방법
- Observed[t] = trend[t] x seasonal[t] x resid[t]
- 위 식의 양변에 로그를 취하면 결과적으로 additive와 동일한 결과가 얻어진다.
- additive 방법
신뢰구간 방법의 한계점
다양한 데이터로 신뢰구간을 찾아낼 때 몇십 개가 아니라 몇백 개, 몇천 개가 될 수 있다. 그래서 다양한 데이터로 더 그럴싸한 이상치를 찾아낸 다음, 노가다를 최소한으로 하는 방법인 Multi-variable Anomaly Detection을 사용할 수 있다.
- Clustering
- 클러스터링으로 묶으면 정상인 데이터끼리 이상한 애들끼리 그룹핑되니 이상한 그룹을 찾는다.
- 입력된 데이터들을 유사한 몇개의 그룹으로 분류해줄 때,
- k-means : 몇개의 그룹으로 묶는지 미리 지정해준다.
- 소수 그룹이 형성될 만큼 충분한 그룹수로 클러스터링한다
- 소수 그룹의 특징을 분석한다
- 해당 소수 그룹들이 이상치인지 추론해본다.
- DBSCAN : 미리 지정해줄 필요가 없다.
- 핵심벡터와 일정 거리 ϵ이내인 데이터 벡터들이 군집(Cluster)을 이루게 하는데, 그러한 군집들과 거리상 동떨어져 군집에 들지 못하는 특이한 데이터들을 노이즈(Noise) 벡터라고 부르며, 이 노이즈벡터를 찾음으로써 이상치를 찾는 것이다.
- k-means : 몇개의 그룹으로 묶는지 미리 지정해준다.
- Forecasting : 시계열 예측모델을 만들어서, 예측 오차가 크게 발생하는 지점은 이상한 상황이다. 일반적으로 Auto-Encoder로 탐색한다.
예제
주가데이터
Open(시가), High(고가), Low(저가), Close(종가), Adj Close(보정종가), Volume(거래량)
1. 오류가 반영된 데이터 다운로드
$ wget https://aiffelstaticprd.blob.core.windows.net/media/documents/kospi.csv2. 데이터 결측치 확인
import os
import pandas as pd
import requests


df = pd.read_csv(csv_file)

# 날짜데이터를 Datetime 형식으로 바꿔준다
df.loc[:,'Date'] = pd.to_datetime(df.Date)

# 데이터의 정합성을 확인한다
df.isna().sum()

print("삭제 전 데이터 길이(일자수):",len(df))
df = df.dropna(axis=0).reset_index(drop=True)

print("삭제 후 데이터 길이(일자수):",len(df))
df.isna().sum()
삭제 전 데이터 길이(일자수): 5842
삭제 후 데이터 길이(일자수): 56923. 주식데이터 그래프로 그려 확인
import matplotlib.pyplot as plt
from matplotlib.pylab import rcParams

plt.rcParams["figure.figsize"] = (10,5)
# Line Graph by matplotlib with wide-form DataFrame

plt.plot(df.Date, df.Close, marker='s', color='r')
plt.plot(df.Date, df.High, marker='o', color='g')
plt.plot(df.Date, df.Low, marker='*', color='b')
plt.plot(df.Date, df.Open, marker='+', color='y')

plt.title('KOSPI ', fontsize=20)
plt.ylabel('Stock', fontsize=14)
plt.xlabel('Date', fontsize=14)
plt.legend(['Close', 'High', 'Low', 'Open'], fontsize=12, loc='best')

plt.show()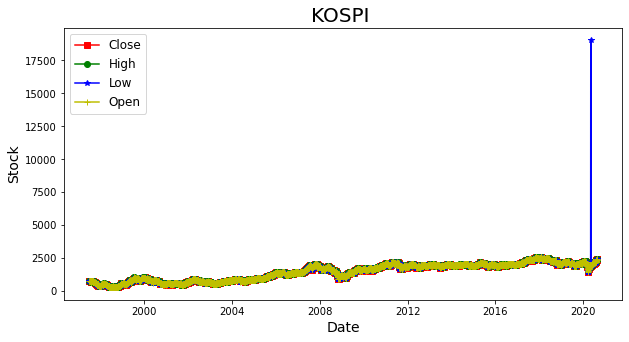
2020년 이후 파란색 low가격에 이상한 값이 혼자 올라가 있는 부분이 확인된다.
4. 구체적인 수치 확인
# low가 high보다 높은 행을 반환
df.loc[df.Low > df.High]
해결 - Supervised
print(df.loc[df.Date == '2020-05-06', 'Low'])
# 카카오 주식차트 결과로 대체
df.loc[df.Date == '2020-05-06', 'Low'] = 1903

# 비정상데이터가 제거되었는지 다시 확인
df.loc[df.Low>df.High]
해결 - Unsupervised
z-test
정규분포를 따르는지 확인하는 방법
# 위 주식 데이터의 분포 확인
fig, ax = plt.subplots(figsize=(9,6))
_ = plt.hist(df.Close, 100, density=True, alpha=0.75)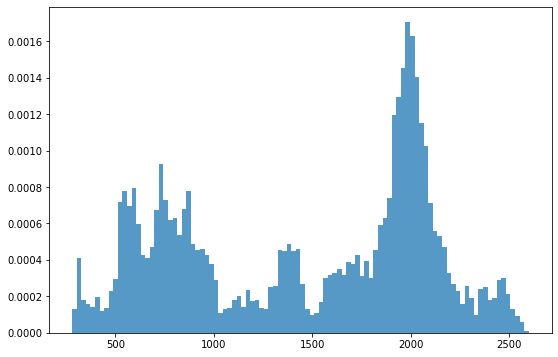
한눈에 봐도 정규분포와 가까워보이지 않는다.
그저 눈으로 아닌 숫자로 판단해보자. 단변수의 정규분포 여부는 z-test 방법으로 확인할 수 있다.
z-test 참고 블로그
from statsmodels.stats.weightstats import ztest

_, p = ztest(df.Close)
print(p) # 0- p가 0.05이하로 나온다면 정규분포와는 거리가 멀다는 뜻이다.
- 즉, 이런 데이터로 정규분포를 가정한 신뢰구간 분석은 적용하기 어렵다.
Time series decomposition
시계열 데이터 중에서 정규분포에 가까운 데이터를 뽑아내는 방법
☞ additive 방법
from statsmodels.tsa.seasonal import seasonal_decompose

# 계절적 성분 50일로 가정
# extrapolate_trend='freq' : Trend 성분을 만들기 위한 rolling window 때문에 필연적으로 trend, resid에는 Nan 값이 발생하기 때문에, 이 NaN값을 채워주는 옵션이다.
result = seasonal_decompose(df.Close, model='additive', two_sided=True,
                            period=50, extrapolate_trend='freq')
result.plot()
plt.show()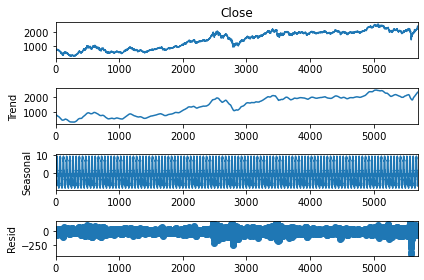
# seasonal 성분은 너무 빼곡하게 보여 다시 확인.
result.seasonal[:100].plot()
# -8 ~ 10 사이를 주기적으로 반복하는게 보인다.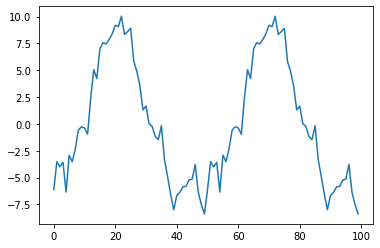
잔차는 평균 0을 기준으로 분포하고 있으므로, 잔차가 큰 날은 일반적인 추세나 계절성에서 벗어난 날로 해석될 수 있다.
# Residual의 분포 확인
fig, ax = plt.subplots(figsize=(9,6))
_ = plt.hist(result.resid, 100, density=True, alpha=0.75)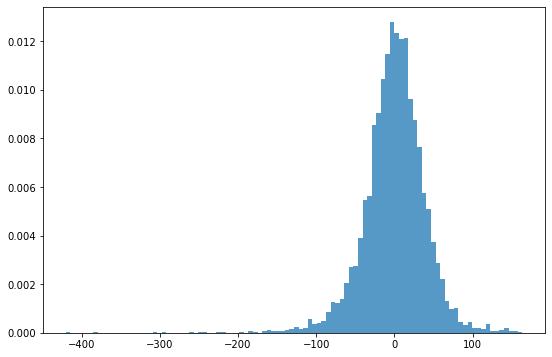
z-test를 통해 숫자로 다시 확인
r = result.resid.values
st, p = ztest(r)
print(st,p)  # -0.6804023554131796 0.4962497300226193
p-value가 0.05이상으로 나오므로, 데이터 분포가 정규분포를 잘 따르고 있다고 판단할 수 있다.
평균을 기준으로 +/- 3σ를 벗어나는 데이터를 찾아본다.
# 평균과 표준편차 출력
mu, std = result.resid.mean(), result.resid.std()
print("평균:", mu, "표준편차:", std)
# 평균: -0.3595321143716522 표준편차: 39.8661527194307

# 3-sigma(표준편차)를 기준으로 이상치 판단
print("이상치 갯수:", len(result.resid[(result.resid>mu+3*std)|(result.resid<mu-3*std)]))
# 이상치 갯수: 71df.Date[result.resid[(result.resid>mu+3*std)|(result.resid<mu-3*std)].index]2475 2007-07-20
2476 2007-07-23
2477 2007-07-24
2478 2007-07-25
2493 2007-08-16
...
5595 2020-03-26
5596 2020-03-27
5597 2020-03-30
5599 2020-04-01
5642 2020-06-05
Name: Date, Length: 71, dtype: datetime64[ns]2008년 금융위기와 2020년 코로나 위기가 있던 시기가 주로 잡힌 것이 확인된다. 이는 이상치 중 특이치로 판단할 수 있다.
Multi-variable Anomaly Detection - Clustering
위에서는 close(종가)만 사용했다면 이 방법에는 5가지 데이터 모두 사용한다.
위 방식들과 동일하게 Trend/Seasonal 성분을 제거해야 '정말 튀는' 데이터를 찾아낼 수 있다.
같은 방법으로 5가지 모두 time series decompose로 전처리 해준다.
# 데이터 전처리
def my_decompose(df, features, freq=50):
    trend = pd.DataFrame()
    seasonal = pd.DataFrame()
    resid = pd.DataFrame()

    # 사용할 feature 마다 decompose를 수행한다.
    for f in features:
        result = seasonal_decompose(df[f], model='additive', period=freq, extrapolate_trend=freq)
        trend[f] = result.trend.values
        seasonal[f] = result.seasonal.values
        resid[f] = result.resid.values

    return trend, seasonal, resid

# 각 변수별 트렌드/계절적/잔차
tdf, sdf, rdf = my_decompose(df, features=['Open','High','Low','Close','Volume'])
tdf.describe()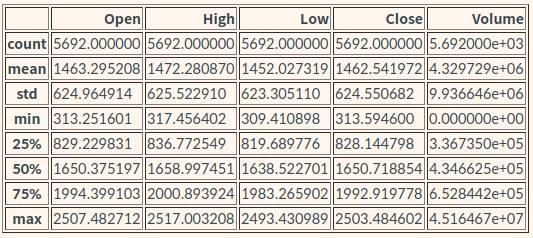
rdf.describe()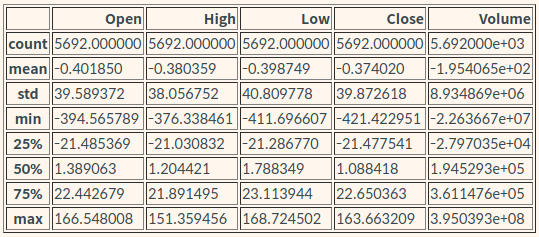
각 변수마다의 잔차(residual)을 살펴보면 Volume의 숫자가 혼자 너무 큰데, 이 데이터를 그대로 사용하게 되면 volume이 가장 중요하게 반영될 것이다. 그러므로 한쪽으로 쏠리는 것을 방지해주기 위해 표준정규화 해준다.
# 표준정규화
from sklearn.preprocessing import StandardScaler

scaler = StandardScaler()
scaler.fit(rdf)
print(scaler.mean_)
# [-0.40184982  -0.38035856  -0.39874878  -0.37402025 -195.40645742]

norm_rdf = scaler.transform(rdf)
norm_rdf
array([[-2.11078435e+00, -1.81469803e+00, -2.05551226e+00,
-1.78975878e+00, 2.10763080e-02],
[-1.57245471e+00, -1.31620670e+00, -1.54326110e+00,
-1.29206209e+00, 3.44552935e-03],
[-1.16743672e+00, -1.15447694e+00, -1.25272255e+00,
-1.24664060e+00, -1.95018959e-04],
...,
[ 1.40187705e+00, 2.03518846e+00, 1.80321776e+00,
2.10596922e+00, 6.12871509e-02],
[ 1.72956122e+00, 1.93639106e+00, 1.59747384e+00,
2.26635573e+00, 3.75265169e-02],
[ 2.56782539e+00, 2.43952406e+00, 1.89411956e+00,
2.24061341e+00, 1.51850684e-02]])Clustering : k-means 로 이상치 탐색
k-means을 이용해서 정상 데이터그룹과 이상치 데이터그룹을 나눈다.
from sklearn.cluster import KMeans

kmeans = KMeans(n_clusters=2, random_state=0).fit(norm_rdf)
print(kmeans.labels_) # 분류된 라벨은 이렇게 kemans.labels_ 로 확인
# [1 1 1 ... 0 0 0]


# 라벨은 몇번 그룹인지 뜻한다.
# return_counts=True : 몇개의 샘플이 몇번 그룹에 할당되었는지 확인
lbl, cnt = np.unique(kmeans.labels_,return_counts=True)
print(lbl) # [0 1]  -> 0번 그룹, 1번 그룹으로 나뉨
print(cnt) # [3258 2434]  -> 0번그룹에 3258, 1번그룹에 2434
분류가 크게 차이가 없어 어느 한 쪽을 이상치로 판단하기에는 어려워, 그룹 숫자를 늘려 분석해보자.
from sklearn.cluster import KMeans

kmeans = KMeans(n_clusters=15, random_state=0).fit(norm_rdf)
lbl, cnt = np.unique(kmeans.labels_,return_counts=True,)
['group:{}-count:{}'.format(group, count) for group, count in zip(lbl, cnt)]
['group:0-count:1002',
'group:1-count:535',
'group:2-count:47',
'group:3-count:2',
'group:4-count:336',
'group:5-count:868',
'group:6-count:210',
'group:7-count:820',
'group:8-count:8',
'group:9-count:142',
'group:10-count:1007',
'group:11-count:55',
'group:12-count:2',
'group:13-count:591',
'group:14-count:67']3, 8, 12 그룹이 count가 10개 이내로 특이그룹으로 분류되었다. 이를 이상치로 판단할 수 있다.
이 그룹에 대한 이상치를 분석해보자.
✅ 1. 어떤 날들이 분류된 건지
df[(kmeans.labels_==3)|(kmeans.labels_==8)|(kmeans.labels_==12)]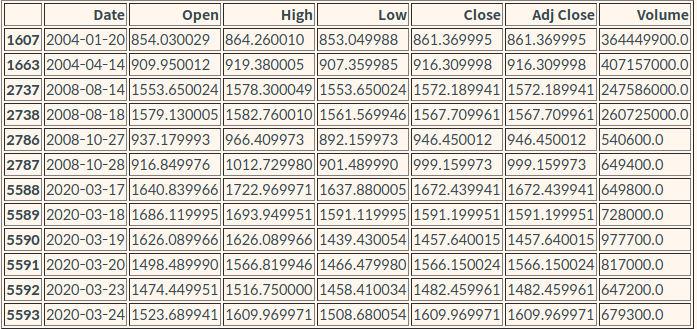
df.describe()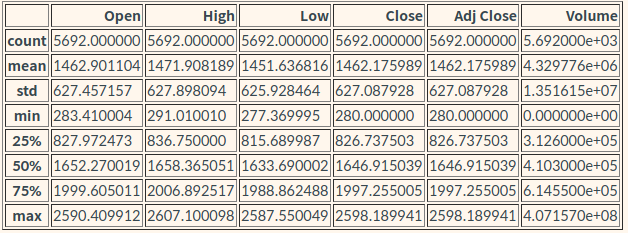
# 2004-04-14 주변 정황
df.iloc[1660:1670]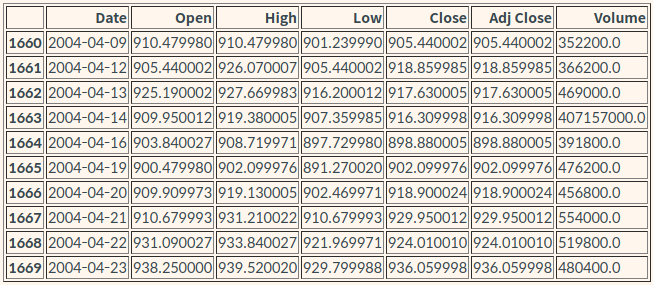
✅ 2. 각 그룹은 어떤 특징을 갖고 있는지
# 각 그룹의 중심부는 어떤 값을 가지고 있는지 확인
pd.DataFrame(kmeans.cluster_centers_, columns=['Open','High','Low','Close','Volume'])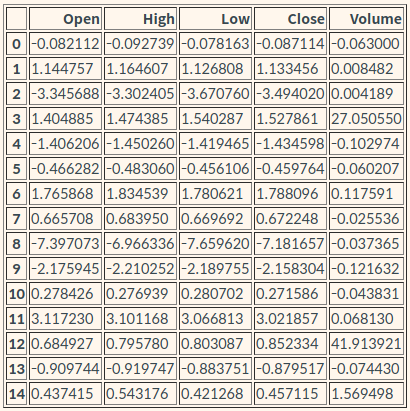
- Volume 수치가 매우 큰 그룹 : 3, 12
- Open, High, Low, Close 수치가 유독 낮은 그룹 : 8
✅ 3. 왜 이상치로 분류된걸까?
- 3, 12번 그룹의 거래량은 비정상적이다.
- df.describe()로 알아본 전체 평균 거래량 : 4,329,776
- 3,12번 그룹은 평균 대비 60배 이상 많다.
- 이곳에서 3,12값들이 맞는지 확인해볼 수 있다.
- 확인 결과 야후 파이낸스의 실수임이 확인되었다.
- 3, 12번 그룹의 거래량은 /1000을 해야 정상적인 값이 된다.
- 9번 그룹 : 코스피 역사상 가장 큰 폭락장
fig = plt.figure(figsize=(15,9))
ax = fig.add_subplot(111)
df.Close.plot(ax=ax, label='Observed', legend=True, color='b')
tdf.Close.plot(ax=ax, label='Trend', legend=True, color='r')
rdf.Close.plot(ax=ax,label='Resid', legend=True, color='y')
plt.show()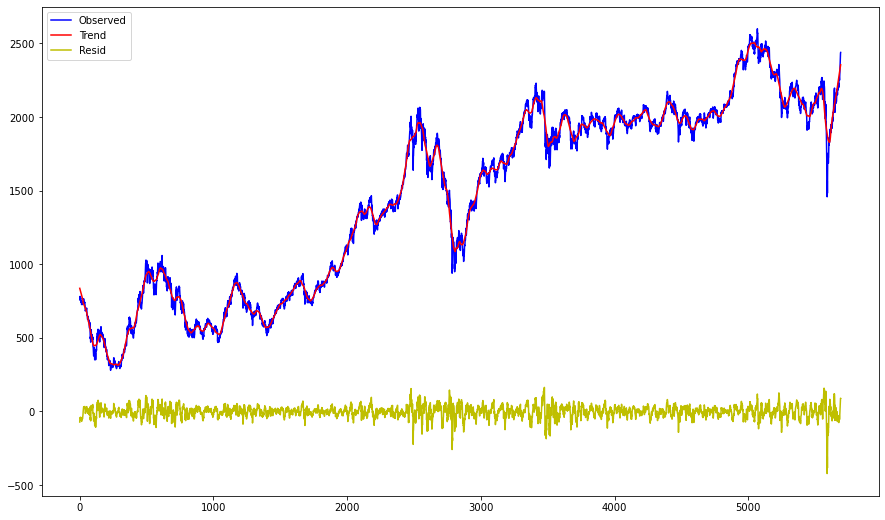
- 파랑: 실제 코스피지수, 빨강: 트렌드, 노랑: 잔차
- 코로나때문에 2020년 3월 발생한 폭락장으로 인해 아래로 깊게 파인 잔차가 보인다.
- 즉 예상하지 못한 이상치가 맞다.
Clustering : DBSCAN로 이상치 탐색
from sklearn.cluster import DBSCAN

clustering = DBSCAN(eps=0.7, min_samples=2).fit(norm_rdf)
print(clustering)  # BSCAN(eps=0.7, min_samples=2)
print(clustering.labels_)  # [0 0 0 ... 0 0 0]

lbl, cnt = np.unique(clustering.labels_,return_counts=True)
['group:{}-count:{}'.format(group, count) for group, count in zip(lbl, cnt)]
['group:-1-count:41',
'group:0-count:5646',
'group:1-count:3',
'group:2-count:2']해결 - Auto encoder
LSTM 을 이용한 오토인코더 모델 만들기
import os
import tensorflow as tf
from tensorflow.keras.preprocessing.sequence import TimeseriesGenerator
from tensorflow.keras.models import Sequential
from tensorflow.keras.layers import Dense, Dropout, LSTM, RepeatVector, TimeDistributed
from tensorflow.keras.losses import Huber
from tensorflow.keras.callbacks import ModelCheckpoint, EarlyStopping
from sklearn.preprocessing import StandardScaler


# 모델 재현성을 위해 난수 시드설정
tf.random.set_seed(777)
np.random.seed(777)

# 데이터 전처리 - 하이퍼 파라미터
window_size = 10
batch_size = 32
features = ['Open','High','Low','Close','Volume']
n_features = len(features)
TRAIN_SIZE = int(len(df)*0.7)

# 데이터 전처리 - 표준정규분포화
scaler = StandardScaler()
scaler = scaler.fit(df.loc[:TRAIN_SIZE,features].values)
scaled = scaler.transform(df[features].values)

# keras TimeseriesGenerator를 이용해 데이터셋 만들기
train_gen = TimeseriesGenerator(
    data = scaled,
    targets = scaled,
    length = window_size,
    stride=1,
    sampling_rate=1,
    batch_size= batch_size,
    shuffle=False,
    start_index=0,
    end_index=None,
)

valid_gen = TimeseriesGenerator(
    data = scaled,
    targets = scaled,
    length = window_size,
    stride=1,
    sampling_rate=1,
    batch_size=batch_size,
    shuffle=False,
    start_index=TRAIN_SIZE,
    end_index=None,
)

print(train_gen[0][0].shape)  # (32, 10, 5)
print(train_gen[0][1].shape)  # (32, 5)


# 모델만들기
# 2개 층의 LSTM으로 인코더 만듬
# RepeatVector는 input을 window_size만큼 복사해줌
model = Sequential([
    # >> 인코더 시작
    LSTM(64, activation='relu', return_sequences=True, input_shape=(window_size, n_features)),
    LSTM(16, activation='relu', return_sequences=False),
    ## << 인코더 끝
    ## >> Bottleneck
    RepeatVector(window_size),
    ## << Bottleneck
    ## >> 디코더 시작
    LSTM(16, activation='relu', return_sequences=True),
    LSTM(64, activation='relu', return_sequences=False),
    Dense(n_features)
    ## << 디코더 끝
])


# 체크포인트
# 학습을 진행하며 validation 결과가 가장 좋은 모델을 저장해둠
checkpoint_path = os.getenv('HOME')+'/aiffel/anomaly_detection/kospi/mymodel.ckpt'
checkpoint = ModelCheckpoint(checkpoint_path,
                             save_weights_only=True,
                             save_best_only=True,
                             monitor='val_loss',
                             verbose=1)

# 얼리스탑
# 학습을 진행하며 validation 결과가 나빠지면 스톱. patience 횟수만큼은 참고 지켜본다
early_stop = EarlyStopping(monitor='val_loss', patience=5)

model.compile(loss='mae', optimizer='adam',metrics=["mae"])


hist = model.fit(train_gen,
          validation_data=valid_gen,
          steps_per_epoch=len(train_gen),
          validation_steps=len(valid_gen),
          epochs=50,
          callbacks=[checkpoint, early_stop])


model.load_weights(checkpoint_path)
# <tensorflow.python.training.tracking.util.CheckpointLoadStatus at 0x7fa7e4312910>
fig = plt.figure(figsize=(12,8))
plt.plot(hist.history['loss'], label='Training')
plt.plot(hist.history['val_loss'], label='Validation')
plt.legend()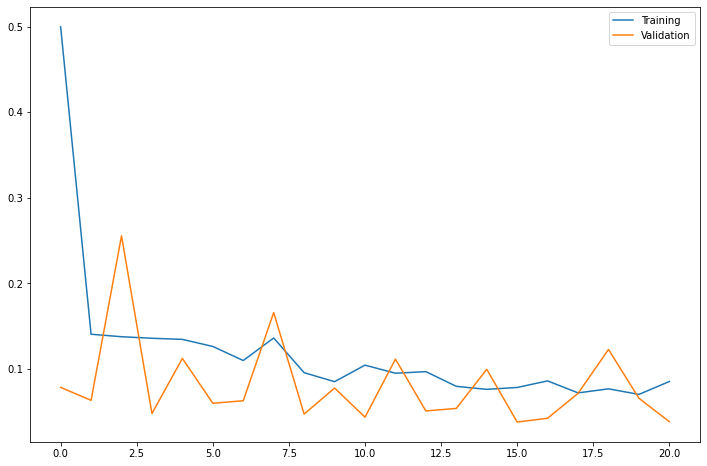
- 안정적으로 Training loss 가 수렴하고 Validation loss 가 발산하지 않음을 확인
- 시계열 데이터를 window_size 만큼 밀어가면서 예측하는 모델이라 train_gen의 길이는 원본 df의 길이보다 window_size만큼 짧다. 예측 결과와 비교할 때는 scaled의 앞에서 window_size만큼을 건너뛰어야한다.
# 예측 결과를 pred 로, 실적 데이터를 real로 받습니다
pred = model.predict(train_gen)
real = scaled[window_size:]

mae_loss = np.mean(np.abs(pred-real), axis=1)

# 샘플 개수가 많기 때문에 y축을 로그 스케일로 그립니다
fig, ax = plt.subplots(figsize=(9,6))
_ = plt.hist(mae_loss, 100, density=True, alpha=0.75, log=True)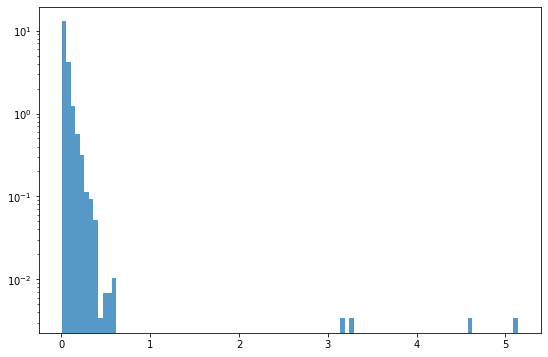
- mae_loss가 3 이상으로 동떨어진 샘플이 보인다.
import copy

test_df = copy.deepcopy(df.loc[window_size:]).reset_index(drop=True)
test_df['Loss'] = mae_loss

threshold = 3
test_df.loc[test_df.Loss>threshold]
기준치를 더 낮춰서 보다 많은 이상치 찾아보기
threshold = 0.3
test_df.loc[test_df.Loss>threshold]
그래프를 그려서 이상치 찾아보기
fig = plt.figure(figsize=(12,15))

# 가격들 그래프입니다
ax = fig.add_subplot(311)
ax.set_title('Open/Close')
plt.plot(test_df.Date, test_df.Close, linewidth=0.5, alpha=0.75, label='Close')
plt.plot(test_df.Date, test_df.Open, linewidth=0.5, alpha=0.75, label='Open')
plt.plot(test_df.Date, test_df.Close, 'or', markevery=[mae_loss>threshold])

# 거래량 그래프입니다
ax = fig.add_subplot(312)
ax.set_title('Volume')
plt.plot(test_df.Date, test_df.Volume, linewidth=0.5, alpha=0.75, label='Volume')
plt.plot(test_df.Date, test_df.Volume, 'or', markevery=[mae_loss>threshold])

# 오차율 그래프입니다
ax = fig.add_subplot(313)
ax.set_title('Loss')
plt.plot(test_df.Date, test_df.Loss, linewidth=0.5, alpha=0.75, label='Loss')
plt.plot(test_df.Date, test_df.Loss, 'or', markevery=[mae_loss>threshold])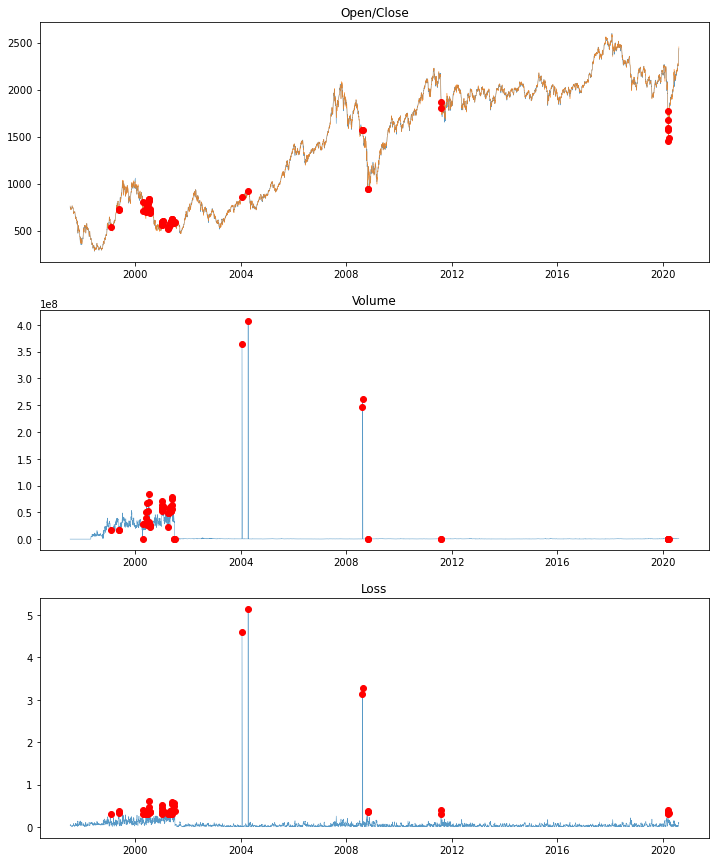

도움이 많이 됐습니다 감사합니다!