Bar plot
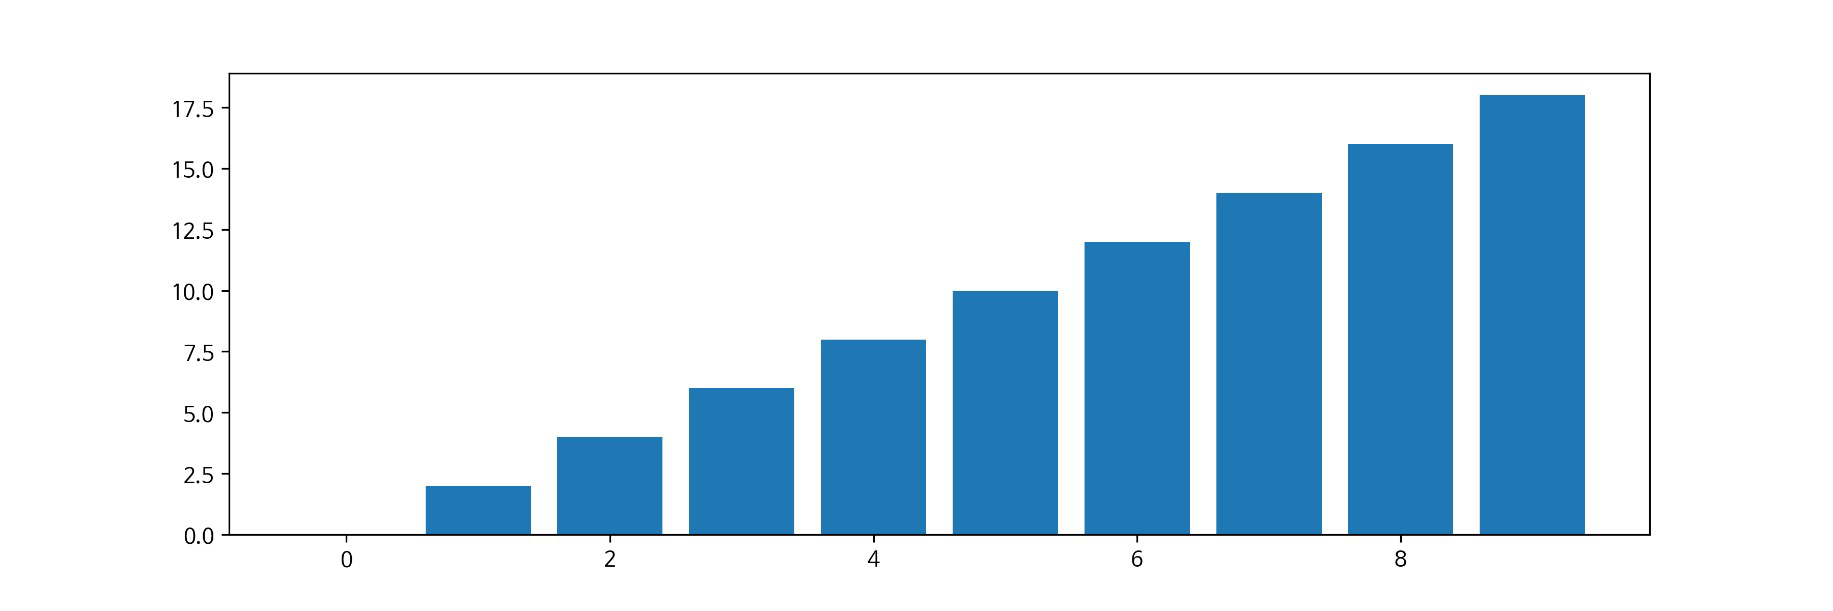
x = np.arange(10)
fig, ax = plt.subplots(figsize=(12, 4))
ax.bar(x, x*2)

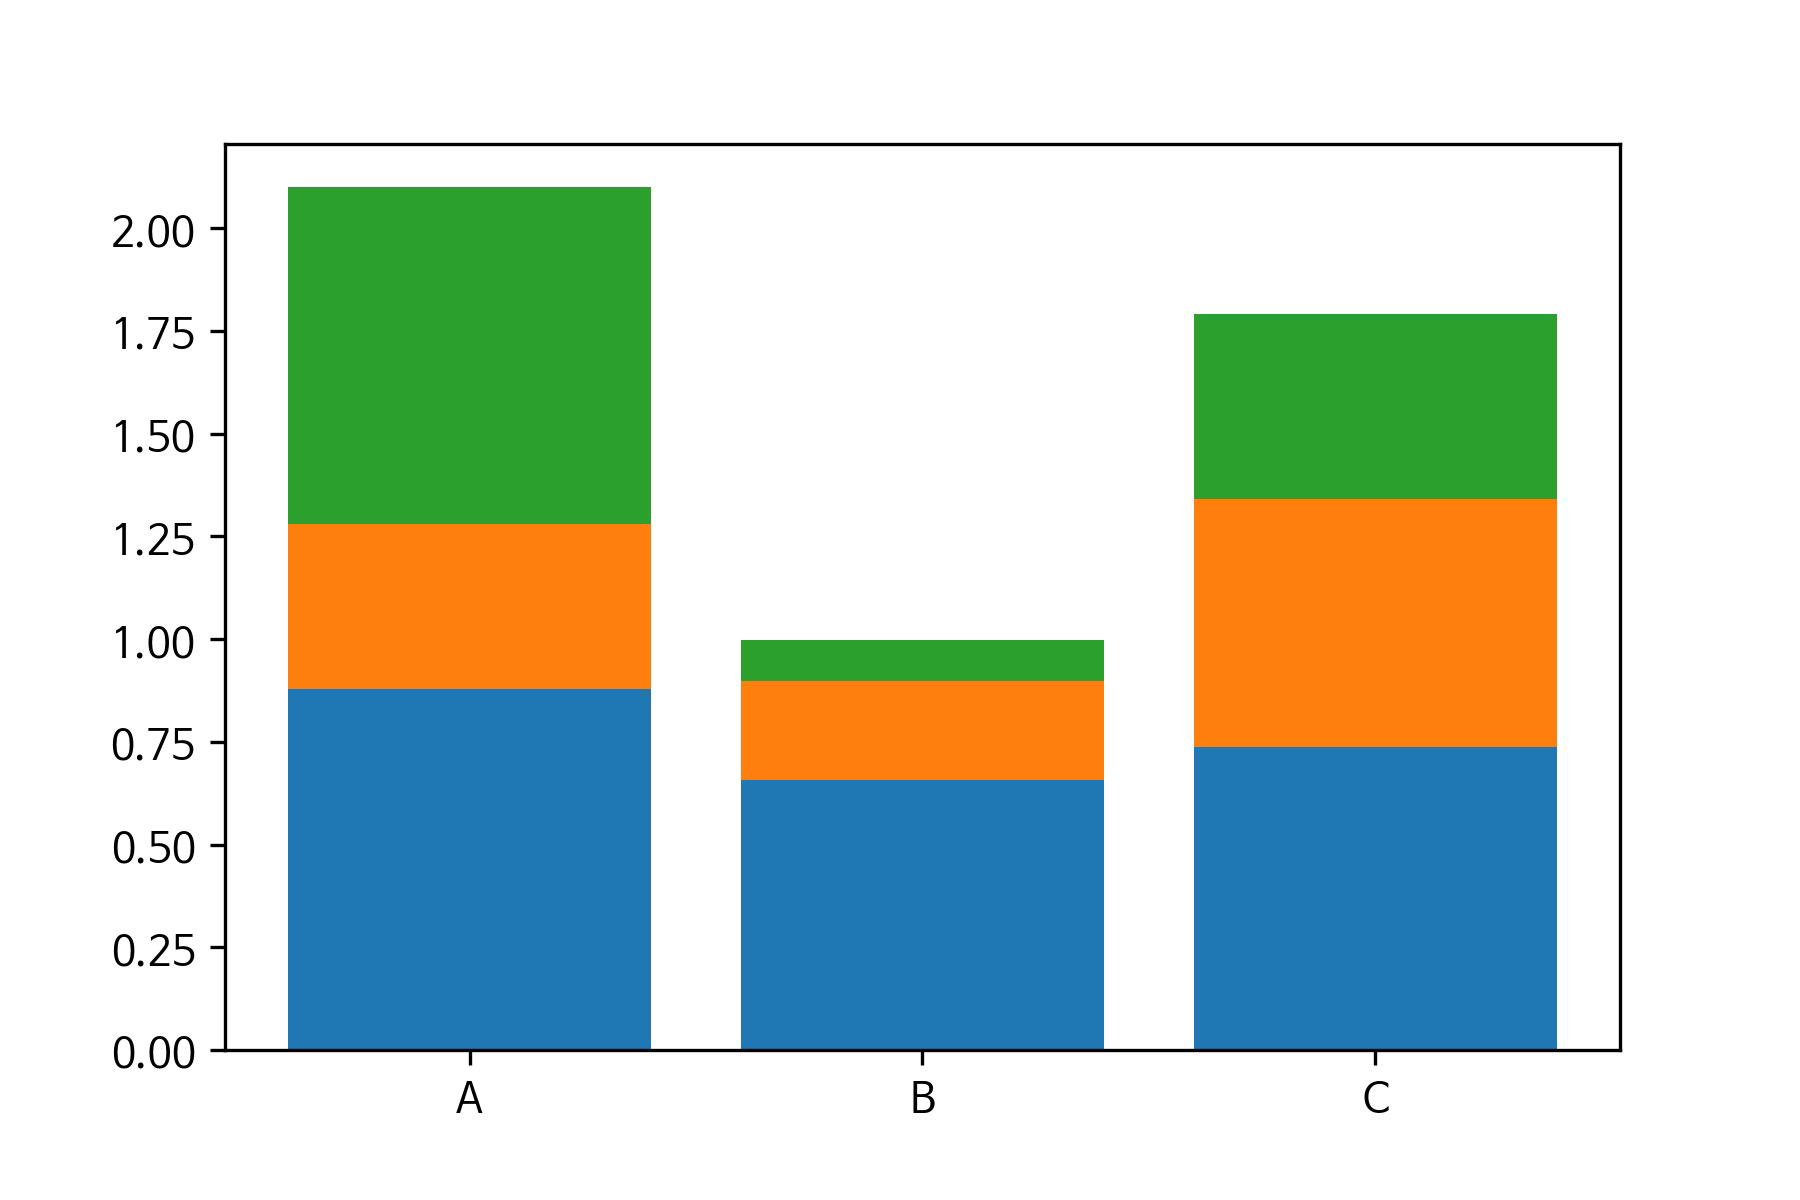
x = np.random.rand(3)
y = np.random.rand(3)
z = np.random.rand(3)
data = [x, y, z]
fig, ax = plt.subplots()
x_ax = np.arange(3)
for i in x_ax:
ax.bar(x_ax, data[i],
bottom=np.sum(data[:i], axis=0))
ax.set_xticks(x_ax)
ax.set_xticklabels(["A", "B", "C"])

Histogram
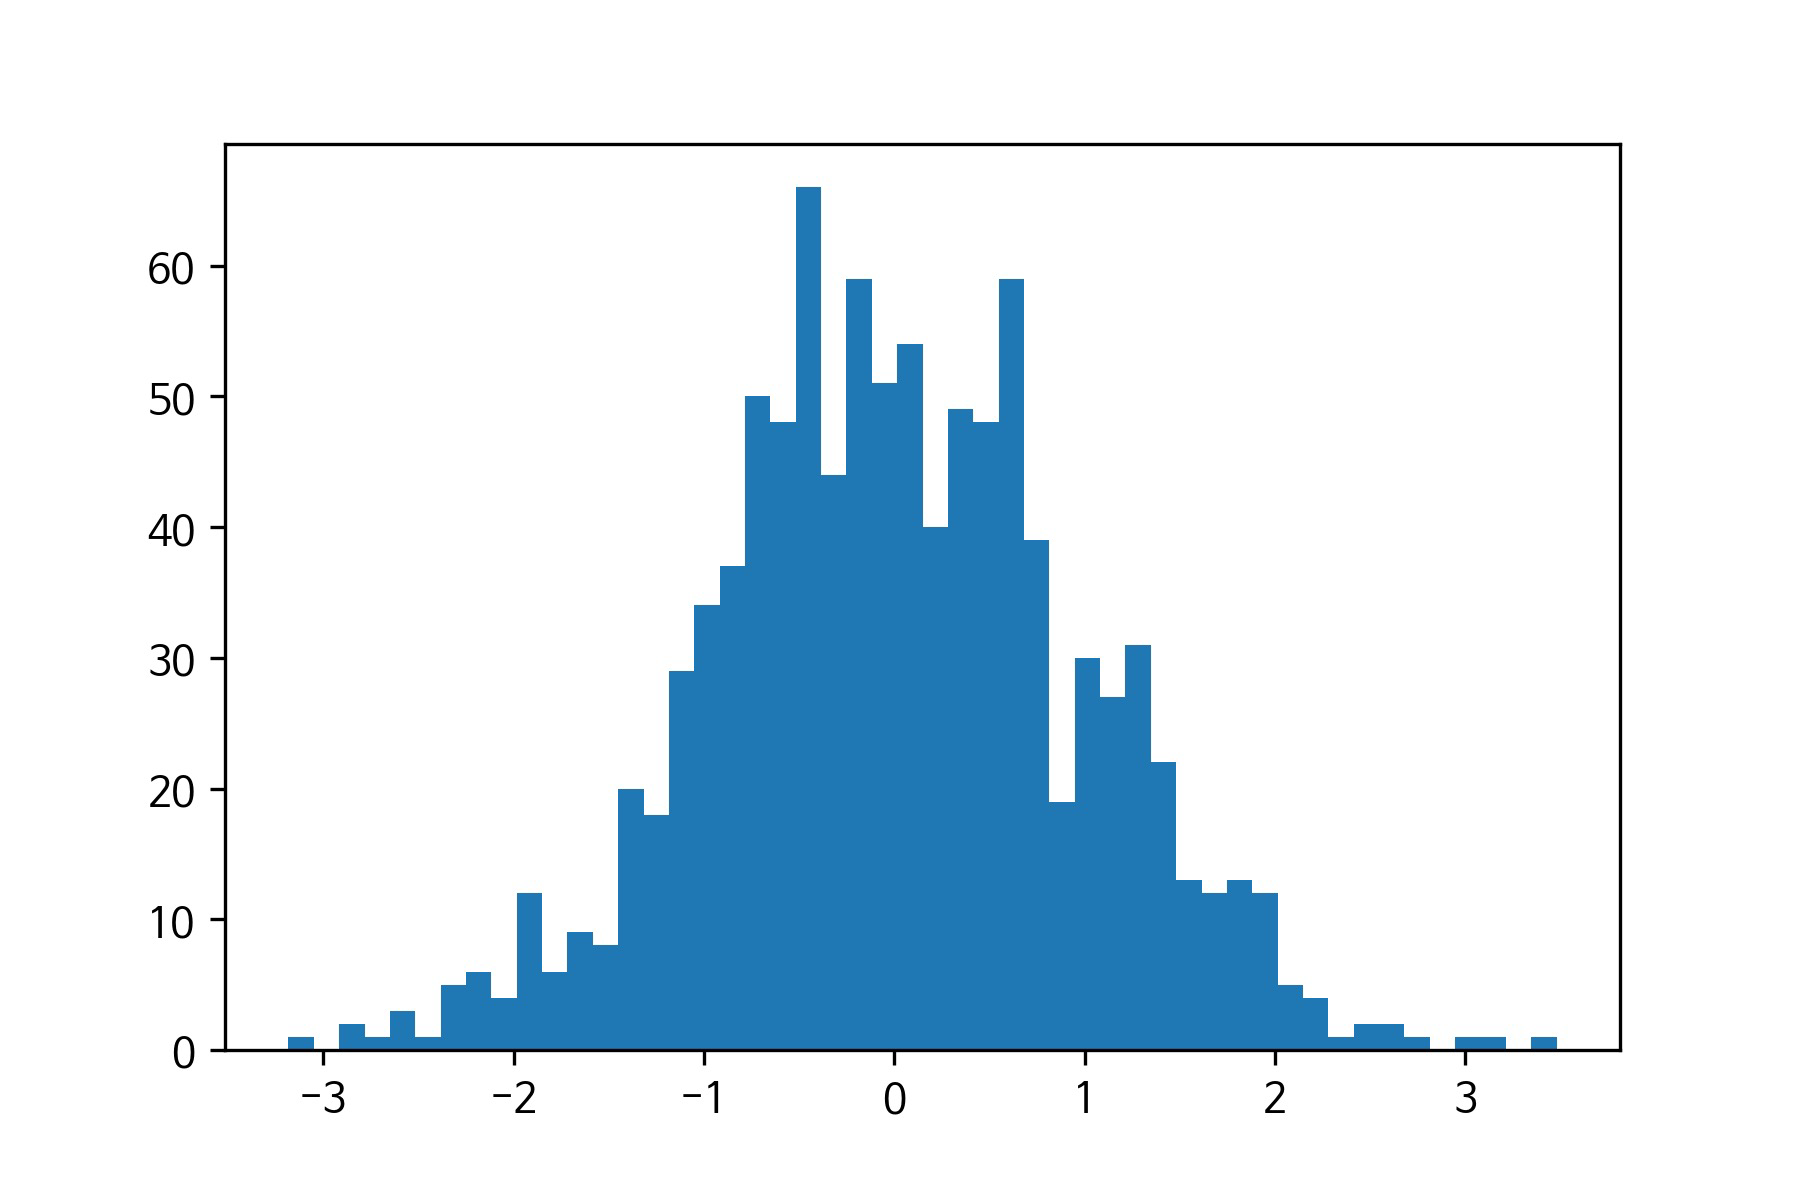
fig, ax = plt.subplots()
data = np.random.randn(1000)
ax.hist(data, bins=50)

[실습 3]막대 그래프 & 히스토그램
문제
x와 y 데이터는 각 스포츠의 종목과, 선호하는 학생의 수를 조사한 결과입니다.
x와 y 데이터로 막대 그래프를 그립니다.
z 데이터는 1000개의 정규분포 난수를 담고 있습니다.
z 데이터를 등급을 50개로 나눈 히스토그램으로 출력해봅니다.
- 막대 그래프의 데이터의 y축 값을 아래 표를 참고하여 변경하고 실행버튼을 눌러 그래프가 어떻게 변하는지 확인해보세요.
hist() 함수에서 bins 값을 200으로 변경하고 실행버튼을 눌러 그래프가 어떻게 변하는지 확인해보세요.
from elice_utils import EliceUtils
elice_utils = EliceUtils()
import numpy as np
import pandas as pd
import matplotlib.pyplot as plt
import matplotlib.font_manager as fm
fname='./NanumBarunGothic.ttf'
font = fm.FontProperties(fname = fname).get_name()
plt.rcParams["font.family"] = font
x = np.array(["축구", "야구", "농구", "배드민턴", "탁구"])
y = np.array([18, 7, 12, 10, 8])
z = np.random.randn(1000)
fig, axes = plt.subplots(1, 2, figsize=(8, 4))
axes[0].bar(x, y)
axes[1].hist(z, bins = 50)
fig.savefig("plot.png")
elice_utils.send_image("plot.png")
code
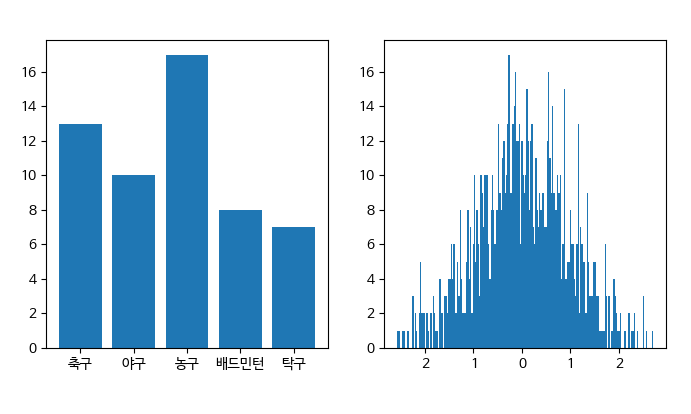
x = np.array(["축구", "야구", "농구", "배드민턴", "탁구"])
y = np.array([13, 10, 17, 8, 7])
z = np.random.randn(1000)
>
fig, axes = plt.subplots(1, 2, figsize=(8, 4))
>
axes[0].bar(x, y)
axes[1].hist(z, bins = 200)
실행 결과


