
Grafana
Grafana는 시계열 데이터(Time-series data)를 시각화하고 모니터링할 수 있는 오픈소스 대시보드 플랫폼이다.
주로 Prometheus, InfluxDB, Loki, Elasticsearch 등과 연동하여 시스템/인프라/애플리케이션 지표, 로그, 알람 등을 한눈에 파악할 수 있도록 도와준다.
-
다양한 데이터 소스로부터 수집된 정보를 시각화하는 오픈소스 분석 및 모니터링 플랫폼이다.
-
직관적인 대시보드를 통해 시스템 성능과 애플리케이션 상태를 실시간으로 모니터링할 수 있다.
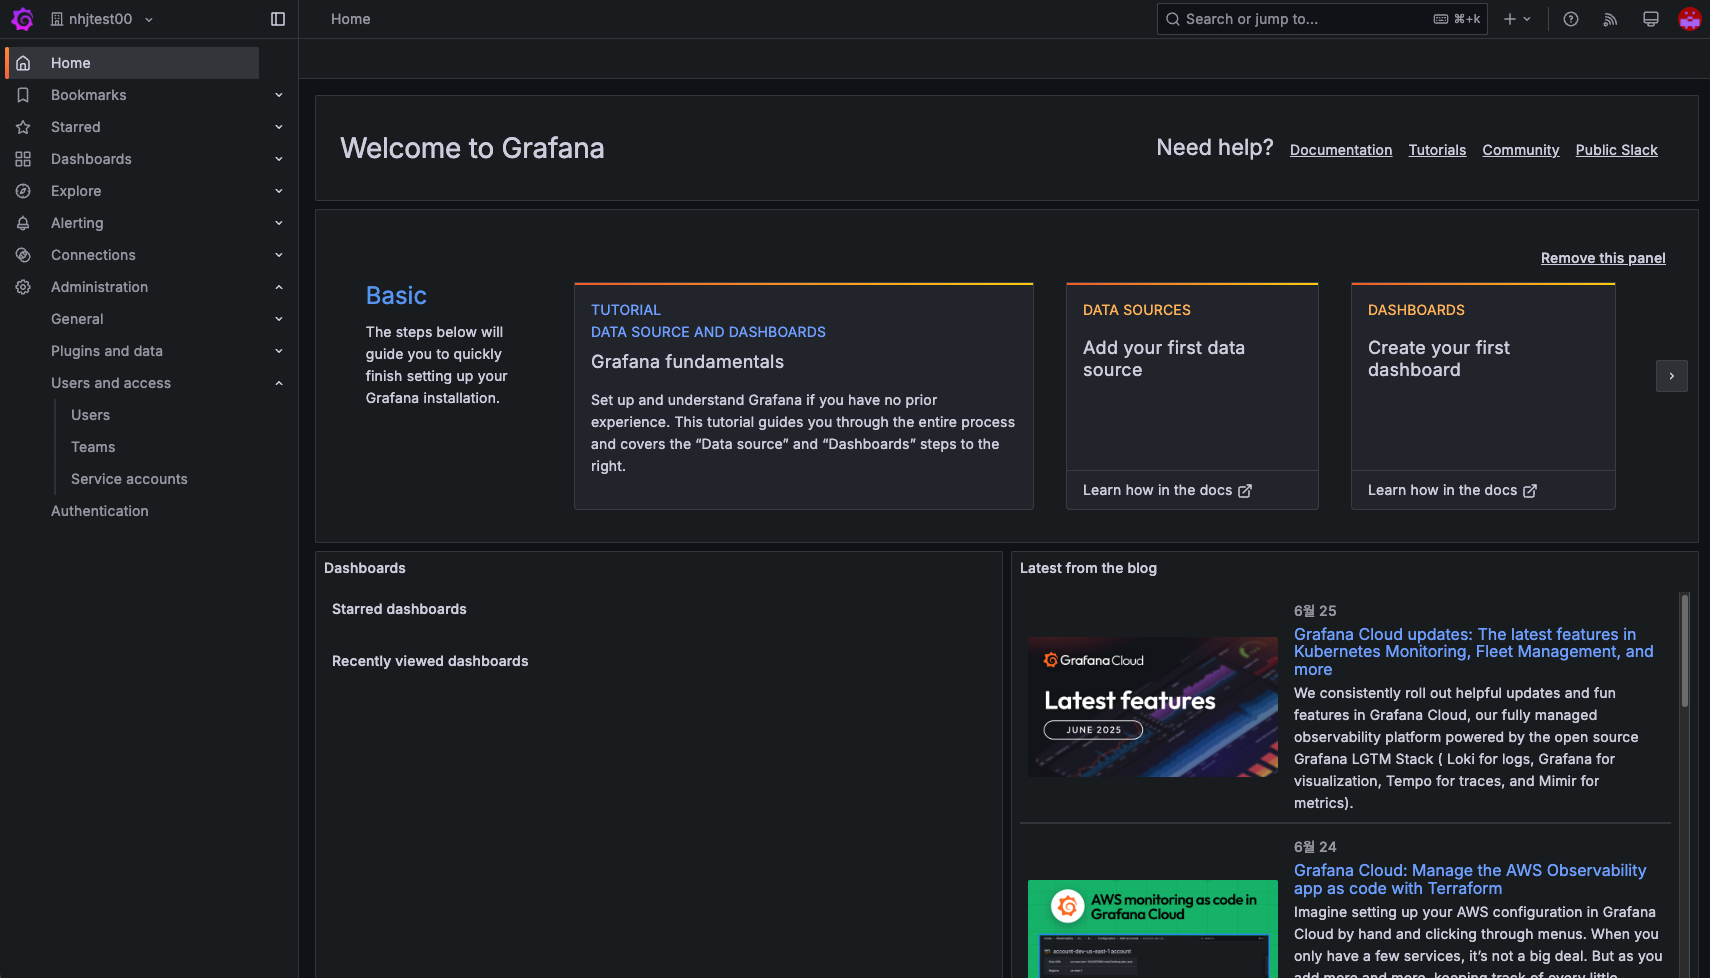
간단하게 Kubernetes 위에 Grafana를 배포하고 사용하는 방법을 정리해보았다.
추가로, keycloak OpenID Connect 연동도 함께 정리하였다.
1. 배포를 위한 yamls
Grafana는 이미 정보가 많고 배포가 쉽지만, OIDC 연동 내용과 Logo 변경이 있어 정리해 보았다.
deploy.yaml
apiVersion: apps/v1
kind: Deployment
metadata:
  name: grafana
  namespace: grafana
spec:
  replicas: 1
  selector:
    matchLabels:
      app: grafana
  template:
    metadata:
      labels:
        app: grafana
    spec:
      securityContext:
        fsGroup: 472
        runAsUser: 472
        runAsGroup: 472
      terminationGracePeriodSeconds: 60
      containers:
      - name: grafana
        image: grafana/grafana:latest
        ports:
        - name: grafana
          containerPort: 3000
          protocol: TCP
        volumeMounts:
        - name: grafana-config
          mountPath: /etc/grafana/grafana.ini
          subPath: grafana.ini
        - name: grafana-storage
          mountPath: /var/lib/grafana
        - name: custom-logo
          mountPath: /usr/share/grafana/public/img/grafana_icon.svg
          subPath: custom_logo.svg
        resources:
          requests:
            cpu: 750m
            memory: 1500Mi
          limits:
            cpu: 2000m
            memory: 16Gi
      volumes:
      - name: grafana-config
        configMap:
          name: grafana-config
      - name: grafana-storage
        persistentVolumeClaim:
          claimName: grafana-pvc
      - name: custom-logo
        configMap:
          name: custom-logo
---
apiVersion: v1
kind: Service
metadata:
  name: grafana
  namespace: grafana
spec:
  type: ClusterIP
  ports:
    - port: 3000
      targetPort: 3000
  selector:
    app: grafana
pvc.yaml
apiVersion: v1
kind: PersistentVolumeClaim
metadata:
  name: grafana-pvc
  namespace: grafana
spec:
  accessModes:
    - ReadWriteOnce
  resources:
    requests:
      storage: 50Gi
  storageClassName: longhorn
cm.yaml
OIDC 설정을 configmap에서 해줘야 한다.
apiVersion: v1
kind: ConfigMap
metadata:
  name: grafana-config
  namespace: grafana
data:
  grafana.ini: |
    [server]
    root_url = ex)www.mygrafana.com

    [auth]
    disable_login_form = false

    [auth.generic_oauth]
    enabled = true
    name = Keycloak
    allow_sign_up = true
    client_id = grafana
    client_secret = ex)secret
    scopes = openid profile email offline_access roles
    auth_url = ex)https://keycloak.my.com/realms/service/protocol/openid-connect/auth
    token_url = ex)https://keycloak.my.com/realms/service/protocol/openid-connect/token
    api_url = ex)https://keycloak.my.com/realms/service/protocol/openid-connect/userinfo
    redirect_uri = ex)https://www.mygrafana.com/login/generic_oauth
    role_attribute_path = contains(roles[*], 'Admin') && 'Admin' || contains(roles[*], 'Editor') && 'Editor' || 'Viewer'
    login_attribute_path = username
    name_attribute_path = full_name
    email_attribute_path = email
    match_by_email = true
    allow_sign_up = false

    [datasources]
    allow_adding = true
    allow_deleting = true
    allow_editing = true

    [users]
    auto_assign_org_role = Viewer

    [service_accounts]
    enable_service_accounts = true

    [security]
    service_account_allow_server_admin = true

    [branding]
    new_logo_path = /usr/share/grafana/public/img/grafana_icon.svg
    window_title = Grafana
    title = Grafana
    login_title = Grafana
logo.yaml
Logo를 변경해주기 위해 configmap을 통해 svg로 mount 해준다.
apiVersion: v1
kind: ConfigMap
metadata:
  name: custom-logo
  namespace: grafana
data:
  custom_logo.svg: |-
    <?xml version="1.0" encoding="UTF-8" standalone="no"?> .....
2. 배포
배포는 ArgoCD를 이용해 진행한다.
배포 후, 사용자별로 Organization을 통해 자동으로 격리한다.
결론
Grafana는 자료도 많고 어렵지 않아 간단하게 정리해 보았다.
중요한 점은 Logo 변경 & OIDC 설정 부분인 것 같다.

Cloud/DevOps & Network Virtualization에 관심 있는 Engineer입니다. 🐳⚓️👨✈️