Elliott Wave Detection project
Monowave Analyzer
The most principal thing in Elliott Wave is "Monowave."
Monowave, literally, explains the price direction like upside or downside.
Each monowave will constitute the each step of the entire wave pattern.
To begin with, We needed 3 parts of monowave simulation.
1. Price simulator : Generate stock price for each timestamp
2. Monowave detector : Save the outputted price and Label monowave
3. Visualizer : Print and Plot monowave
In our main code,
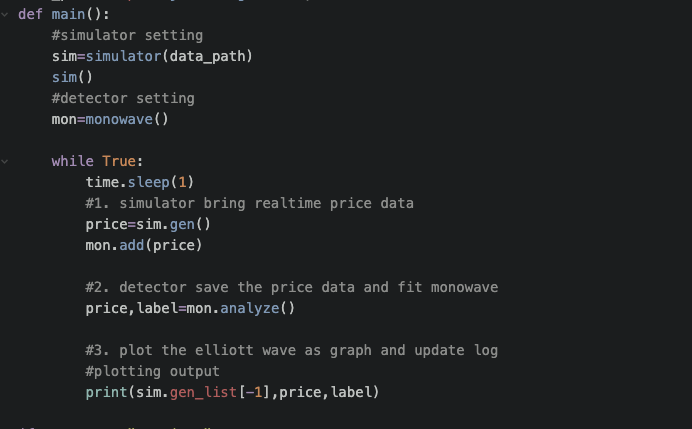
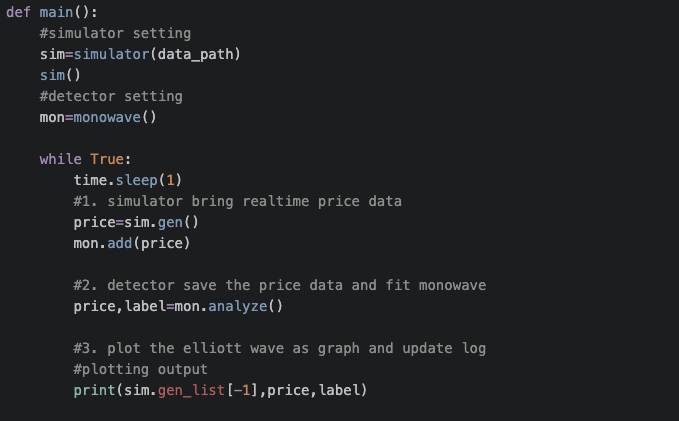
def main():
    #simulator setting
    sim=simulator(data_path)
    sim()
    #detector setting
    mon=monowave()

    while True:
        time.sleep(1)
        #1. simulator bring realtime price data
        price=sim.gen()
        mon.add(price)

        #2. detector save the price data and fit monowave
        price,label=mon.analyze()

        #3. plot the elliott wave as graph and update log
        #plotting output
        print(sim.gen_list[-1],price,label)
In a while loop, we generate price from simulator class, and analyze monowave from monowave class.
Poorly speaking, visualizatio step will be on "Front-end", so we skip this part at this time.
The output follows like below
start!
48215 36075.0 M1
48216 36054.0 M1
48217 36161.0 M2
48218 36216.0 M2
48219 36163.0 M3
48220 36172.0 M4
48221 36134.0 M5
48222 36087.0 M5
48223 36043.5291356 M5
48224 36070.8887296 M6
The first number(ex: 48215) is an index in the stockprice dataset.
The Second element is an price data.
The last one is a monowave label and it is based on the direction.
To do list
- Visualization code
- Specify the Monowave rule (It's very complicate.)