1. 데이터 준비
1) 데이터 불러오기
Seaborn의 load_dataset() 메서드를 이용하면 API를 통해 손쉽게 유명한 예제 데이터를 다운로드할 수 있다.
아래 repo의 데이터는 모두 CSV파일로 되어 있어 연습용으로 추천한다.
링크 추천
import pandas as pd
import seaborn as sns
# 종업원들이 받은 팁에 대한 데이터
tips = sns.load_dataset("tips")
2) 데이터 살펴보기 (EDA)
df = pd.DataFrame(tips)

df.shape
df.describe
df.info()
# 범주형 변수의 카테고리별 갯수 살펴보기
print(df['sex'].value_counts())
print("===========================")
print(df['time'].value_counts())
print("===========================")
print(df['smoker'].value_counts())
print("===========================")
print(df['day'].value_counts())
print("===========================")
print(df['size'].value_counts())
print("===========================")2. 범주형 데이터
범주형 데이터는 주로 막대그래프를 이용하여 수치를 요약한다. 일반적으로 가로, 세로, 그룹화, 누적된 막대그래프를 사용한다.
1) bar graph
- Pandas와 Matplotlib을 활용한 방법
matplotlib에 데이터를 인자로 넣기 위해선, 데이터를 x에 series/list, y에 list 형태로 각각 나누어줘야 한다.
# 각 성별 그룹에 대한 정보(총합, 평균, 데이터량 등)가 grouped 객체에 저장된다.
grouped = df['tip'].groupby(df['sex'])grouped.mean() # 성별에 따른 팁의 평균
grouped.size() # 성별에 따른 데이터 량(팁 횟수)- 성별에 따른 팁 액수의 평균을 막대그래프로 그리기
import numpy as np
sex = dict(grouped.mean()) #평균 데이터를 딕셔너리 형태로 바꿔줍니다.
x = list(sex.keys())	#['Male', 'Female']
y = list(sex.values()) #[3.0896178343949043, 2.833448275862069]
import matplotlib.pyplot as plt
plt.bar(x = x, height = y)
plt.ylabel('tip[$]')
plt.title('Tip by Sex')- 결과

2) Seaborn과 Matplotlib을 활용한 방법
Seaborn을 이용하면 더욱 쉽게 나타낼 수 있다. sns.barplot의 인자로 df를 넣고 원하는 칼럼을 지정해주면 아래와 같이 성별에 대한 tip 평균을 볼 수 있다.
또한, Matplotlib과 함께 사용하여 figsize, title 등의 옵션을 함께 사용할 수 있다.
plt.figure(figsize=(10,6)) # 도화지 사이즈를 정합니다.
sns.barplot(data=df, x='sex', y='tip')
plt.ylim(0, 4) # y값의 범위를 정합니다.
plt.title('Tip by sex') # 그래프 제목을 정합니다.
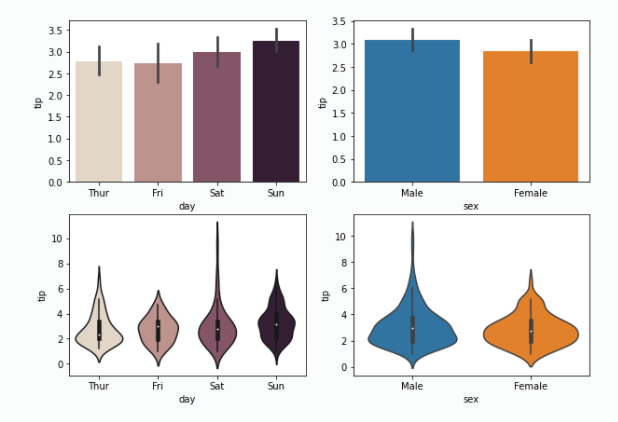
이외에도 범주형 그래프를 나타내기 좋은 violin plot을 사용하거나 더 예쁜 색상을 사용하는 palette옵션을 줄 수 있다.
fig = plt.figure(figsize=(10,7))

ax1 = fig.add_subplot(2,2,1)
sns.barplot(data=df, x='day', y='tip',palette="ch:.25")

ax2 = fig.add_subplot(2,2,2)
sns.barplot(data=df, x='sex', y='tip')

ax3 = fig.add_subplot(2,2,4)
sns.violinplot(data=df, x='sex', y='tip')

ax4 = fig.add_subplot(2,2,3)
sns.violinplot(data=df, x='day', y='tip',palette="ch:.25")- 실행 결과
3. 수치형 데이터
수치형 데이터를 나타내는 데 가장 좋은 그래프는 산점도 혹은 선 그래프이다.
1) 산점도(scatter plot)
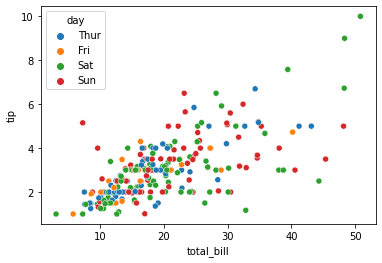
hue인자에 'day'를 주어 요일에 따른 tip와 total_bill의 관계를 시각화해보자.
hue: It will produce data points with different colors. Hue can be used to group to multiple data variable and show the dependency of the passed data values are to be plotted.
sns.scatterplot(data=df , x='total_bill', y='tip', hue='day')- 실행 결과
2) 선 그래프(line graph)
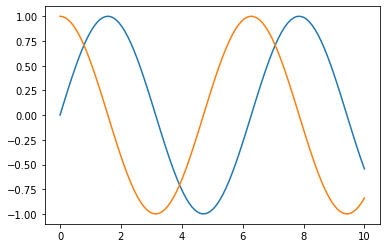
x = np.linspace(0, 10, 100)
sns.lineplot(x=x, y=np.sin(x))
sns.lineplot(x=x, y=np.cos(x))- 결과
3) 히스토그램
-
개념
-
↔가로축
- 계급: 변수의 구간, bin (or bucket)
-
↕세로축
- 도수: 빈도수, frequency
-
전체 총량: n
-
-
histogram vs bar graph
Histograms are a bunch of bars connected to each other, visualizing a distribution of a some continuous quantitative variable. Bar graphs (or bar charts) use proportionally sized rectangles to visualize some type of categorical data.
#그래프 데이터
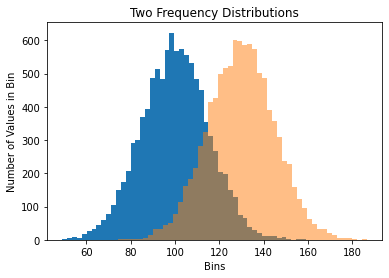
mu1, mu2, sigma = 100, 130, 15
x1 = mu1 + sigma*np.random.randn(10000)
x2 = mu2 + sigma*np.random.randn(10000)

# 축 그리기
fig = plt.figure()
ax1 = fig.add_subplot(1,1,1)

# 그래프 그리기
patches = ax1.hist(x1, bins=50, density=False) #bins는 x값을 총 50개 구간으로 나눈다는 뜻
patches = ax1.hist(x2, bins=50, density=False, alpha=0.5)
ax1.xaxis.set_ticks_position('bottom') # x축의 눈금을 아래 표시
ax1.yaxis.set_ticks_position('left') #y축의 눈금을 왼쪽에 표시

# 라벨, 타이틀 달기
plt.xlabel('Bins')
plt.ylabel('Number of Values in Bin')
ax1.set_title('Two Frequency Distributions')

# 보여주기
plt.show()- 결과
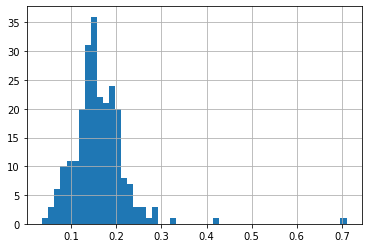
결제 금액 대비 팁의 비율을 나타내는 히스토그램 그리기
df['tip_pct'] = df['tip'] / df['total_bill']
df['tip_pct'].hist(bins=50)- 결과
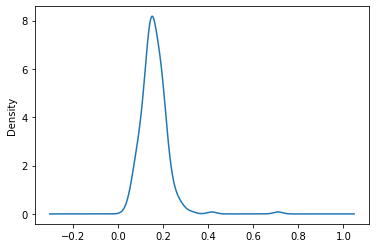
확률 밀도함수로 나타내기
- Density plot: Density plots are used to
observe the distributionof a variable in a dataset. - KDE(Kernel Density Estimate): Kernel Density Estimate is used for
visualizingthe Probability Density of acontinuous variable. It depicts the probability density at different values in a continuous variable.
df['tip_pct'].plot(kind='kde')
- 결과
4. Heatmap
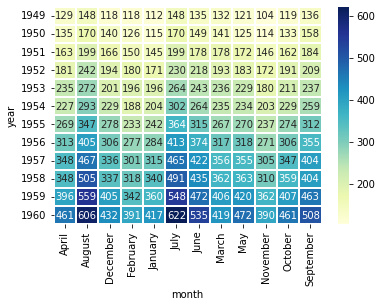
Heatmap은 방대한 양의 데이터와 현상을 수치에 따른 색상으로 나타내는 것으로, 데이터 차원에 대한 제한은 없으나 모두 2차원으로 시각화하여 표현됨
pandas의 dataframe의 pivot() 메서드를 이용해보자.
#탑승객 수를 year, month로 pivoting
pivot = flights.pivot(index='year', columns='month', values='passengers')

#여러 옵션을 줄 수 있음
#sns.heatmap(pivot)
sns.heatmap(pivot, linewidths=0.2, annot=True, fmt="d", cmap="YlGnBu")- 결과
5. 요약
막대그래프(bar graph), 꺾은선 그래프(line graph), 산점도(scatter plot), 히스토그램(histogram)은 정말 많이 쓰이는 그래프이다.
범주형 데이터에서는 bar graph를 주로 사용하며,
수치형 데이터에서는 line graph, scatter plot, histogram을 주로 사용한다.
