1. HTML SVG
[1] HTML SVG(Scalable Vector Graphic)
: 확장 가능한 벡터 그랙픽
1) 특징
- XML 형식으로 그랙픽을 정의힌다.
- 웹용 벡타 기반 그래픽을 정의하는데 사용된다.
- SVG 파일의 각 요소와 속성은
애니메이션화될 수 있다. - SVG 그래픽은 확대하거나 크기를 조정해도
품질이 손상되지 않음 - SVG 이미지는 모든 텍스트 편집기로 생성 및 편집할 수 있다.
- SVG 이미지는 모든 해상도에서 고품질로 인쇄할 수 있다.
2-1) SVG 태그
- 정의 : SVG는 XML 기반의 벡터 그래픽스를 표현하는 형식입니다. 크기를 조정해도 해상도에 손실이 없어서 웹에서 그래픽을 표시하는 데 자주 사용됩니다.
- 기본 속성:
- width: SVG 요소의 너비를 정의합니다.
- height: SVG 요소의 높이를 정의합니다.
2-2) Circle 태그
: circle 태그는 원을 그리는 데 사용됩니다.
(1) 주요 속성
cx: 원의 중심 x좌표를 설정합니다. (이 경우 50)cy: 원의 중심 y좌표를 설정합니다. (이 경우 50)r: 원의 반지름을 설정합니다. (이 경우 50)stroke: 원의 테두리 색상을 설정합니다. (이 경우 초록색)stroke-width: 테두리의 두께를 설정합니다. (이 경우 4)fill: 원 내부의 색상을 설정합니다. (이 경우 연한 분홍색)
(2) 예시 코드
<h1>SVG Circle</h1>
<svg height="100" width="100">
    <circle cx="100" cy="100" r="50" stroke="black" stroke-width="3" fill="red"/>
</svg>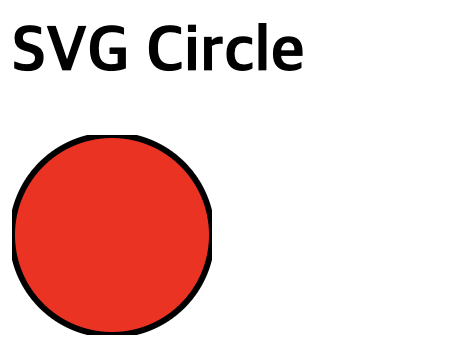
2-3) Rectangle 태그
: rect 태그는 직사각형을 그리는 데 사용됩니다.
(1) 주요 속성
width: 직사각형의 너비를 설정합니다. (이 경우 300)height: 직사각형의 높이를 설정합니다. (이 경우 100)x: 직사각형의 x좌표를 설정합니다. (기본값은 0)y: 직사각형의 y좌표를 설정합니다. (기본값은 0)fill: 직사각형 내부의 색상을 설정합니다. (이 경우 파우더 블루)stroke: 직사각형의 테두리 색상을 설정합니다. (이 경우 파란색)stroke-width: 테두리의 두께를 설정합니다. (이 경우 3)fill-opacity: 면의 투명도를 설정합니다.stroke-opacity: 선의 투명도를 설정합니다.rx: 직사각형의 수평 모서리 반지름을 설정합니다. 이 값이 클수록 직사각형의 모서리가 더 둥글게 됩니다.ry: 직사각형의 수직 모서리 반지름을 설정합니다. 이 값이 클수록 직사각형의 모서리가 더 둥글게 됩니다.
(2) 예시 코드
<h1>SVG Rectangle</h1>
<svg width="400" height="110">
    <rect
        width="300"
        height="100"
        style="fill:powderblue;stroke-width:3;stroke:blue"/>
</svg>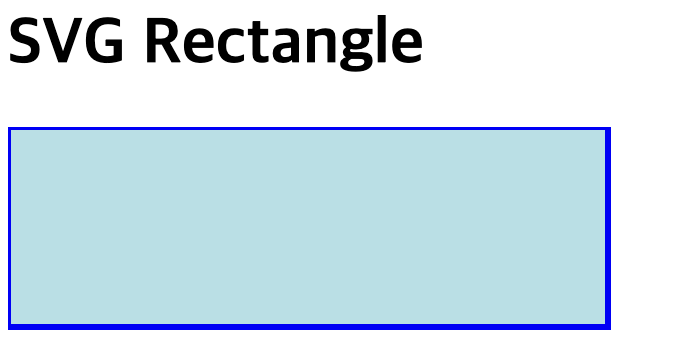
2-4) Ellipse 태그
: ellipse 태그는 타원을 그리는 데 사용됩니다.
(1) 주요 속성
cx: 타원의 중심 x좌표를 설정합니다. (이 경우 200)cy: 타원의 중심 y좌표를 설정합니다. (이 경우 80)rx: 타원의 x축 반지름을 설정합니다. (이 경우 100)ry: 타원의 y축 반지름을 설정합니다. (이 경우 50)fill: 타원 내부의 색상을 설정합니다. (이 경우 노란색)stroke: 타원의 테두리 색상을 설정합니다. (이 경우 보라색)stroke-width: 테두리의 두께를 설정합니다. (이 경우 2)
(2) 예시 코드
<h1>SVG Ellipse</h1>
<svg height="140" width="500">
    <ellipse
        cx="200"
        cy="80"
        rx="100"
        ry="50"
        style="fill:yellow;stroke:purple;stroke-width:2"/>
</svg>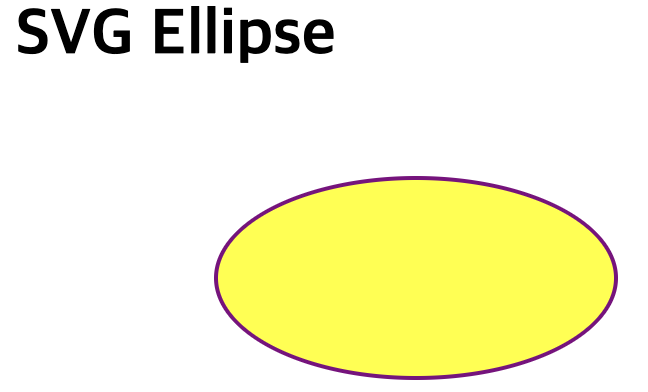
<h1>
    SVG Ellipse2
</h1>
<svg height="150" width="500">
    <ellipse cx="240" cy="100" rx="220" ry="30" style="fill:purple;stroke:gray" />
    <ellipse cx="220" cy="70" rx="190" ry="20" style="fill:lime;stroke:gray" />
    <ellipse cx=" 210" cy="45" rx="170" ry="15" style="fill:yellow;stroke:gray" />
</svg>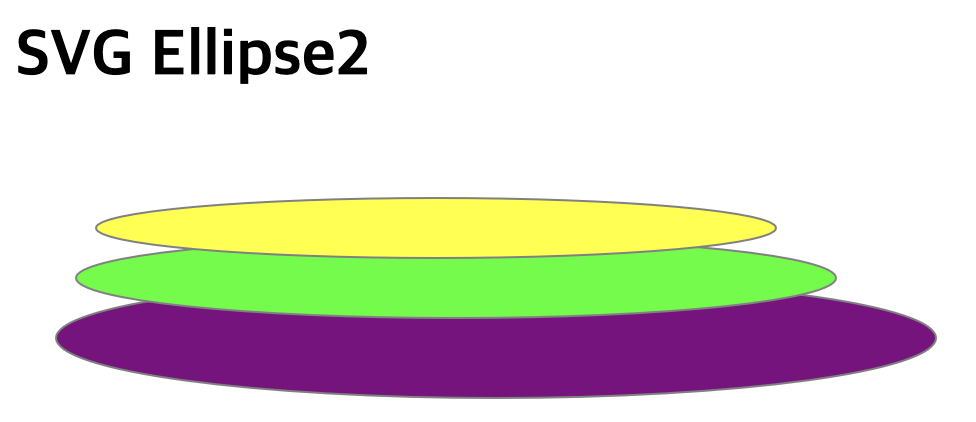
2-5) Line 태그
: line 태그는 직선을 그리는 데 사용됩니다.
(1) 주요 속성
x1: 직선 시작점의 x좌표를 설정합니다. (이 경우 0)y1: 직선 시작점의 y좌표를 설정합니다. (이 경우 0)x2: 직선 끝점의 x좌표를 설정합니다. (이 경우 200)y2: 직선 끝점의 y좌표를 설정합니다. (이 경우 200)stroke: 직선의 색상을 설정합니다. (이 경우 빨간색)stroke-width: 선의 두께를 설정합니다. (이 경우 2)
(2) 예시 코드
<h1>SVG Line</h1>
<svg height="210" width="500">
    <line
        x1="0"
        y1="0"
        x2="200"
        y2="200"
        style="stroke:rgb(255,0,0);stroke-width:2"/>
</svg>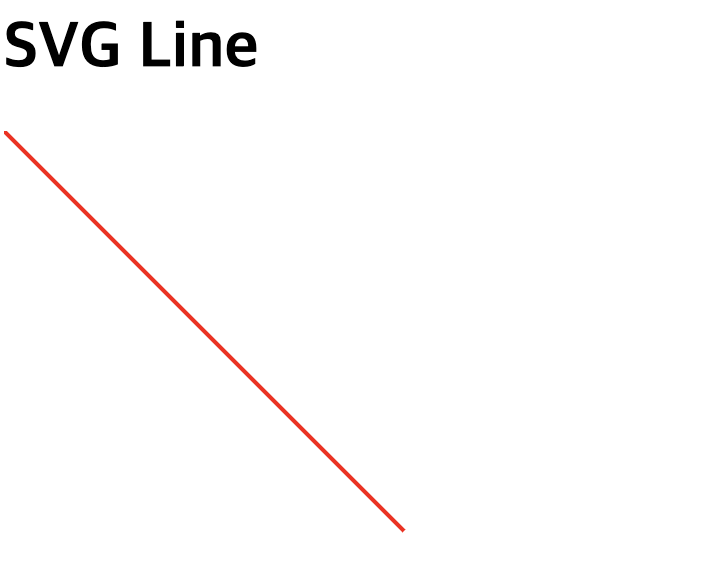
2-6) Polygon 태그
: polygon 태그는 다각형을 그리는 데 사용됩니다.
(1) 주요 속성
points: 다각형의 각 꼭짓점의 좌표를 설정합니다. (예: "200,10 250,190 100,210")fill: 다각형 내부의 색상을 설정합니다. (이 경우 회색)stroke: 다각형의 테두리 색상을 설정합니다. (이 경우 보라색)stroke-width: 테두리의 두께를 설정합니다. (이 경우 1)
(2) 예시 코드
<h1>SVG Polygon</h1>
<svg height="210" width="500">
    <polygon
        points="200,10 250,190 100,210"
        style="fill:gray;stroke:purple;stroke-width:1"/>
</svg>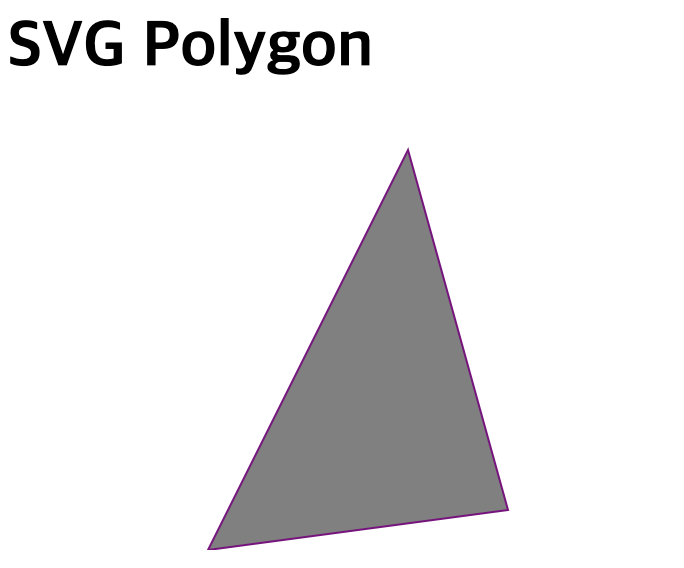
2-7) Polyline 태그
: polyline 태그는 선으로 연결된 여러 점을 그리는 데 사용됩니다.
(1) 주요 속성
points: 선이 연결될 점들의 좌표를 설정합니다. (예: "0,40 40,40 40,80 80,80 80,120 120,120 120,160")fill: 다각형 내부의 색상을 설정합니다. (기본값은 없음)stroke: 선의 색상을 설정합니다. (이 경우 빨간색)stroke-width: 선의 두께를 설정합니다. (이 경우 4)
(2) 예시 코드
<h1>SVG polyline</h1>
<svg height="180" width="500">
    <polyline
        points="0,40 40,40 40,80 80,80 80,120 120,120 120,160"
        style="fill:white;stroke:red;stroke-width:4"/>
</svg>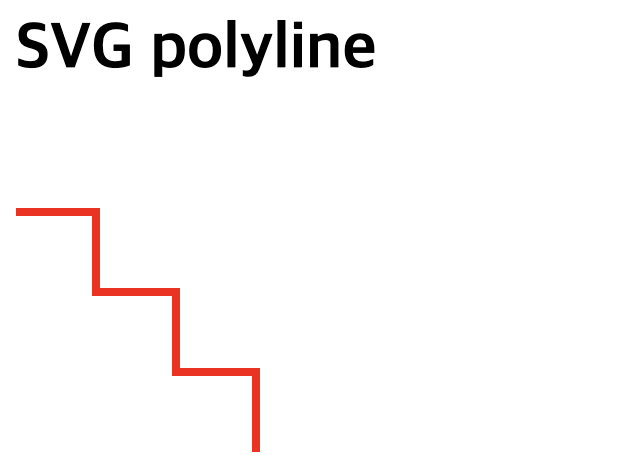
3) shapes 종류 요약
<rect>: 사각형<circle>: 원<ellipse>: 타원<line>: 선<polyline>: 선으로 연결된 여러 점<polygon>: 다각형
2. HTML Canvas
[1] HTML SVG와 Canvas의 차이점
1) Canvas
- 웹페이지에 그래픽을 그리는데 사용
- Canvas 요소는 그래픽을 위한 컨테이너일 뿐이고 실제로 그래픽을
- 그리려면 스크립트를 사용해야 한다.
2) SVG와 가장 큰 차이
- SVG는 XML로 2D 그래픽을 기술하는 언어
- Canvas는 JavaScript를 사용하여 즉석에서 2D 그래픽을 그릴 수 있음
3) 공통점
- 그래픽을 처리한다는 점
[2] HTML Canvas
1) 형태
<canvas id="myCanvas" width="200" height="100“ style="border:1px solid #000000;">
</canvas>
2-1) Canvas - rect
: 캔버스에 사각형을 그리는 방법으로, fillRect() 메서드를 사용하여 사각형의 위치와 크기를 지정합니다.
(1) 주요 속성
fillStyle: 사각형의 색상을 설정합니다.fillRect(x, y, width, height): 사각형을 그릴 위치(x, y)와 크기(width, height)를 설정하여 사각형을 캔버스에 그립니다.
(2) 예시 코드
<h2>canvas - rect</h2>
<canvas id="myCanvas2" width="200" height="100" style="border:1px solid #000000;">
</canvas>
<script>
    var canvas = document.getElementById("myCanvas2");
    var ctx = canvas.getContext("2d");
    ctx.fillStyle = "#FF0000";
    ctx.fillRect(0, 0, 150, 75);
</script>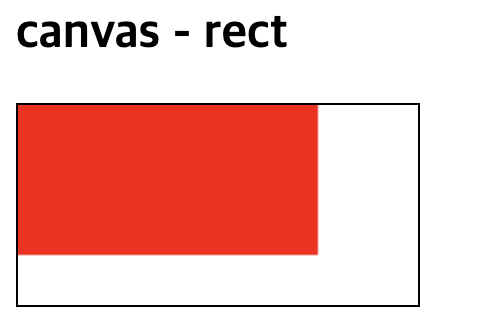
2-2) Canvas - line
: 캔버스에 선을 그리는 방법으로, moveTo()로 시작점을 지정하고 lineTo()로 끝점을 설정한 후 stroke() 메서드를 호출해 선을 그립니다.
(1) 주요 속성
moveTo(x, y): 선의 시작점을 설정합니다.lineTo(x, y): 선의 끝점을 설정합니다.stroke(): 설정한 선을 캔버스에 그립니다.
(2) 예시 코드
<h2>canvas - line</h2>
<canvas id="myCanvas3" width="200" height="100" style="border:1px solid #d3d3d3;">
    Your browser does not support the canvas element.
</canvas>
<script>
    var canvas = document.getElementById("myCanvas3");
    var ctx = canvas.getContext("2d");
    ctx.moveTo(0, 0);
    ctx.lineTo(200, 100);
    ctx.stroke();
</script>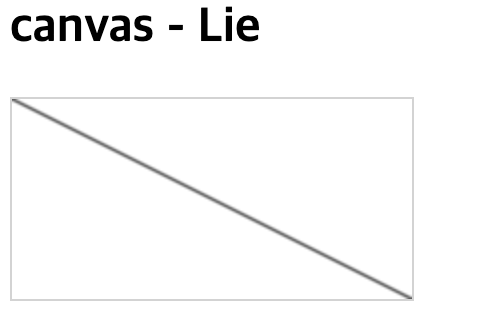
2-3) Canvas - circle
: 캔버스에 원을 그리는 방법으로, arc() 메서드를 사용해 중심점, 반지름, 시작각도, 끝각도를 설정해 원을 그린 후 stroke() 메서드로 외곽선을 그립니다.
(1) 주요 속성
beginPath(): 새로운 경로를 시작합니다.arc(x, y, radius, startAngle, endAngle): 원을 그릴 중심점(x, y)와 반지름, 시작 및 끝 각도를 설정합니다.stroke(): 원의 외곽선을 그립니다.
(2) 예시 코드
<h2>canvas - circle</h2>
<canvas id="myCanvas4" width="200" height="100" style="border:1px solid #d3d3d3;">
    Your browser does not support the canvas element.
</canvas>
<script>
    var canvas = document.getElementById("myCanvas4");
    var ctx = canvas.getContext("2d");
    ctx.beginPath();
    ctx.arc(95, 50, 40, 0, 2 * Math.PI);
    ctx.stroke();
</script>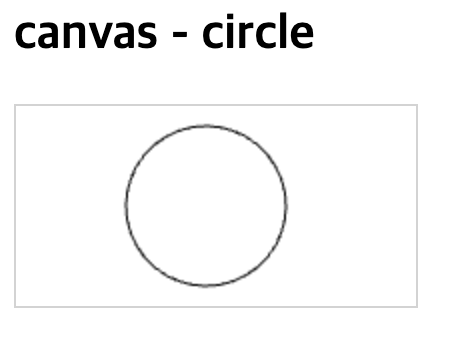
2-4) Canvas - image
: 이미지를 캔버스에 그리는 방법으로, drawImage() 메서드를 사용하여 이미지를 캔버스에 표시합니다.
(1) 주요 속성
drawImage(image, x, y, width, height): 지정한 위치(x, y)와 크기(width, height)에 이미지를 그립니다.onload: 이미지가 로드된 후에 호출되는 콜백 함수입니다.
(2) 예시 코드
<h2>canvas - image</h2>
<img id="cat" width="500" height="300" src="cat.png" style="display: none;">
<canvas id="myCanvas5" width="500" height="300" style="border: 1px solid black;"></canvas>

<script>
    var canvas = document.getElementById("myCanvas5");
    var ctx = canvas.getContext("2d");
    var img = document.getElementById("cat");

    // 이미지 로드 후 캔버스에 그리기
    img.onload = function () {
        ctx.drawImage(img, 10, 10, img.width, img.height);
    };
</script>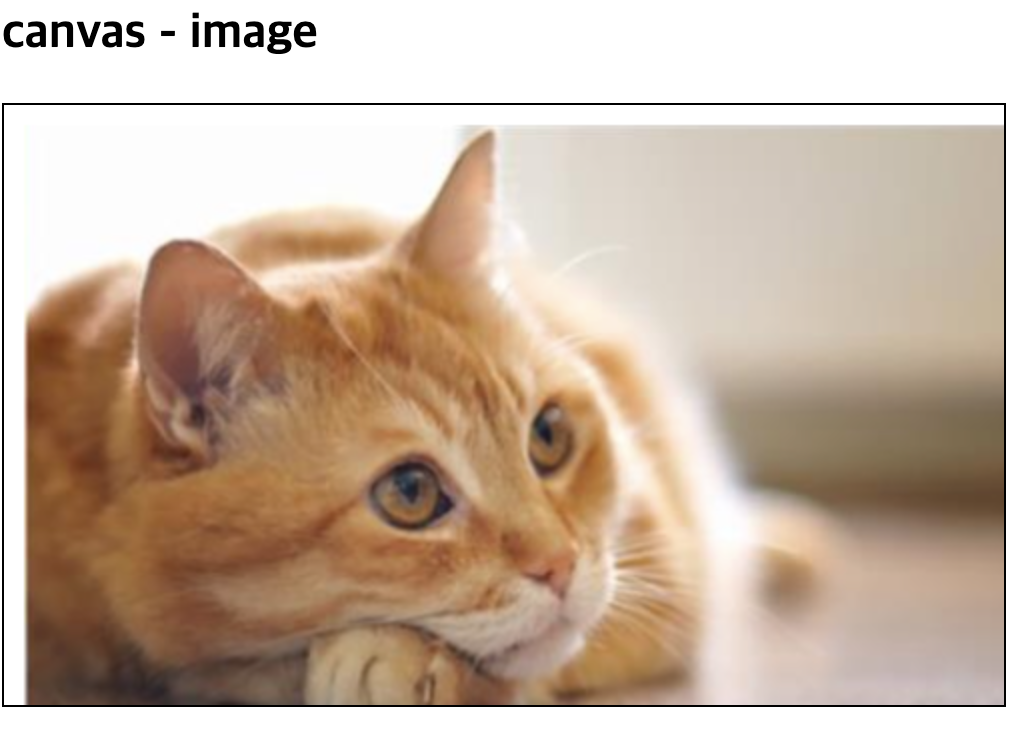
3. summary
[1] HTML SVG (Scalable Vector Graphics)
1) 특징
: XML 기반으로 그래픽을 정의, 품질 손상 없이 크기 조정 가능, 애니메이션화 가능, 모든 해상도에서 인쇄 가능.
2) 주요 태그
<svg>: SVG 요소 정의.<circle>: 원 그리기 (cx, cy, r, stroke, fill 등).<rect>: 직사각형 그리기 (width, height, fill 등).<ellipse>: 타원 그리기 (cx, cy, rx, ry, fill 등).<line>: 직선 그리기 (x1, y1, x2, y2, stroke 등).<polygon>: 다각형 그리기 (points, fill 등).<polyline>: 선으로 연결된 점 그리기 (points, stroke 등).
[2] 2. HTML Canvas
1) 차이점
- Canvas: 스크립트를 사용하여 그래픽을 그리는 컨테이너, 실시간으로 그래픽 생성.
- SVG: XML로 2D 그래픽을 기술.
2) 주요 메서드
- fillRect(): 사각형 그리기.
- moveTo() 및 lineTo(): 선 그리기.
- arc(): 원 그리기.
- drawImage(): 이미지 캔버스에 그리기.
안녕하세요, 사용자들의 문제 해결을 중심으로 하는 프론트엔드 개발자입니다. 티스토리로 전환했어요 : https://pangil-log.tistory.com