SAPUI5는 응용 프로그램 logic을 확인하고 응용 프로그램 내에서 사용할 수 있는 debugging tool을 제공한다.
Preview
Coding
webapp/view/InvoiceList.view.xml
<mvc:View
controllerName="sap.ui.demo.walkthrough.controller.InvoiceList"
xmlns="sap.m"
xmlns:mvc="sap.ui.core.mvc">
<List
id="invoiceList"
class="sapUiResponsiveMargin"
width="auto"
items="{
path : 'invoice>/Invoices',
sorter : {
path : 'ShipperName',
group : true
}
}">
<headerToolbar>
<Toolbar>
<Title text="{i18n>invoiceListTitle}"/>
<ToolbarSpacer/>
<SearchField width="50%" search=".onFilterInvoices"/>
</Toolbar>
</headerToolbar>
<items>
<ObjectListItem
title="{invoice>Quantity} x {invoice>ProductName}"
number="{
parts: [{path: 'invoice>ExTendedPrice'}, {path: 'view>/currency'}],
type: 'sap.ui.model.type.Currency',
formatOptions: {
showMeasure: false
}
}"
numberUnit="{view>/currency}"
numberState="{= ${invoice>ExtendedPrice} > 50 ? 'Error' : 'Success' }">
<attributes>
<ObjectAttribute text="{
path: 'invoice>Status',
formatter: '.formatter.statusText'
}"/>
</attributes>
</ObjectListItem>
</items>
</List>
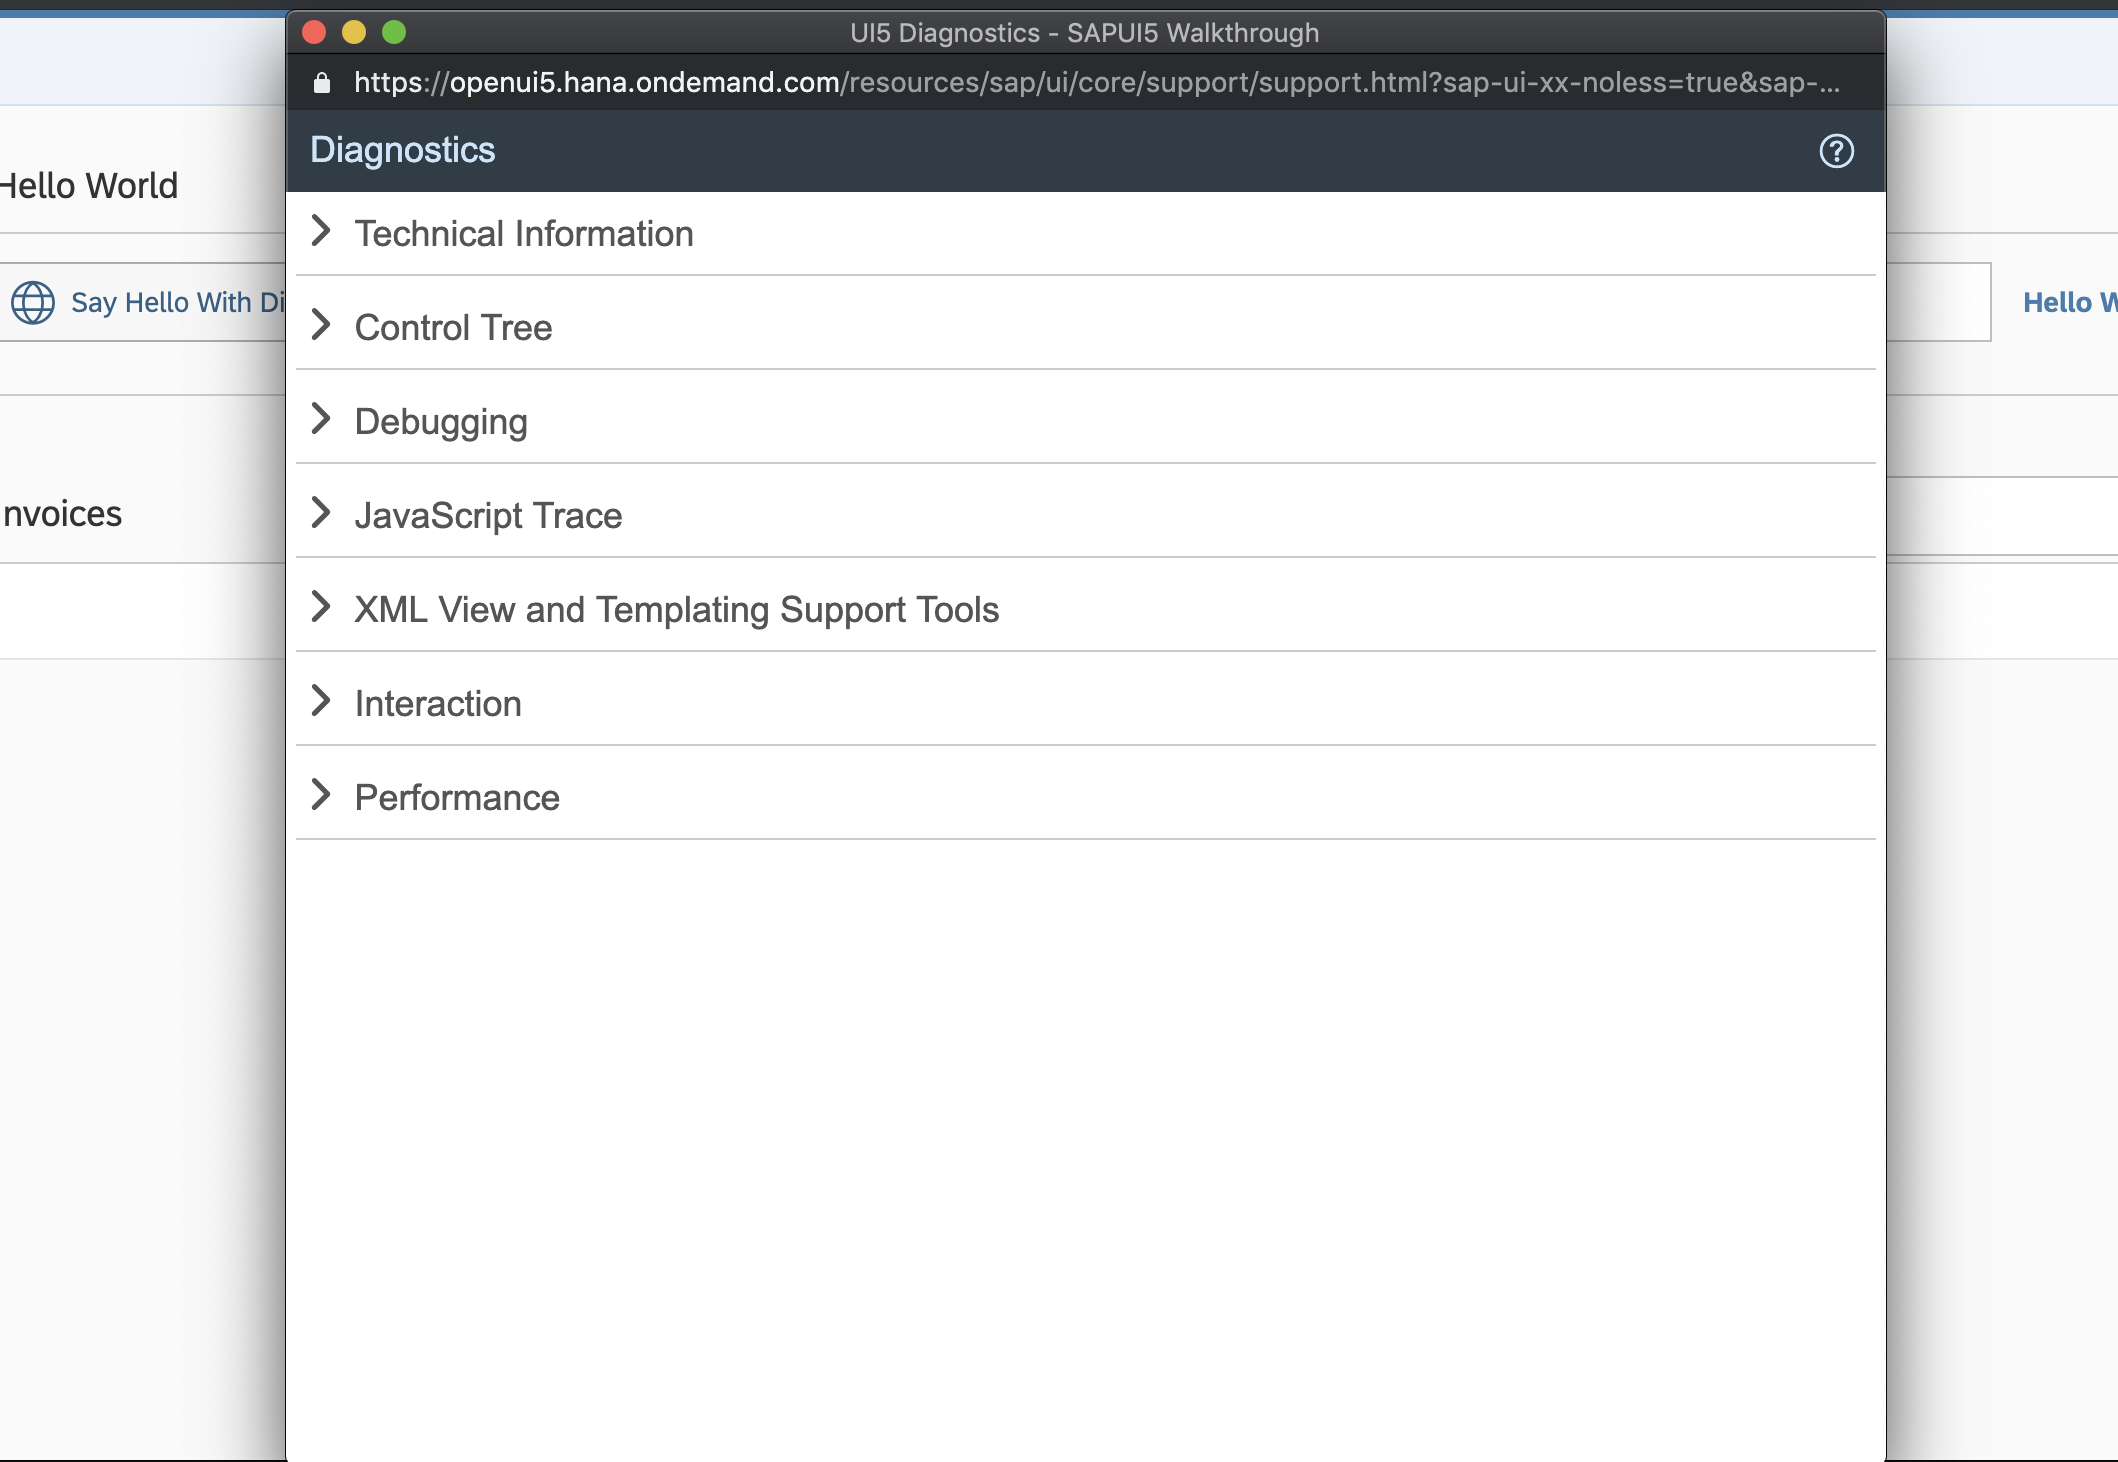
</mvc:View>invoice>ExtendedPrice대신 Invoice>errorCode!로 바꾸고 CTRL + ALT + SHIFT + S를 눌러
SAPUI5 지원 해주는 diagnostics tool을 열고 응용 프로그램을 확인해본다.
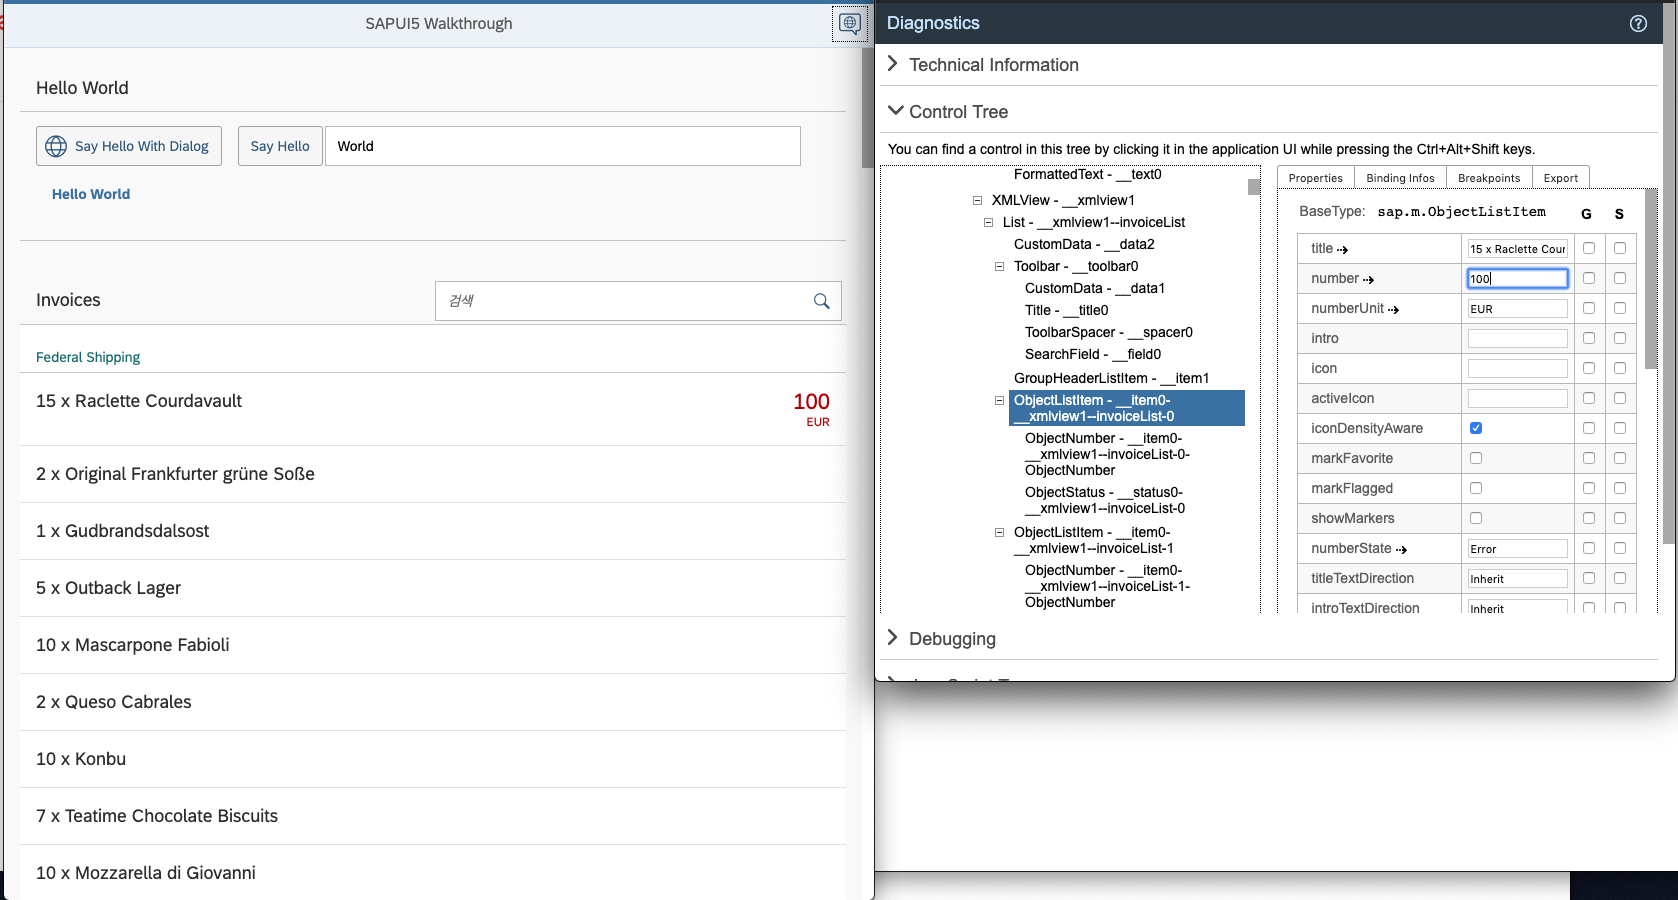
Control Tree 섹션을 클릭하면 현재 돔 구조를 볼 수 있고 해당 properties를 확인할 수 있다.
Number 속성을 일부로 오류를 냈지만 해당 property에 숫자 값을 넣으면 다시 화면에서는 가격이 표시됨을 볼 수 있다.
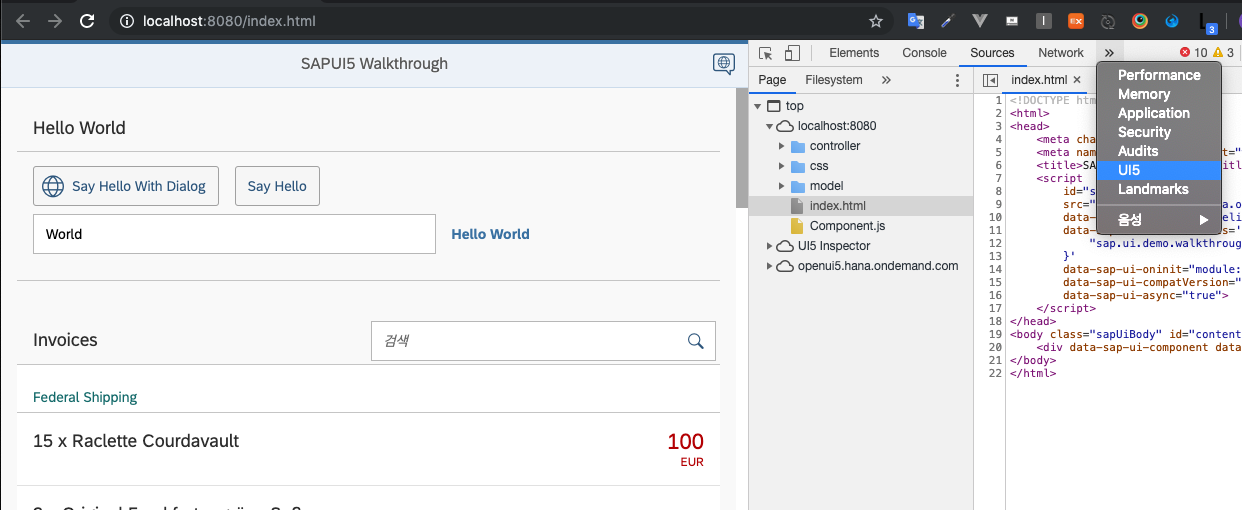
SAPUI5 지원 해주는 diagnostics tool 대신 Inspector를 활용하여 디버깅을 할 수 있다.
ui5 확장프로그램 다운받는 곳
해당 url에서 Inspector를 확장프로그램에 추가하고 개발자 모드에서 ui5를 선택한다
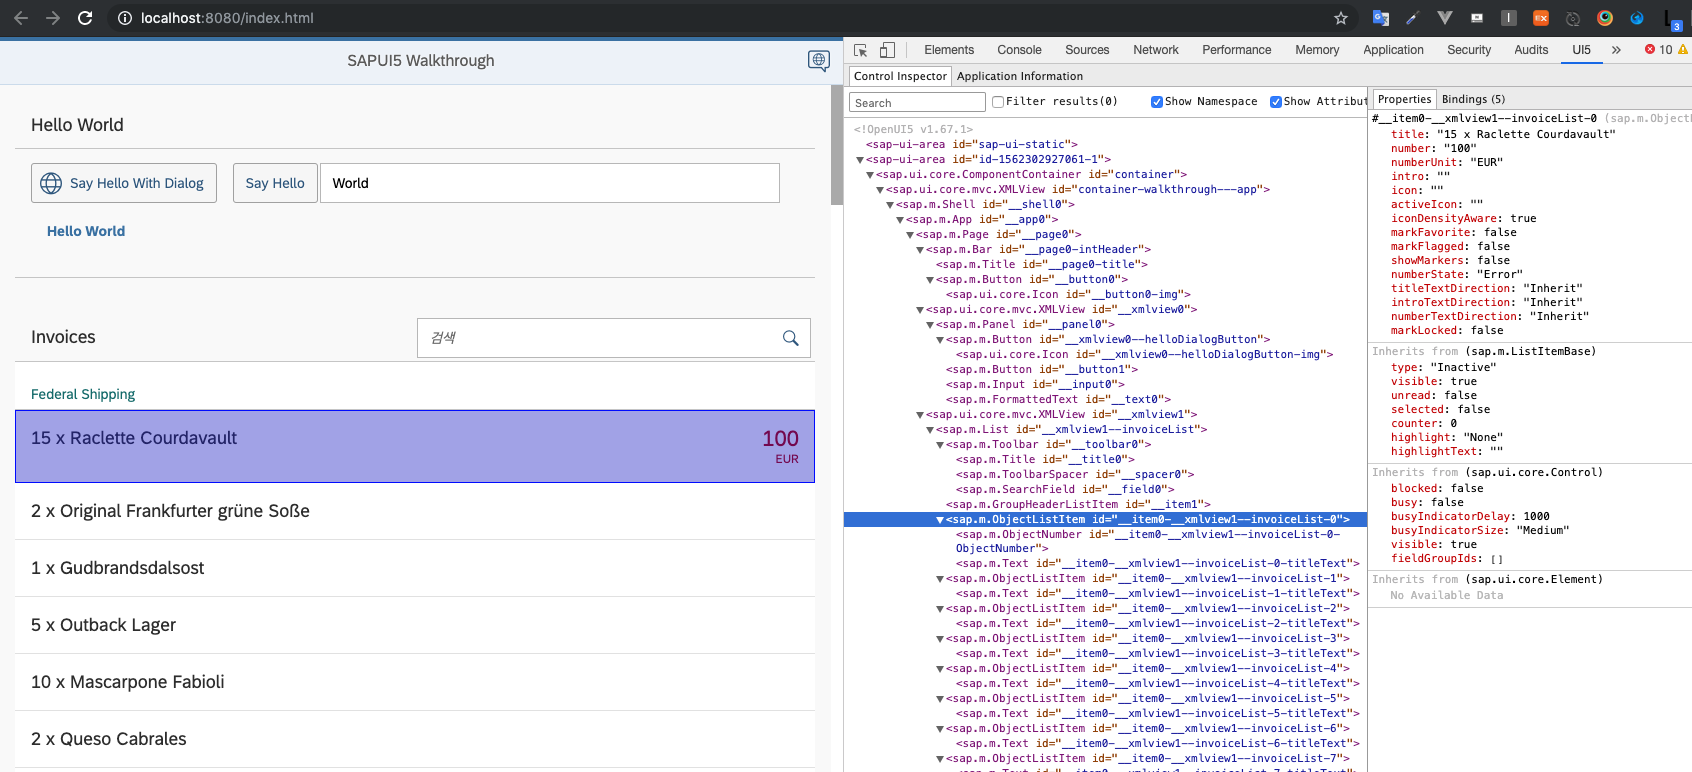
개발자 모드에서도 해당 dom을 탐색할 수 있고 데이터 바인딩 현황을 볼 수 있다.
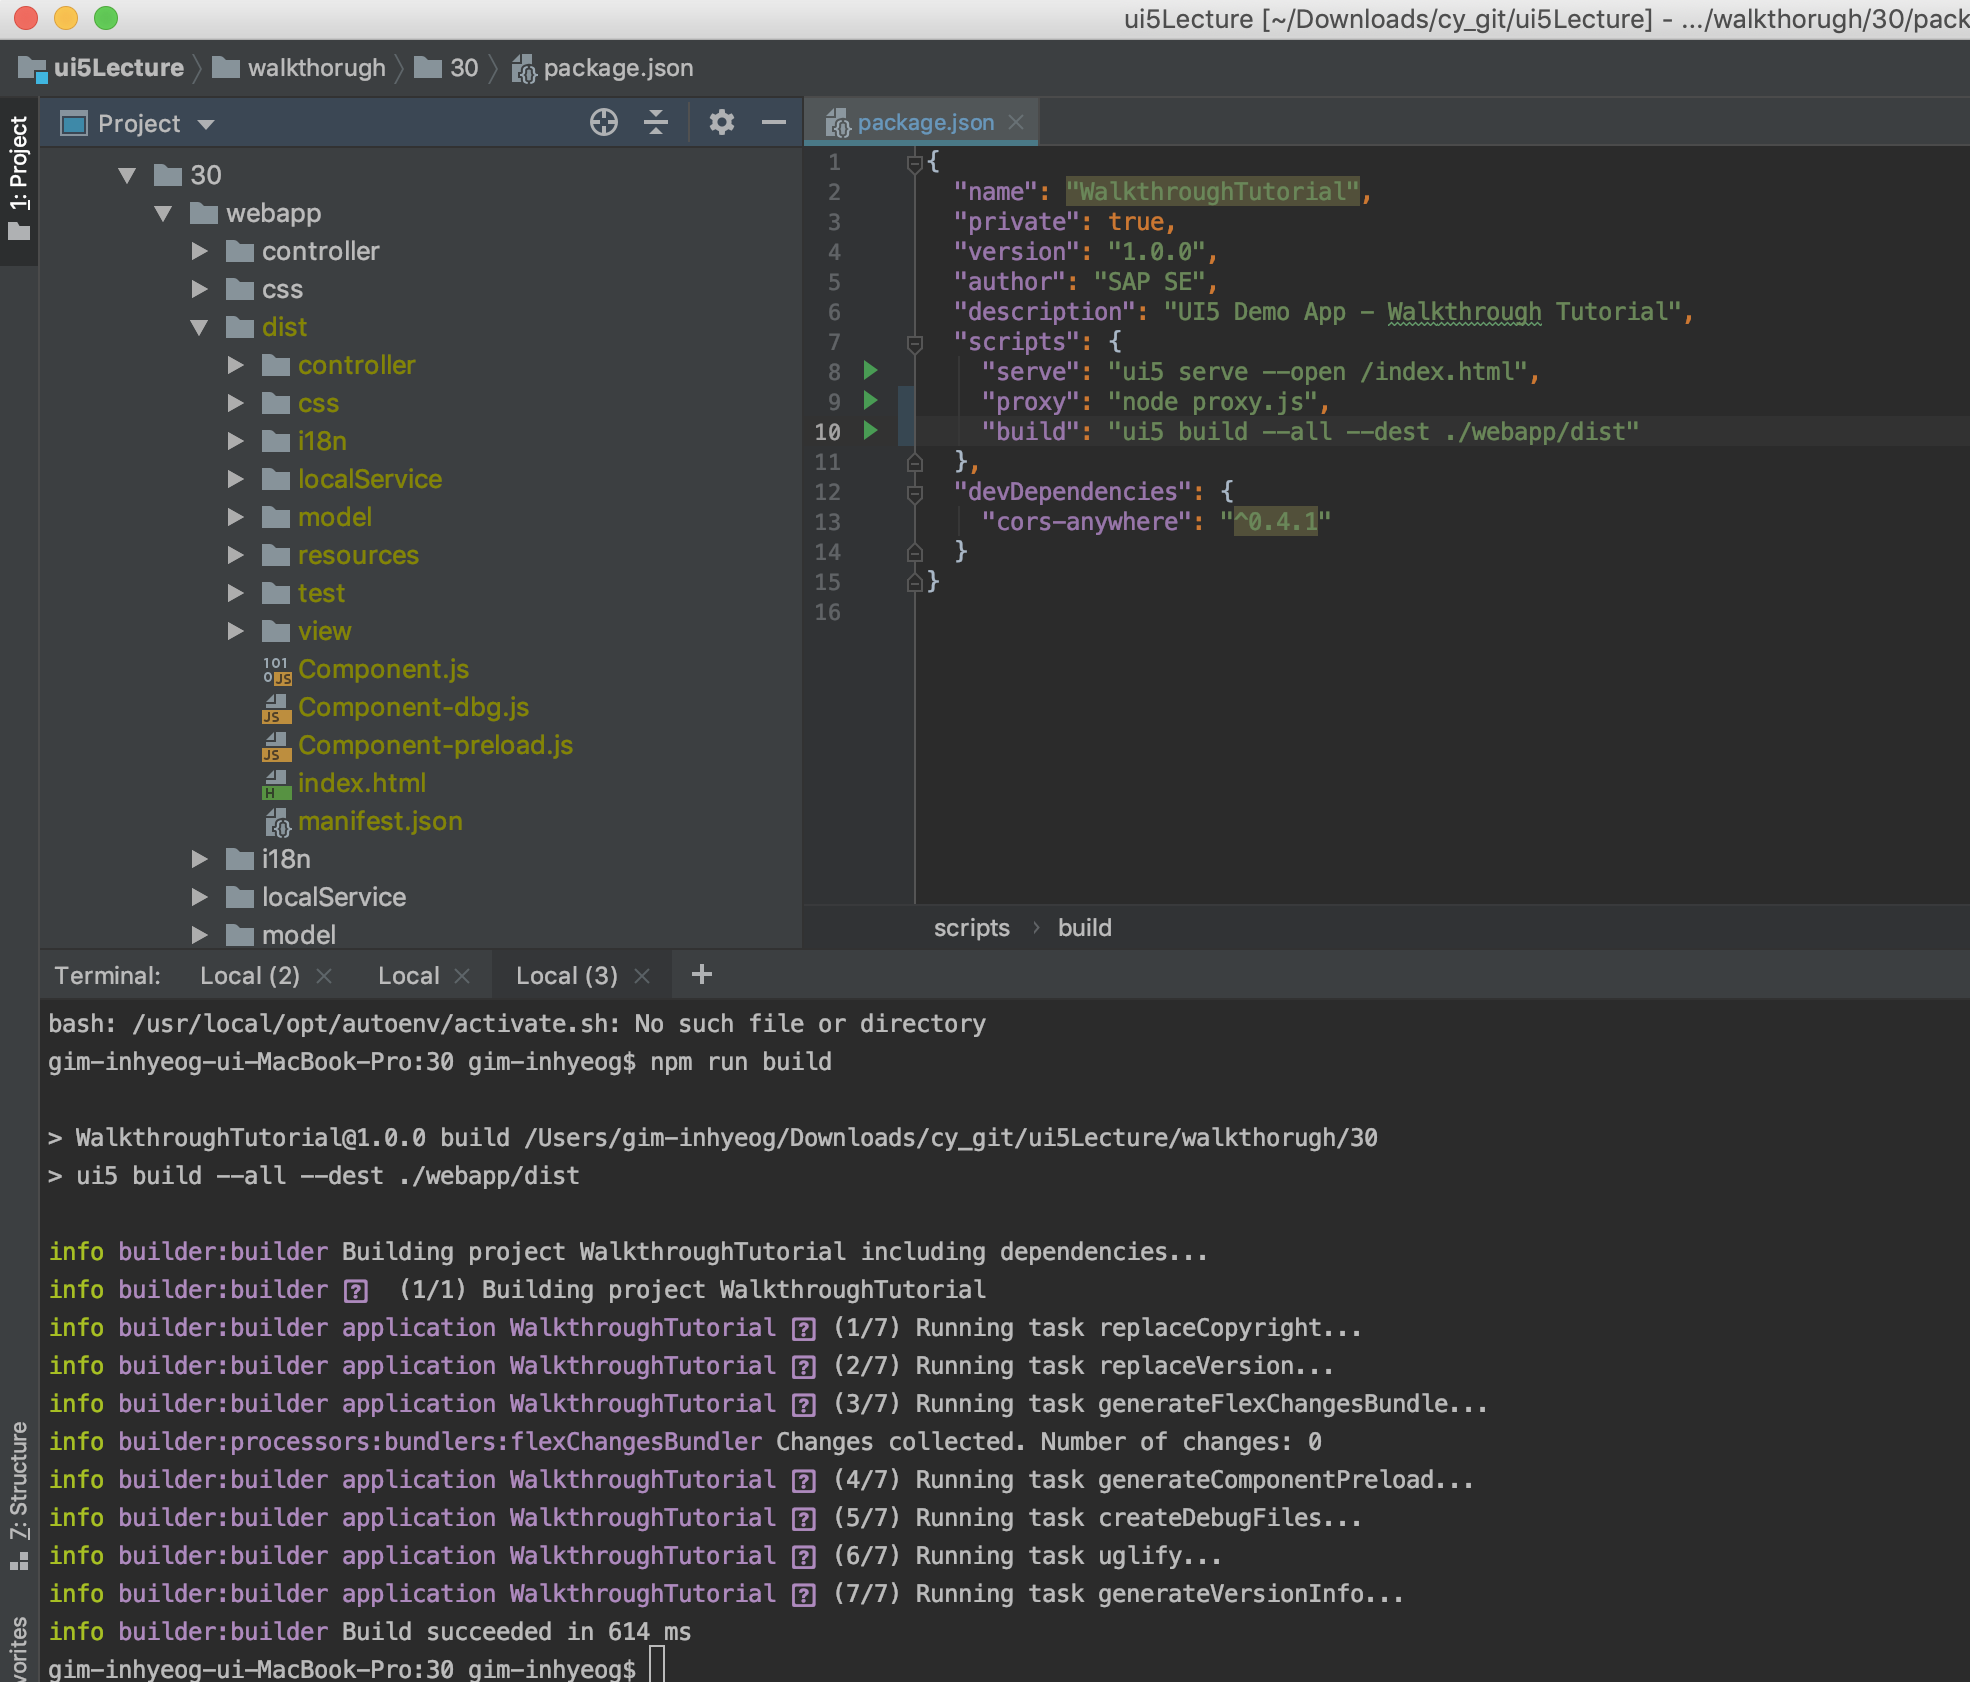
webapp/package.json
{
  "name": "WalkthroughTutorial",
  "private": true,
  "version": "1.0.0",
  "author": "SAP SE",
  "description": "UI5 Demo App - Walkthrough Tutorial",
  "scripts": {
    "serve": "ui5 serve --open /index.html",
    "proxy": "node proxy.js",
    "build": "ui5 build --all --dest ./webapp/dist"
  },
  "devDependencies": {
    "cors-anywhere": "^0.4.1"
  }
}
package.json scripts에 build 명령어를 추가하고 npm run build실행시 아래와 같이 빌드가 되고 webapp 안에 dist 폴더가 생성이 된다.
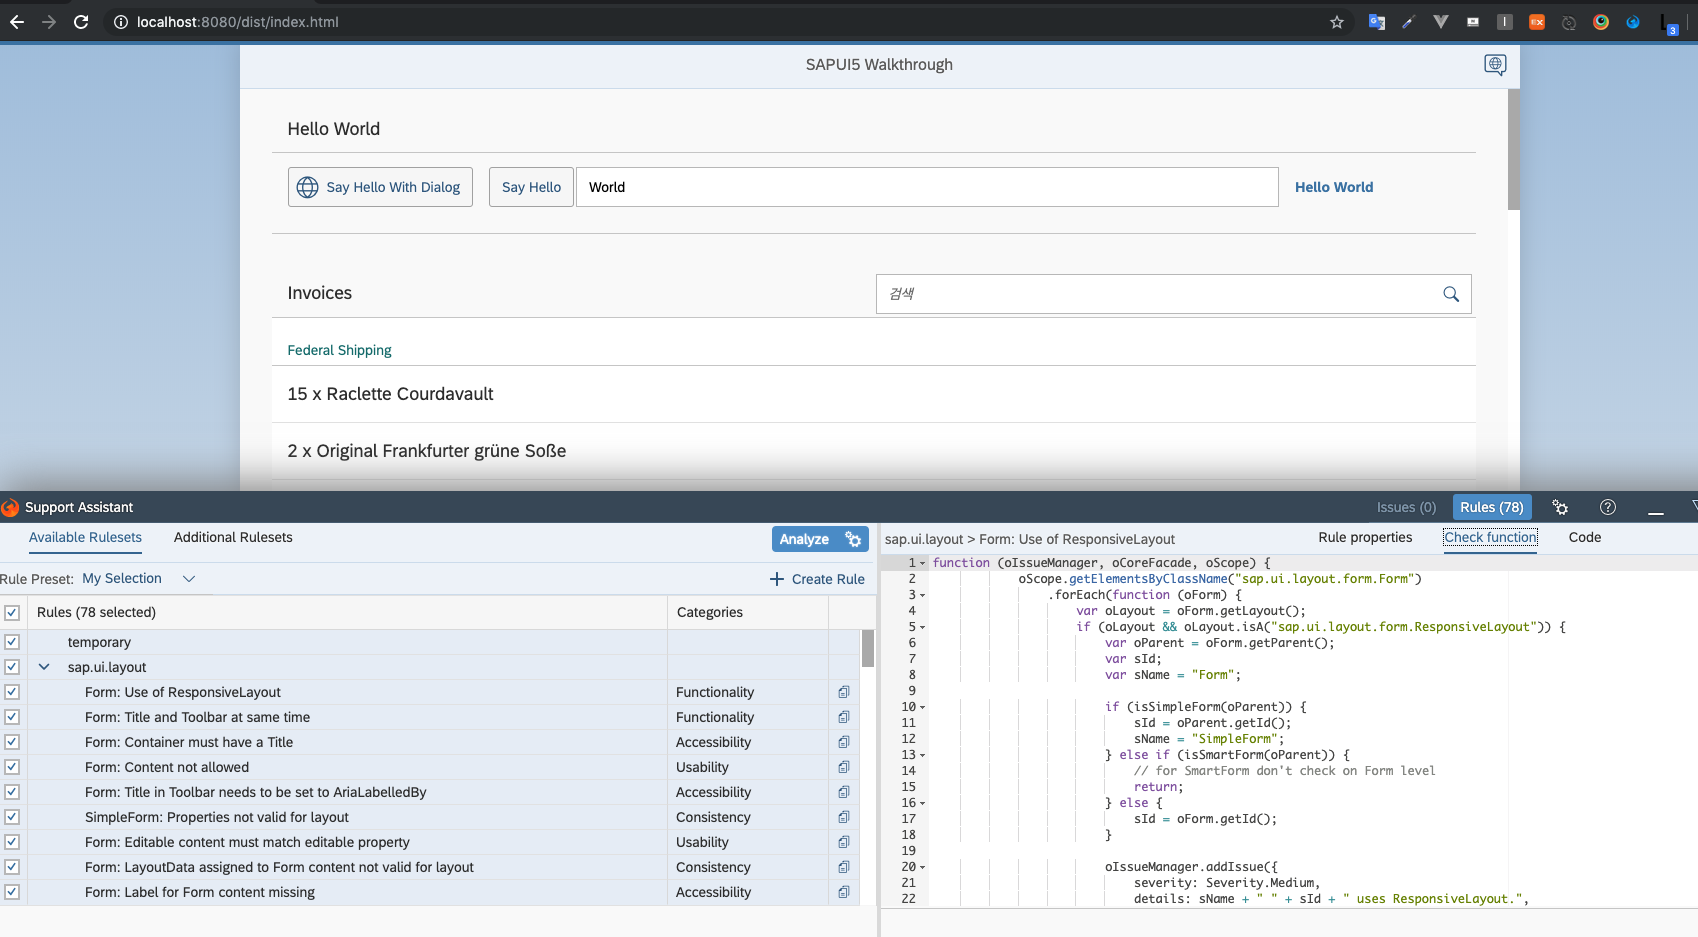
Url창에 http://localhost:[your port]/dist/index.html 입력후
CTRL + ALT + SHIFT + P 단축키를 누르고 지원 보조 도구 열기 버튼을 클릭하면 더 기술적인 디버깅 툴을 사용할 수 있다.
Conventions
- OpenUI5 규칙에 따라 압축되지 않은 소스 파일은 * -dbg.js로 끝난다.
Related Information

UI5/Fiori/BTP 도큐먼트 번역 및 관련 정보 공유합니다.