EDA/웹 크롤링/파이썬 프로그래밍
04. Self Oil Station Price Analysis
01. 셀레니움 설치
- conda install selenium
- pip install selenium
- chromedriver
!pip install selenium
!pip list | grep sele
02.셀레니움으로 접근
from selenium import webdriver
from selenium.webdriver.common.by import By
from tqdm import tqdm_notebook
import time
url = "https://www.opinet.co.kr/searRgSelect.do"
driver = webdriver.Chrome("../driver/chromedriver")
driver.get(url)
time.sleep(3)
driver.switch_to.window(driver.window_handles[-1])
driver.close()
time.sleep(3)
driver.switch_to.window(driver.window_handles[-1])
driver.close()
time.sleep(3)
메인 창으로 전환 후 접근 url 다시 요청
driver.switch_to.window(driver.window_handles[-1])
driver.get(url)
sido_list_raw = driver.find_element(By.ID, "SIDO_NM0")
sido_list_raw.text
sido_name = [option.get_attribute("value") for option in sido_list]
sido_list_raw.send_keys(sido_names[0])
gu_list_raw = driver.find_element(By.ID, "SIGUNGU_NM0")
gu_list = gu_list_raw.find_elements(By.TAG_NAME, "option")
gu_names = [option.get_attribute("value") for option in gu_list]
gu_names = gu_names[1:]
for gu in tqdm_notebook(gu_names):
element = driver.find_element(By.ID, "SIGUNGU_NM0")
element.send_keys(gu)
time.sleep(3)
element_get_excel = driver.find_element(By.ID, "glopopd_excel").click()
time.sleep(3)
driver.close()
03. 데이터 정리하기
!pip install glob2
import pandas as pd
from glob import glob
glob("../data/지역_*.xls")
stations_files = glob("../data/지역_*.xls")
tmp_raw = []
for file_name in stations_files:
tmp = pd.read_excel(file_name, header=2)
tmp_raw.append(tmp)
stations_raw = pd.concat(tmp_raw)
stations_raw
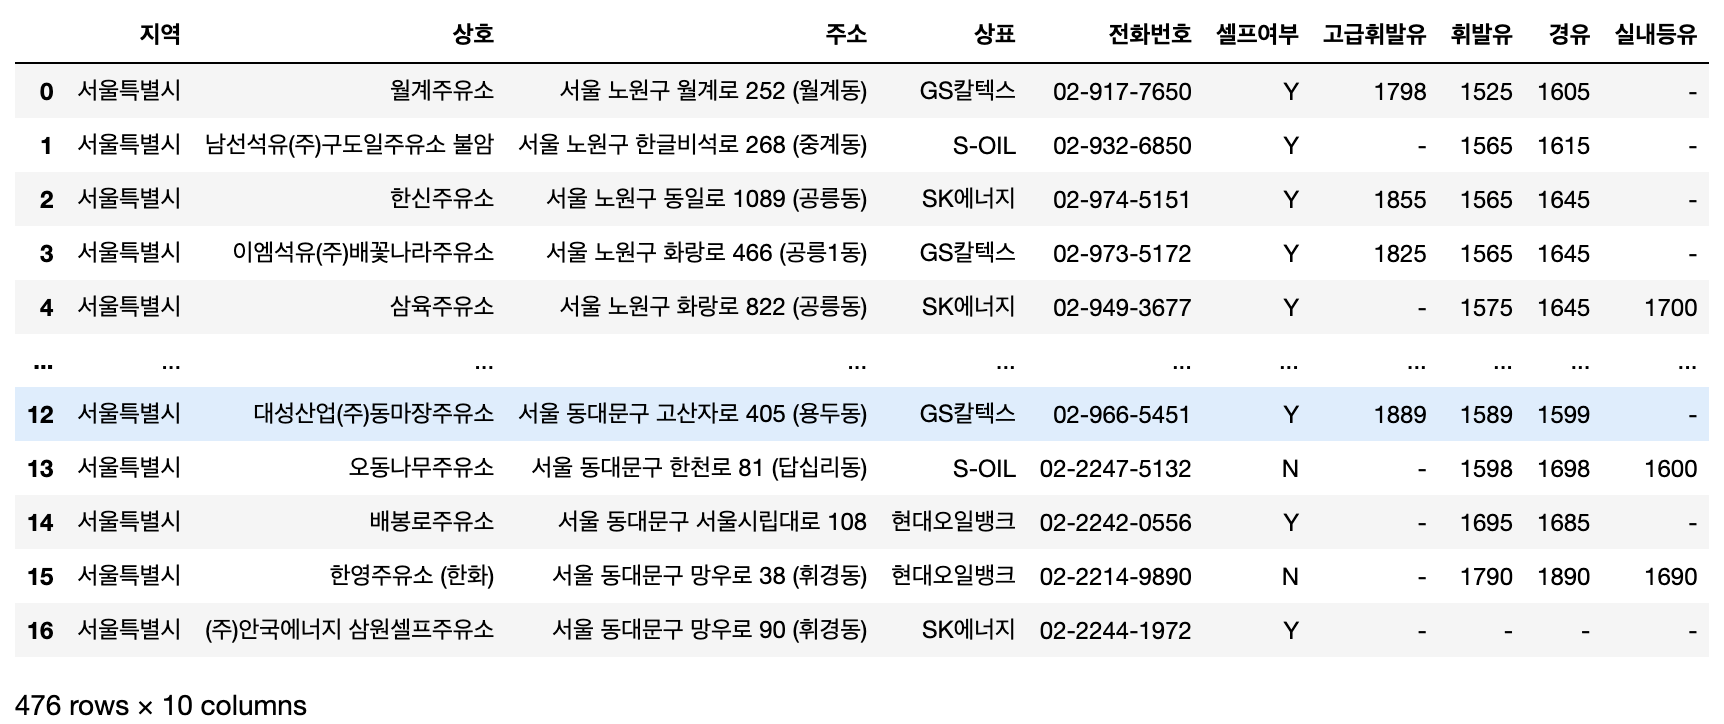
stations = pd.DataFrame({
"상호": stations_raw["상호"],
"주소": stations_raw["주소"],
"가격": stations_raw["휘발유"],
"셀프": stations_raw["셀프여부"],
"상표": stations_raw["상표"]
})
stations["구"] = [eachAddress.split()[1] for eachAddress in stations["주소"]]
stations = stations[stations["가격"] != "-"]
stations["가격"] = stations["가격"].astype(float)
stations.info()
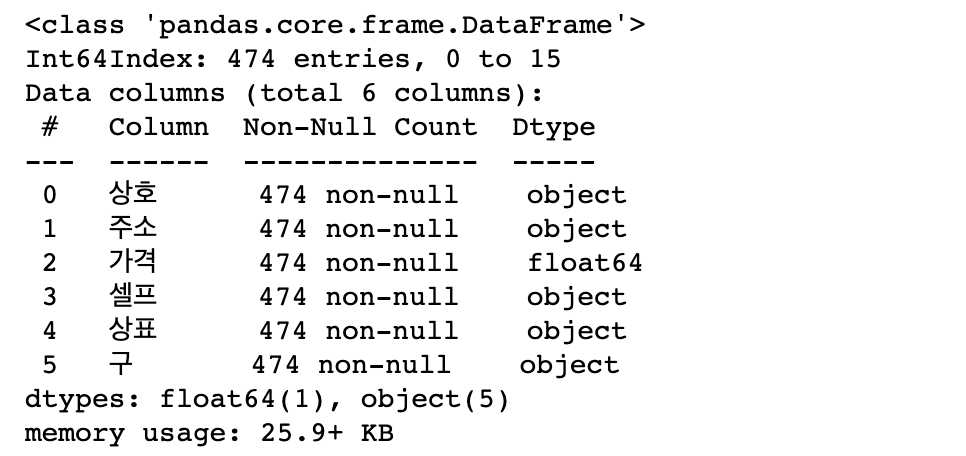
stations
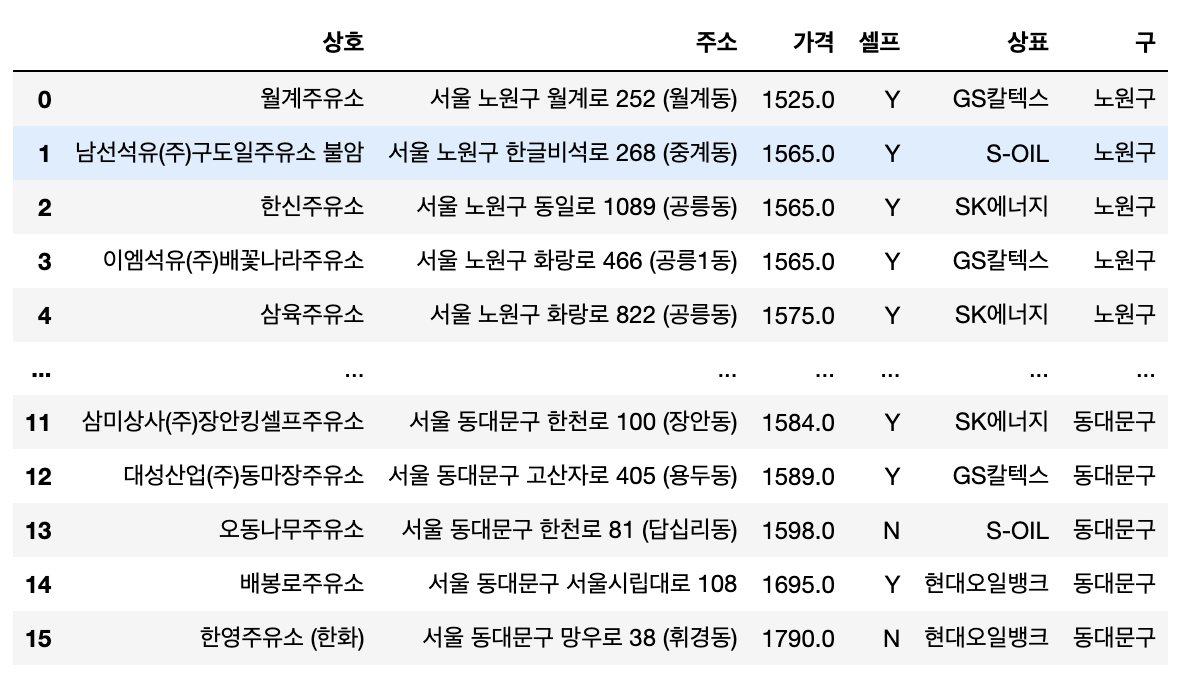
stations.reset_index(inplace=True)
del stations["index"]
stations.tail()
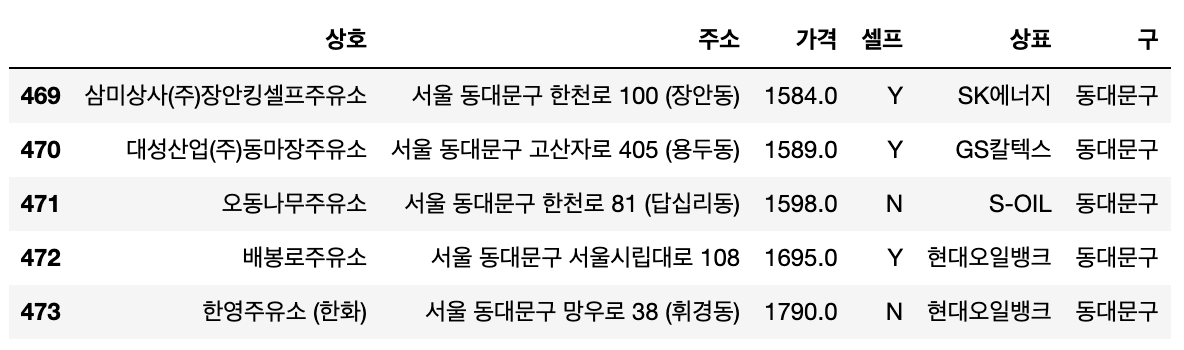
04. 주유 가격 정보 시각화
import matplotlib.pyplot as plt
import seaborn as sns
import platform
from matplotlib import font_manager, rc
get_ipython().run_line_magic("matplotlib", "inline")
path = "C:/Windows/Fonts/malgun.ttf"
if platform.system() == "Darwin":
rc("font", family="Arial Unicode MS")
elif platform.system() == "Windows":
font_name = font_manager.Fontproperties(fname=path).get_name()
rc("font", family=font_name)
else:
print("Unkown system. sorry")
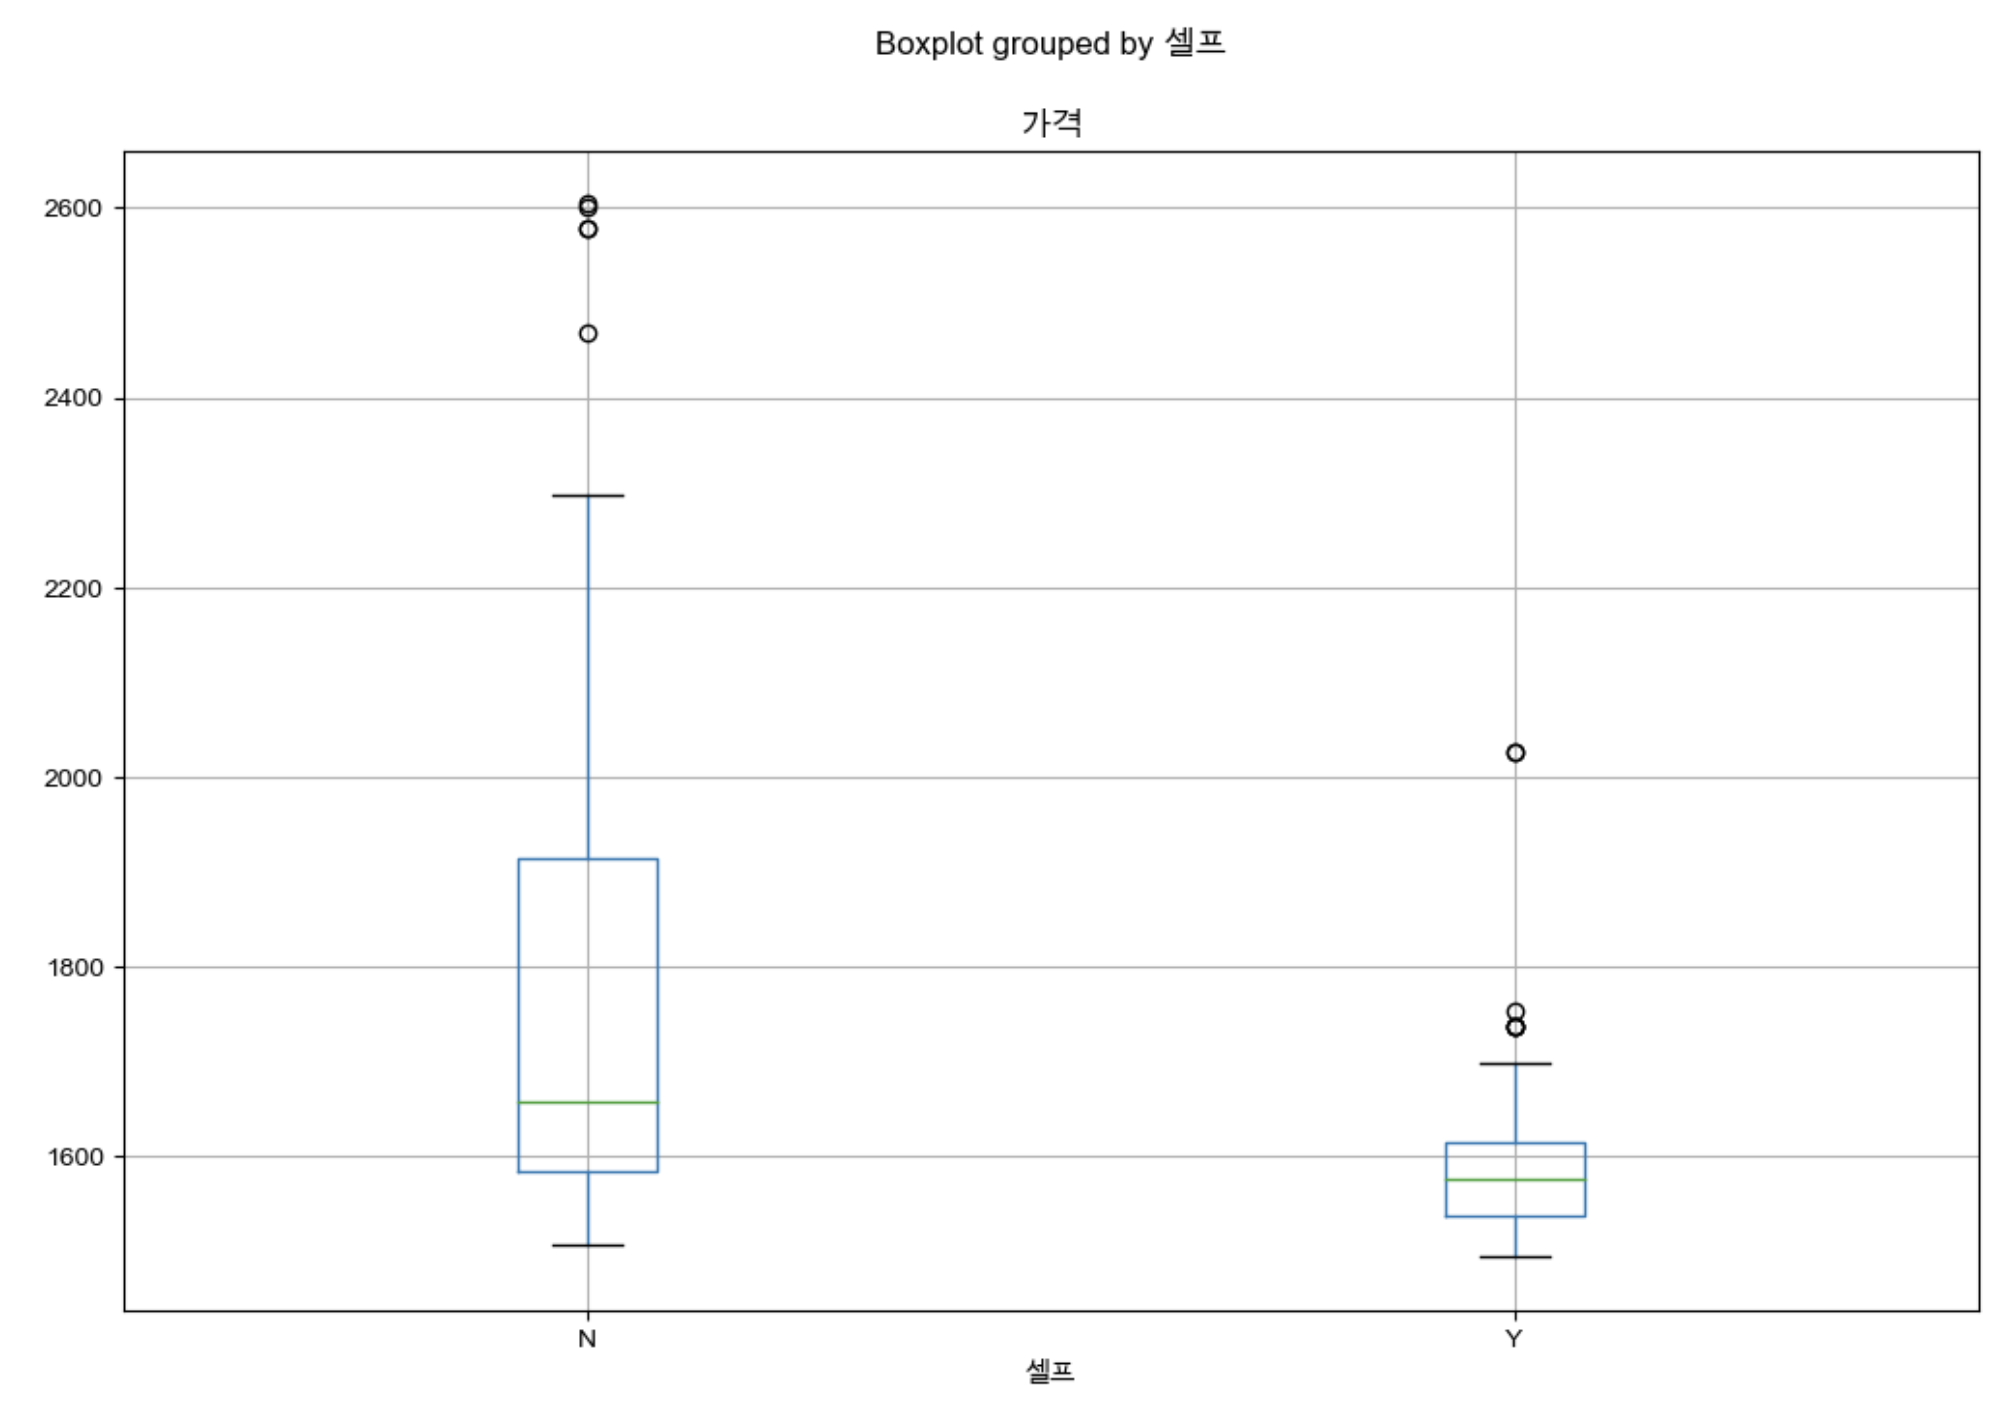
stations.boxplot(column="가격", by="셀프", figsize=(12,8));
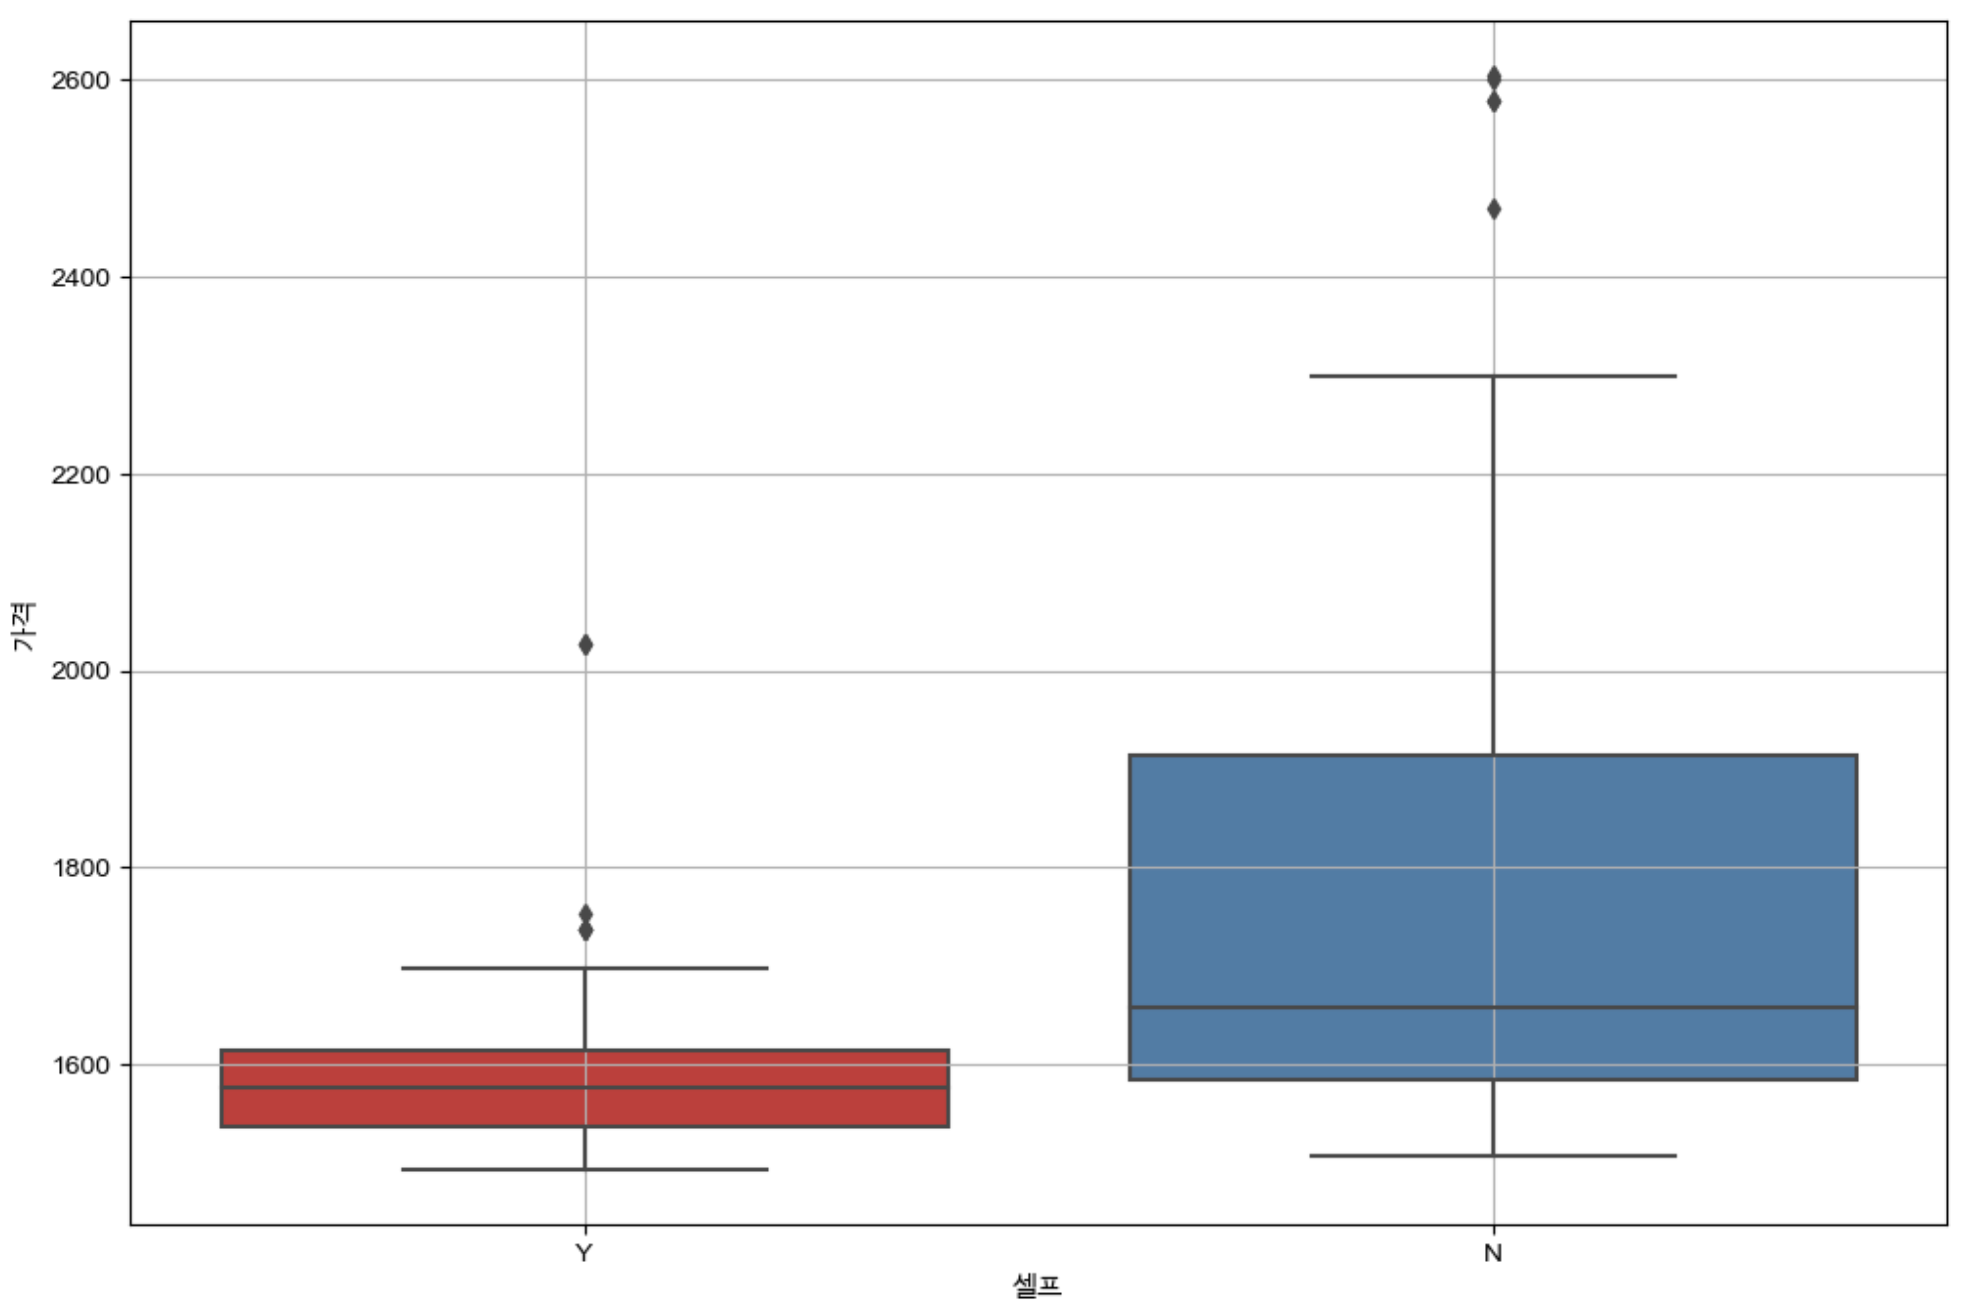
plt.figure(figsize=(12,8))
sns.boxplot(x="셀프", y="가격", data=stations, palette="Set1")
plt.grid(True)
plt.show()
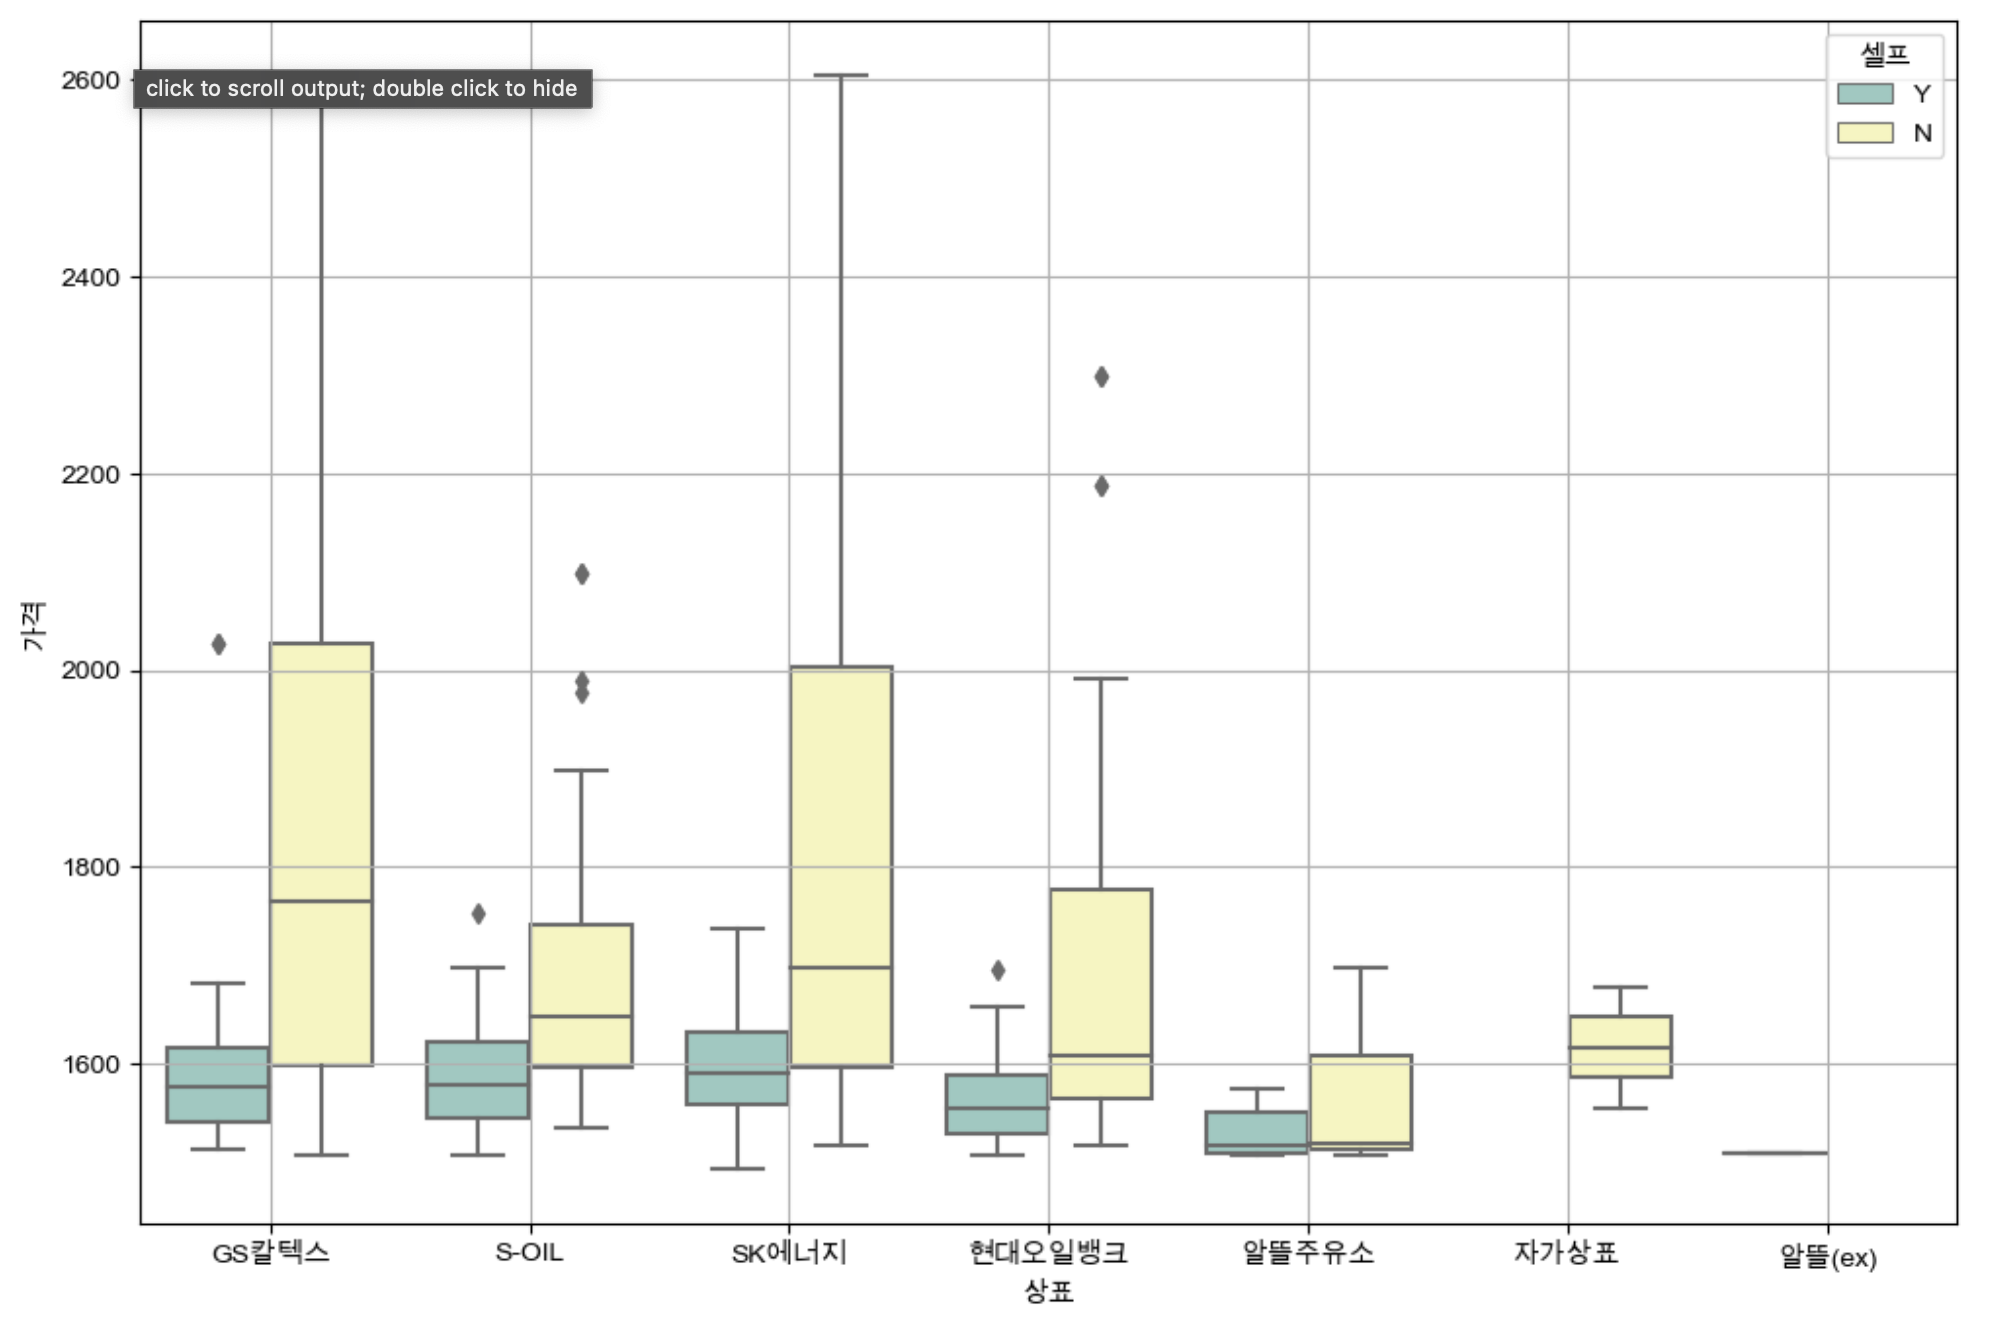
- 셀프 유무, 상표에 따른 가격(boxplot)
plt.figure(figsize=(12,8))
sns.boxplot(x="상표", y="가격", hue="셀프", data=stations, palette="Set3")
plt.grid(True)
plt.show()
import json
import folium
import warnings
warnings.simplefilter(action="ignore", category=FutureWarning)
import numpy as np
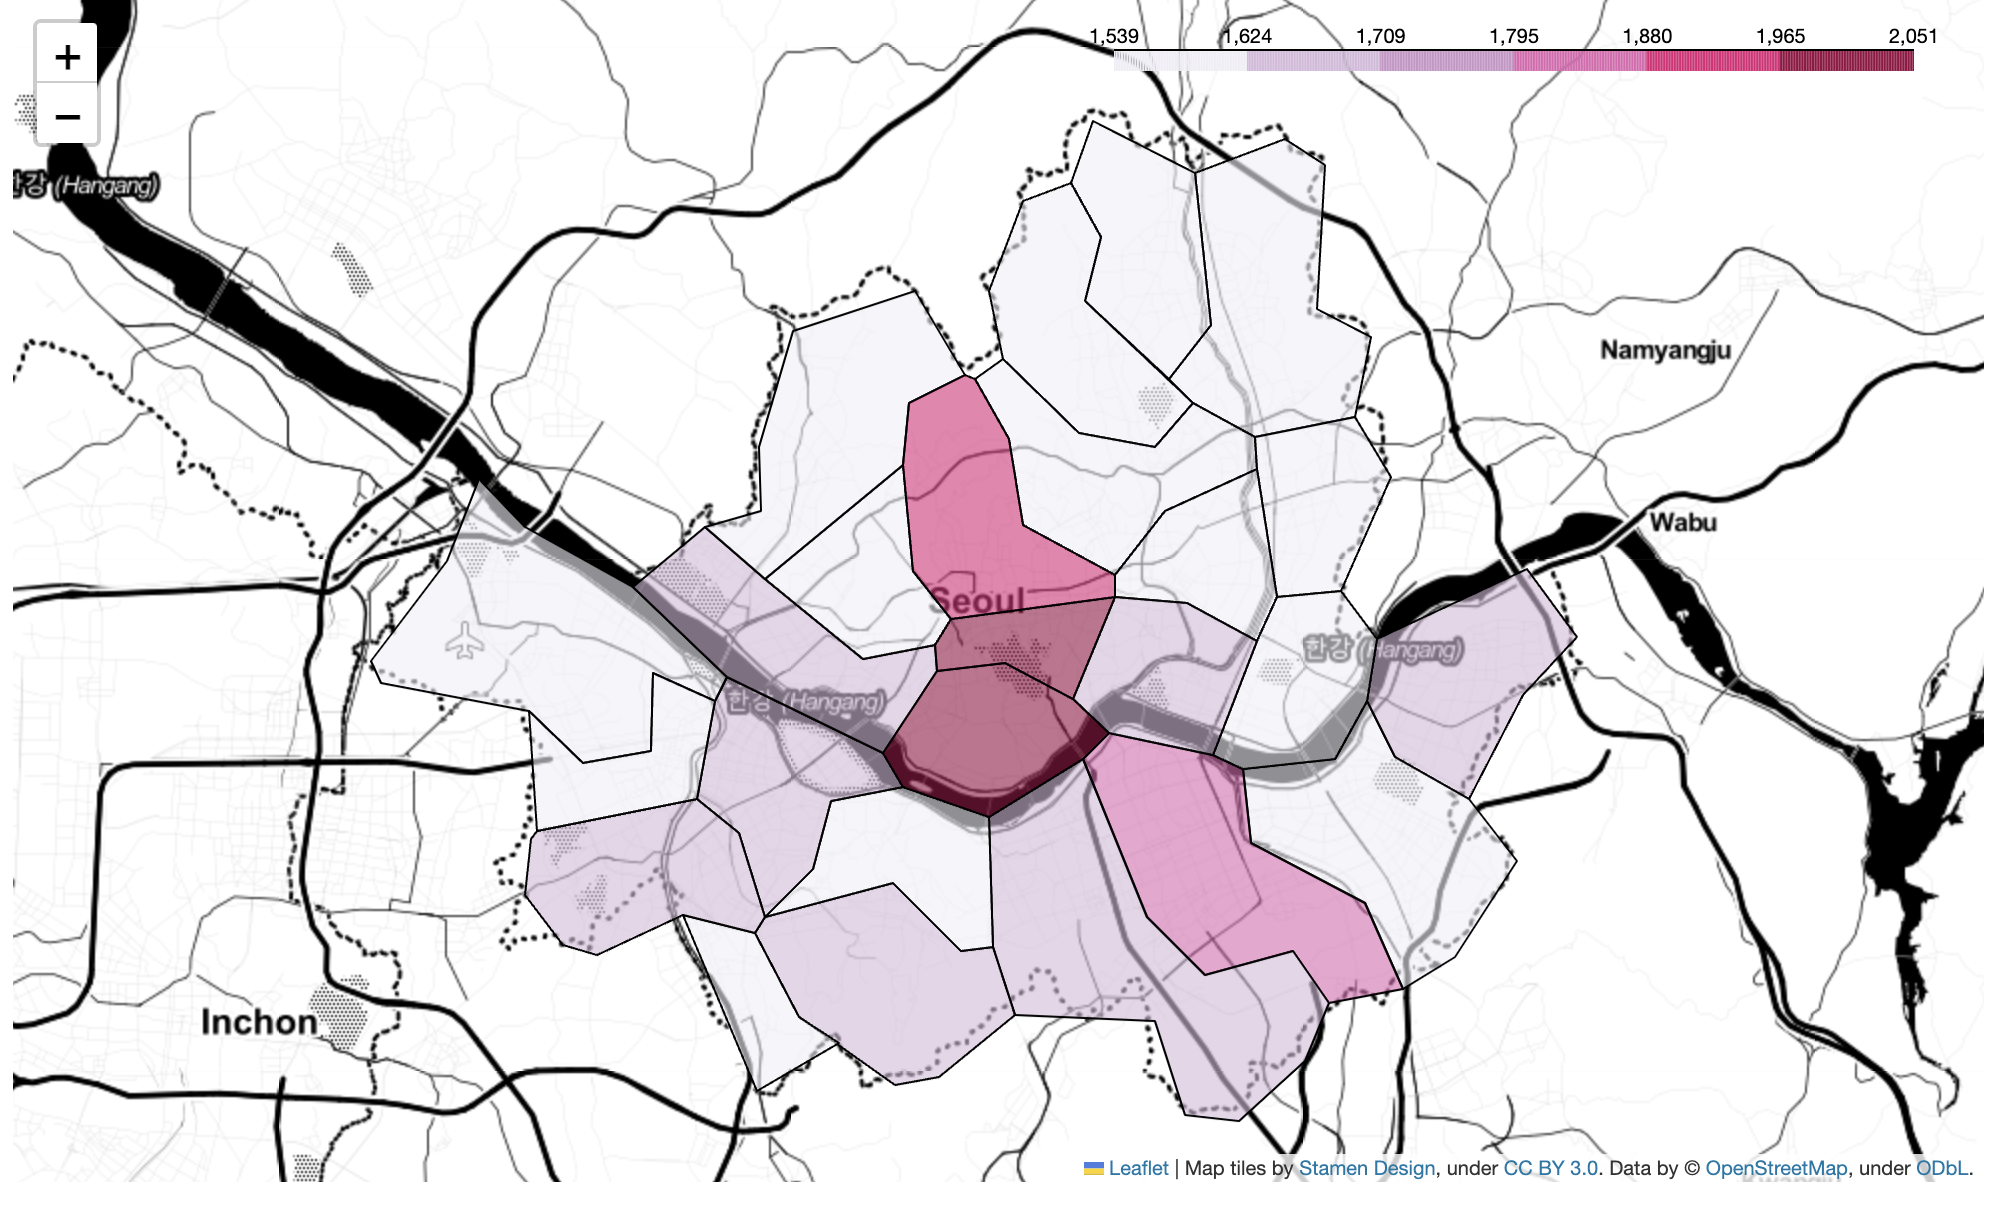
gu_data = pd.pivot_table(data=stations, index="구", values="가격", aggfunc=np.mean)
geo_path = "../data/02. skorea_municipalities_geo_simple 복사본.json"
geo_str = json.load(open(geo_path, encoding="utf-8"))
my_map = folium.Map(location=[37.5502, 126.982], zoom_start=10.5, tiles="Stamen Toner")
my_map.choropleth(
geo_data=geo_str,
data=gu_data,
columns=[gu_data.index, "가격"],
key_on="feature.id",
fill_color="PuRd"
)
my_map