Inspect system traces: Process Memory (RSS)

글 요약 정리
- 프로세스 메모리는 크게 4가지로 구분되어 앱에서 현재 사용중인 실제 메모리의 양을 표시한다.
- Total : 프로세스에서 현재 사용 중인 실제 메모리의 총량
- Allocated : 일반 메모리 할당에 현재 사용되는 실제 메모리의 양 (대부분 힙과 스택 메모리로 구성)
- File Mappings : 파일 매핑에 사용하는 메모리의 양
- Shared : 다른 프로세스 간에 메모리를 공유하는데 사용하는 메모리
Interpretation
For apps deployed to devices running Android 9 or higher, the Process Memory (RSS) section shows the amount of physical memory currently in use by the app.
안드로이드 9 혹은 이상의 기기에서 배포된 앱의 경우 프로세스 메모리 섹션은 앱에서 사용되는 현재 실제 메모리의 양을 보여준다.
Total
This is the total amount of physical memory currently in use by your process. On Unix-based systems, this is known as the "Resident Set Size", and is the combination of all the memory used by anonymous allocations, file mappings, and shared memory allocations.
For Windows developers, Resident Set Size is analogous to the Working Set Size.
프로세스에 의해 사용되는 현재 메모리의 실제 총합이다. 유닉스 시스템에서 Resident Set Size로 알려져있다. 그리고 익명의 할당들, 파일 맵핑들, 공유 메모리 할당의 조합이다. 윈도우 개발자의 경우 RSS는 WSS와 유사하다.
Allocated
This counter tracks how much physical memory is currently used by the process's normal memory allocations. These are allocations which are anonymous (not backed by a specific file) and private (not shared). In most applications, these are made up of heap allocations (with malloc or new) and stack memory. When swapped out from physical memory, these allocations are written to the system swap file.
이 카운터 트랙은 기본 메모리할당 프로세스에 의해 사용되는 현재 메모리 추적한다. 이는 익명(특정 파일을 지원 하지않음)과 비공개(공유되지 않음)인 할당이다. 대부분의 애플리케이션에서는 힙 할당과 메모리할당에 의해 구성된다. 메모리에서 교체가 일어날 때, 이러한 할당은 시스템 스왑 파일에 기록된다.
File Mappings
This counter tracks the amount of physical memory the process is using for file mappings – that is, memory mapped from files into a region of memory by the memory manager.
이 카운터 트랙은 파일 매핑에 사용하는 프로세스 메모리를 추적한다. 즉, 메모리 관리자에 의해 파일에서 메모리로 매핑한 메모리이다.
Shared
This counter tracks how much physical memory is being used to share memory between this process and other processes in the system.
이 카운터 트랙은 시스템에서 해당 프로세스와 다른 프로세스 간에 공유하는 메모리를 추적한다.
PS

CPU Profile을 통해 현재 개발 중인 앱에 적용시켜 보았다.
클릭 이벤트부터 현재 액티비티가 무엇인지 (이건 다른 프로젝트를 참고하거나 추후 유지보수하게 될 경우 요긴하게 쓰일 것 같다), 메모리 네트워크 등을 파악할 수 있었다.
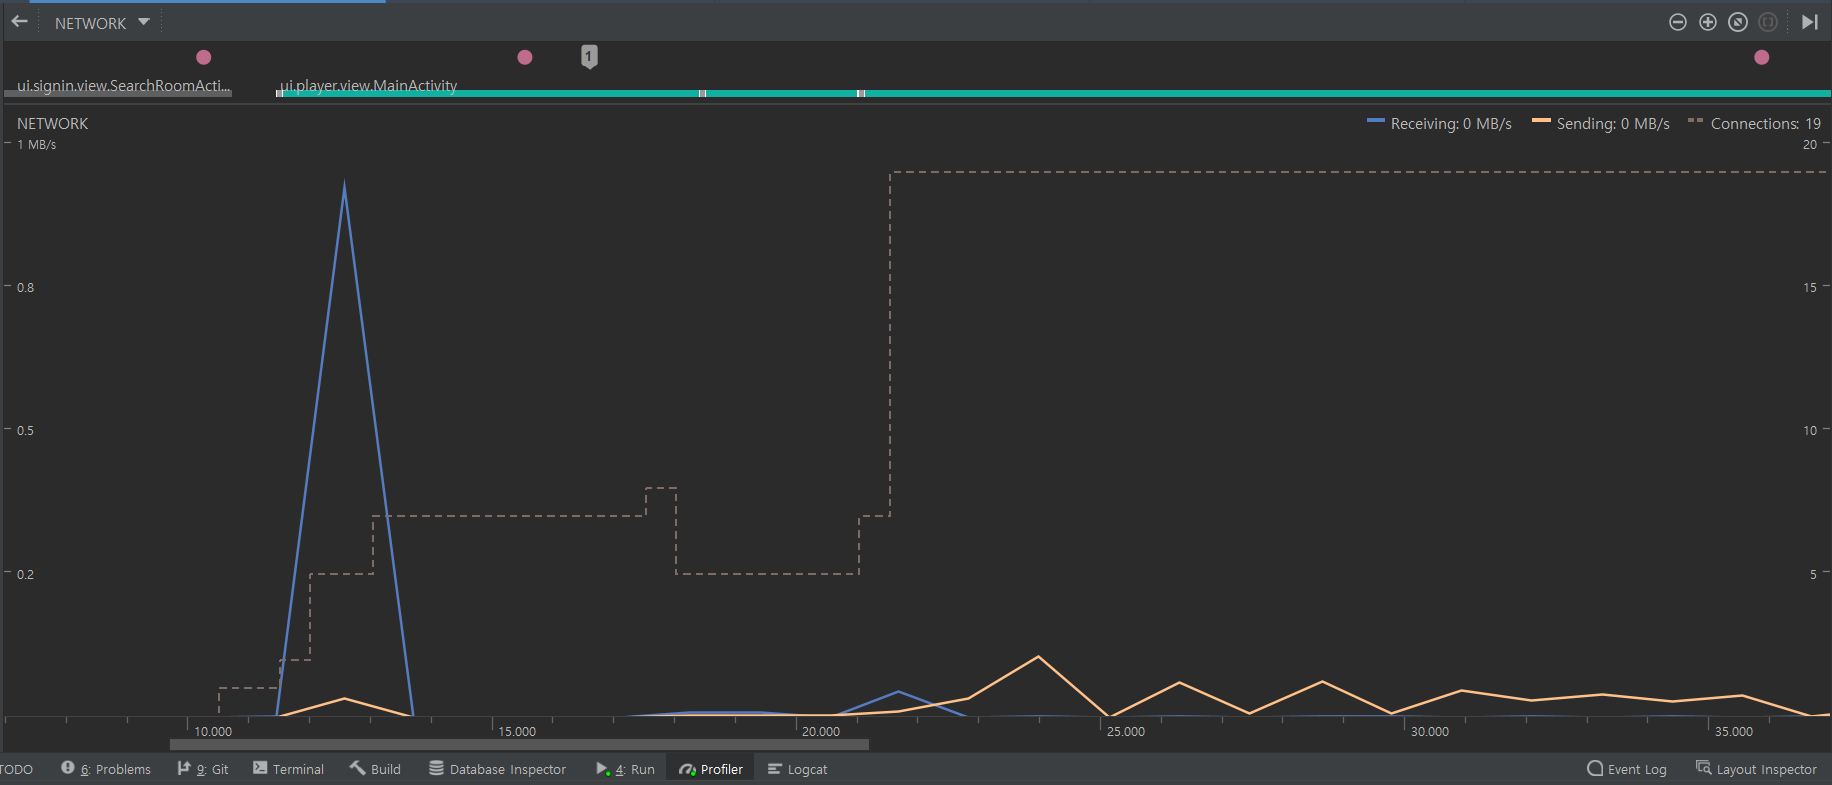
각각의 스레드들이 얼마나 메모리를 차지하는지는 더 복잡한 작업일 때 보겠지만 캡처화면에서 보이는 것처럼 파란색 그래프는 웹뷰에서 첫 초기화 시 브릿지로 데이터를 가져올때이고 주황색으로 표시된 전송 네트워크 그래프는 내 화면 FMCS를 Web-RTC를 통해 보낸 그래프이다.
초반에 꺽임선이 잘 보일 땐 정상적으로 전송하는 모습이고 이후 꺽임선이 좁혀지는 것은 유저의 화면을 전송하지 않는 버튼을 눌렀을 때 발생하는 모습이다.
Generate Trace Logs by Instrumenting Your App
- 코드를 이용해서 앱 실행 정보를 기록하는 것을 관리 할 수 있다. 시작하는 지점과 중지하는 지점을 정확하게 명시할 수 있다. 기록된 정보는 CPU 프로파일러를 사용해 트레이스를 확인 할 수 있다.
- 앱 기록 시작 : startMethodTracing()
- 앱 기록 중지 : stopMethodTracing()
- 앱에서 여러번 기록을 하는데 이름을 변경 하지 않을 경우 기존 로그를 덮어쓴다. 그래서 여러 로그를 저장하기 위해서는 동적으로 저장해주어야 한다. 공식 문서에서는 날짜와 시간을 통해 저장하는 것을 추천한다.
- 트레이스 로그를 실행하려면 View > Tool Windows > Device File Explorer 클릭 후 .trace 파일을 보면 된다.
Interpretation
To generate a method trace of your app's execution, you can instrument your app using the Debug class. Instrumenting your app this way gives you more control over exactly when the device starts and stops recording tracing information. The device also saves your trace logs using the names you specify, so you can easily identify each log later. You can then view each trace log using the Android Studio CPU Profiler.
앱 실행 메소드 트레이스를 만들기 위해서 디버그 클래스를 사용하여 앱을 계측할 수 있다. 계측은 기기 추적 정보를 기록하는 시작과 종료 지점을 조금 더 정확하게 제공한다. 기기는 또한 특정 이름을 사용하여 추적 로그를 기록하며 손쉽게 각각의 로그를 구분할 수 있다. 안드로이드 스튜디오 CPU Profiler를 사용해 각각의 추적 로그를 볼 수 있다.
You can also start and stop tracing in the CPU Profiler without instrumenting your app's code.
Before you start generating trace logs, make sure your app has added logic to save trace logs to its app-specific directory.
또한 계측하는 앱 코드 없이도 CPU 프로파일러에서 시작과 종료를 추적할 수 있다. 추적 로그를 시작하기 전에 앱 특정 폴더에 저장하기위한 추가 로직이 있는지 확실히 해야한다.
Instrument your app
To create trace logs, call startMethodTracing() where you want the system to start logging tracing data.
In the call, you can specify the name for the .trace file, and the system saves it to a package-specific directory that's intended for persistent app data on the target device—this is the same directory that is returned by getExternalFilesDir() and is located in the ~/sdcard/ directory on most devices. This file contains the binary method trace data and a mapping table with thread and method names. To stop tracing, call stopMethodTracing().
Debug.startMethodTracing("sample")
Debug.stopMethodTracing()
추적 로그를 만들기 위해서, 원하는 지점에 startMethodTracing()를 호출한다. 호출 시 .trace 파일로 이름을 지정할 수 있고 시스템은 파일은 저장한다. 이 디렉터리는 대부분의 기기에서 ~/sdcard 에 위치한다. 추적을 중지하려면 stopMethodTracing()을 호출한다.
Note that if your app calls the startMethodTracing() again without changing the name of the trace log, it overwrites the existing log saved to the device. To learn how to dynamically change the name of each trace log, go to the section about saving multiple logs.
startMethodTracing() 메소드를 이름 변경없이 반복해서 호출한다면 기존에 저장된 로그를 덮어쓰기한다.
If the system reaches the maximum buffer size before you call stopMethodTracing(), the system stops tracing and sends a notification to the console. The methods that start and stop traces work across your entire app process. That is, you could call startMethodTracing() in your activity's onCreate(Bundle) method, and call stopMethodTracing() in that activity's onDestroy() method.
시스템이 stopMethodTracing()를 호출하기 전에 최대 버퍼 사이즈에 도달한다면 시스템은 추적을 중지하고 공지를 콘솔에 전송한다. 추적 시작과 중지는 앱 프로세스 전체에 작동한다. 즉, 액티비티 onCreate에서 시작하고 onDestroy에서 중지를 호출할 수 있다.
Note that your app runs more slowly when profiling is enabled. That is, you shouldn't use the profiling data to determine absolute timings (such as, "method foo() takes 2.5 seconds to run"). The timing information in the trace logs are useful only when comparing it to previous trace logs, so you can see if recent changes make your app faster or slower.
프로파일링은 앱을 느리게 만들 수 있다. 즉, 절대적인 시간을 판단하기 위해서 프로파일링을 사용하면 안된다.
When deploying to devices running Android 5.0 (API level 21) and higher, you can use sample-based profiling to profile with less runtime performance impact. To enable sample profiling, call startMethodTracingSampling() (instead of calling startMethodTracing()) with a specified sampling interval. The system gathers samples periodically until your app calls stopMethodTracing().
API 21 이상의 기기에서 startMethodTracing() 대신 startMethodTracingSampling() 메소드를 호출하면 런타임 성능을 최소화 할 수 있다.
Save multiple logs
If your app starts and stops a method trace multiple times without specifying a new name for the trace log, the device overwrites the older trace log with the new one—that is, it only keeps the most recent trace log. To save multiple trace logs to your device, dynamically rename the trace log each time your app calls startMethodTracing(). The sample below uses the SimpleDateFormat class to include the current date and time when naming each trace log:
// the current date and time.
val dateFormat: DateFormat = SimpleDateFormat("dd_MM_yyyy_hh_mm_ss", Locale.getDefault())
val logDate: String = dateFormat.format(Date())
// Applies the date and time to the name of the trace log.
Debug.startMethodTracing("sample-$logDate")
새로운 이름으로 특정하지 않고 여러번 시작 및 중지한다면 오래된 추적 로그는 덮여쓰기 된다. 여러 추적 기록을 저장하기 위해서 동적으로 각각의 시간을 지어준다. 예로 SImpleDataFormat 클래스를 사용해 현재 날짜와 시간을 포함해 각각의 추적 로그를 네이밍 한다.
📗 단어 정리 📘
| 영어 | 한글 |
|---|---|
| analogous | 유사한 |
| that is | 즉 |
| generate | 생성하다 |
| instrument | 계측 |