Audio Graphs
https://developer.apple.com/documentation/accessibility/audio_graphs
"Provide an audible representation of the data in your charts and graphs."
차트 및 그래프에서 데이터의 오디오 표현을 제공합니다.
Overview
차트와 그래프는 사용자가 데이터에 있는 중요한 특징 및 추세를 빠르게 확인하도록 돕습니다. 보이스오버가 차트 및 그래프에서 데이터의 오디오 표현을 구성할 수 있도록 모든 정보를 제공하는 오디오 그래프 API를 사용하시기 바랍니다. 이는 시각적 결함이 있는 사람들에게 가치있는 데이터 인사이트에 접근할 수 있도록 해줍니다.

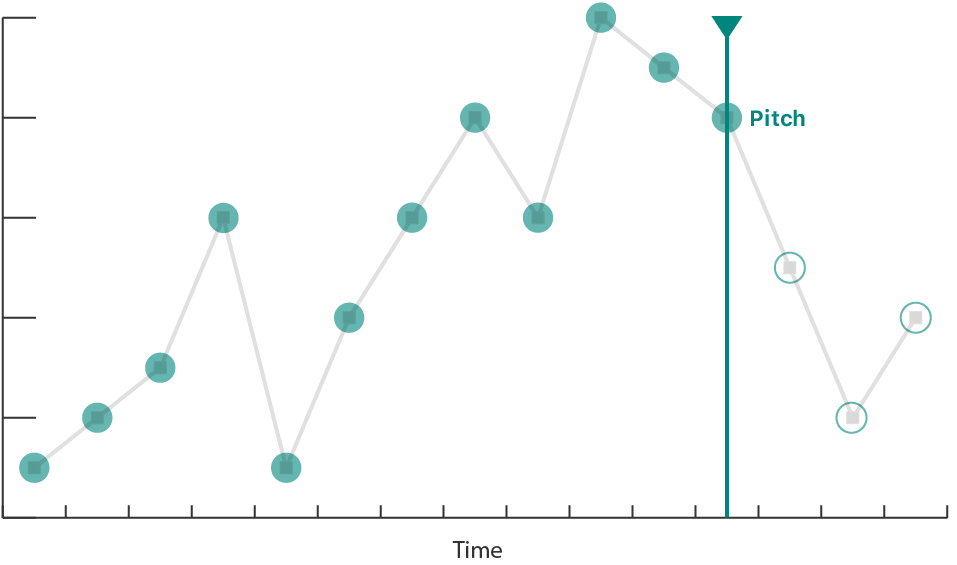
오디오 그래프는 차트에 있는 데이터를 오디오 표현으로 변환시키며, 오디오로 각 축에 대한 데이터를 인코딩함으로써 이뤄집니다. 오디오 그래프는 X 축에 시간을 나타내고, Y 축에 피치를 나타냅니다. 예를 들어 하향 선형 추세를 보여주는 scatter 플롯의 오디오 표현은 점점 감소하는 피치에서 개별적인 톤의 연속이 될 것입니다. 주식 차트의 오디오 표현은 오디오 재생 시간(X 축)에 따라 주식 가격(Y축)의 상승 및 하락을 모듈화 하는 피치와 함께 연속적인 톤이 될 것입니다.
Related Sessions from WWDC21
Session 10122: Bring Accessibility to Charts in Your App
Session 10122: Bring Accessibility to Charts in Your App
https://developer.apple.com/videos/play/wwdc2021/10122/
Topics
Essentials
Representing Chart Data as an Audio Graph
데이터의 오디오 표현을 구성하기 위해서, 보이스오버를 위한 차트 컴포넌트의 접근 가능한 표현을 정의합니다.
https://developer.apple.com/documentation/accessibility/audio_graphs/representing_chart_data_as_an_audio_graph
https://velog.io/@panther222128/Representing-Chart-Data-as-an-Audio-Graph
See Also
Accessibility Framework
Customized Accessibility Content
사용자가 필요하다고 할 때, 사용자에게 측정된 부분 내에서 접근성 정보를 제공할 수 있도록 앱을 커스터마이징합니다.
https://developer.apple.com/documentation/accessibility/customized_accessibility_content
https://velog.io/@panther222128/Customized-Accessibility-Content
Hearing Device Support
페어링 된(paired) 보청기와 스트리밍 상태에 대한 정보에 접근합니다.
https://developer.apple.com/documentation/accessibility/hearing_device_support
https://velog.io/@panther222128/Hearing-Device-Support
