도넛을 커스텀 해보자.
1. Intaillation
- chart.js install
1.1 chart.js 공식 문서: https://www.chartjs.org/docs/latest/getting-started/
1.2 설치:npm install chart.js - react-chartjs-2 install
2.1 react-chartjs-2 공식 문서: https://react-chartjs-2.js.org/
2.2 설치: npm install --save chart.js react-chartjs-2
2. import
- react-chartjs-2 공식 문서를 참고하여 Chart Doughnut을 import하자.
import { Chart as ChartJS, ArcElement, Tooltip, Legend } from "chart.js";
import { Doughnut } from "react-chartjs-2";

ChartJS.register(ArcElement, Tooltip, Legend);

<Doughnut data={...} />
3. Data 넣기
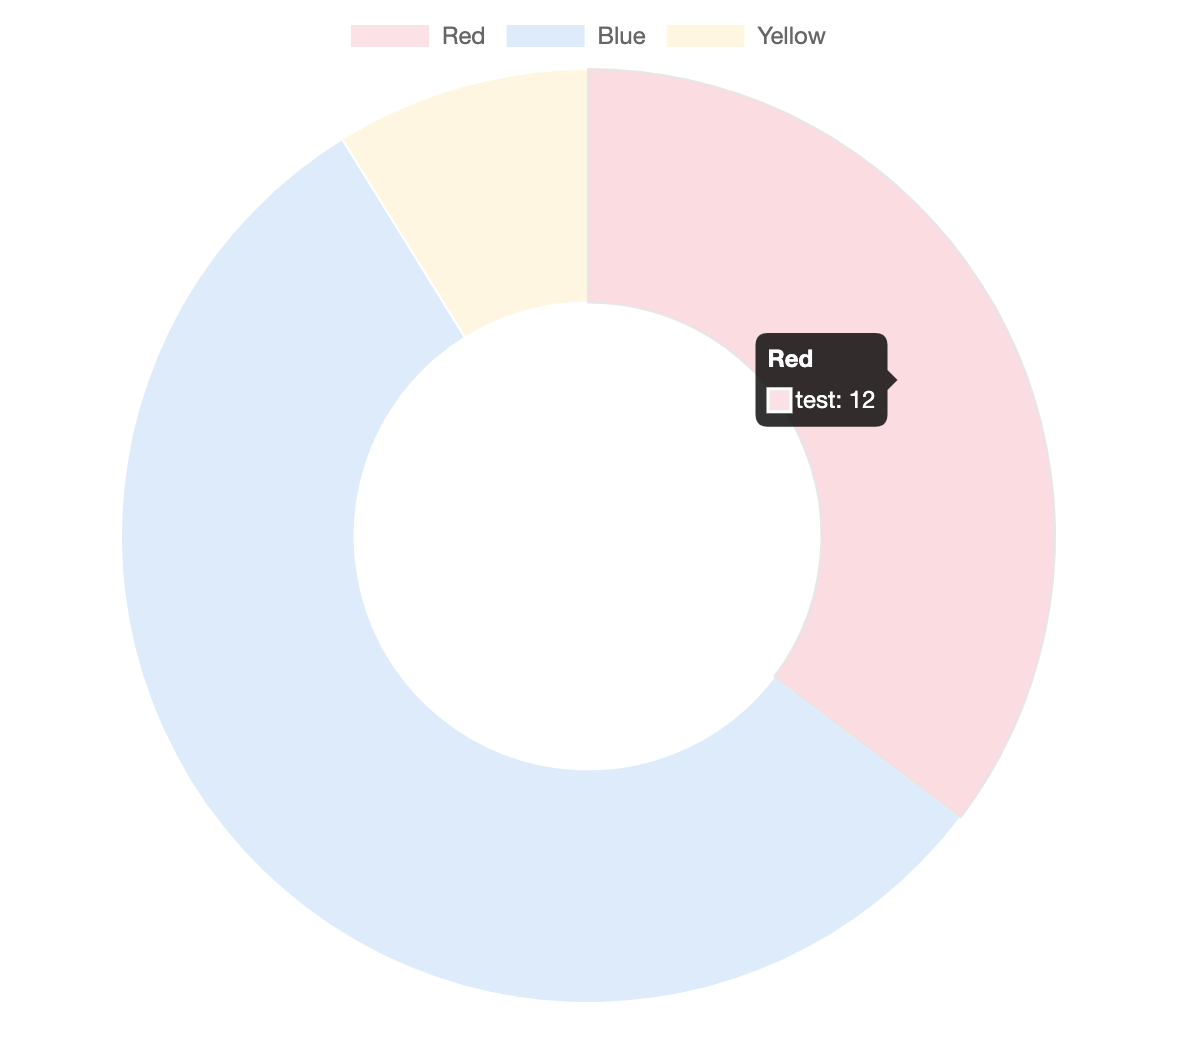
- 아래 코드를 입력하여 차트를 만들어보자.
export default function Chart() {
  const data = {
    labels: ["Red", "Blue", "Yellow"],
    datasets: [
      {
        label: "test",
        data: [12, 19, 3],
        backgroundColor: ["rgba(255, 99, 132, 0.2)", "rgba(54, 162, 235, 0.2)", "rgba(255, 206, 86, 0.2)"],
        borderWidth: 1,
      },
    ],
  };

  return (
    <>
      <div style={{ width: "500px", height: "500px", margin: "0 auto" }}>
        <Doughnut data={data} options={options} />
      </div>
    </>
  );
}
1.1 그러면 아래와 같은 chart를 얻을 수 있다.
4. Option 활용하기
- option을 활용하여 tooltip을 커스텀 해보자.
1.1 아래 코드를 option으로 넣어주자.
const options = {
    plugins: {
      legend: {
        labels: {
          // This more specific font property overrides the global property
          font: {
            size: 14,
          },
        },
      },
      tooltip: {
        titleFont: {
          size: 12,
        },
        bodyFont: {
          size: 12,
        },
        footerFont: {
          // size: 10, // there is no footer by default
        },
        callbacks: {
          title: () => {
            return "title이랑 label 위치 변경!";
          },
          label: (item) => {
            const count = item.dataset.data[item.dataIndex];
            const label = item.label;
            const info = ` ${label} : ${count}`;
            return info;
          },
        },
      },
    },
  };

  // 이하 생략
  // <Doughnut data={data} options={options} /> option을 도넛에 넣어주자.
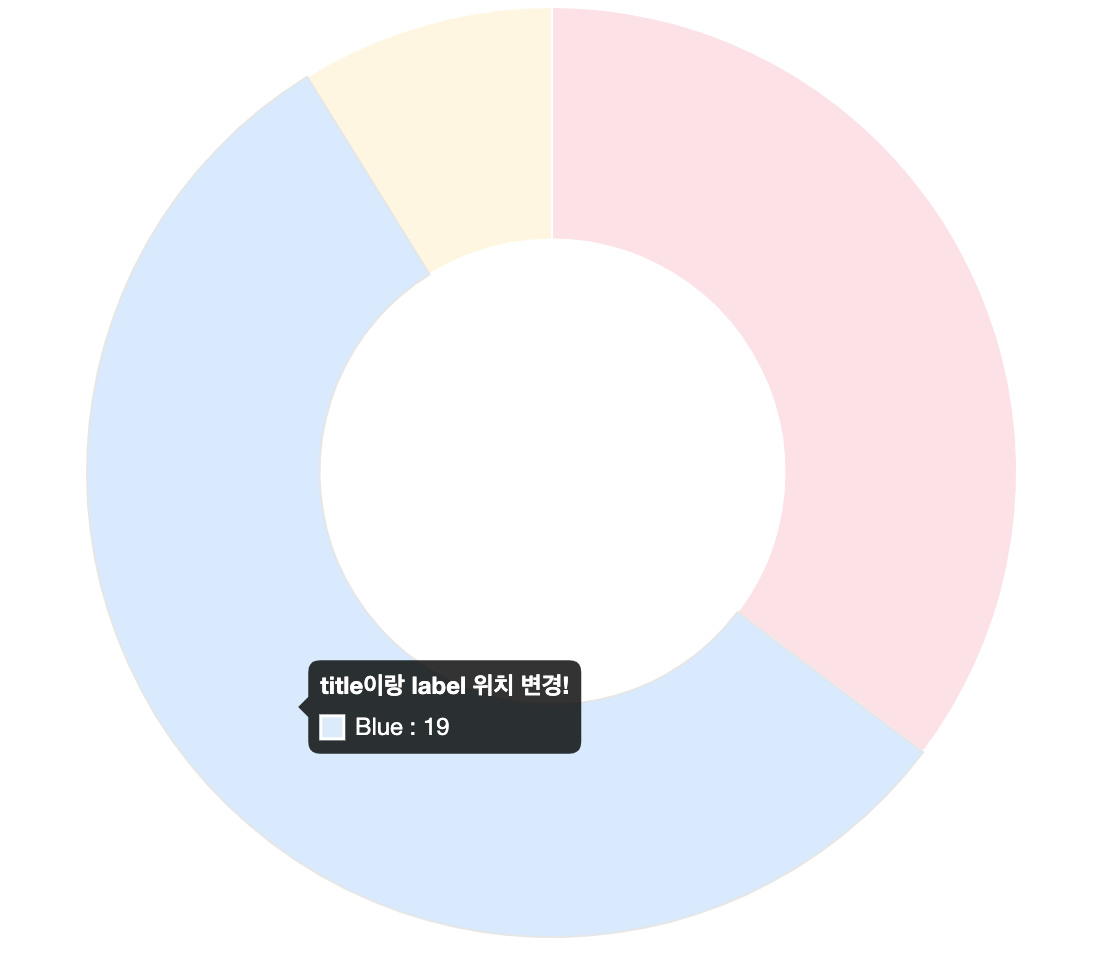
2. 그러면 위 그림과 같이 title과 lable 위치가 바뀐 걸 볼 수 있다.
3. 여기서 포인트는 callbacks 함수를 활용하여 dataset의 property를 값을 바꿀 수 있다는 점이다.
3.1 예를 들어서 title: () => {return "타이틀 변경"}처럼 제목을 바꿀 수 있다. 콜백 함수를 잘 활용하자..!
3.2 그리고 콜백 함수에서 console.log()가 가능하니 인자로 들어온 값을 찍어서 어떤 데이터가 들어오는 지 확인하면 수정하기 더 수월하다. 꿀팁..!
5. 번외
- 도넛의 형제 요소를 도넛 가운데로 위치 시킬 경우 툴팁 글자가 가려지는 경우가 있다.
1.1 예시 코드 (css 스타일링은 알아서..)
	<div>
    	<Doughnut data={...} />
        <ul>
        	<li>정보 1</li>
            <li>정보 2</li>
            <li>정보 3</li>
         </ul>
     </div>
- 이때는 도넛을 커스텀하기 위해 아등바등 하는 것보다 부모 요소인
div에 z-index를 10을 주고 툴팁을 가리는 형제 요소ul에 z-index를 -1을 주자.
2.1 원리는 css z-index layer로 https://developer.mozilla.org/ko/docs/Web/CSS/z-index MDN 공식 문서를 참고하자.
pending...