서비스를 운영할 때 애플리케이션의 CPU, 메모리, 커넥션 사용, 고객 요청수와 깉은 수 많은 지표를 확인하는 것이 매우 중요하다. 그래야 어디에 어떤 문제가 발생했는지 사전에 대처가 가능하고, 문제 파악을 쉽게 할 수있다. 예를 들어 메모리 사용량이 가득 찼다면, 메모리 문제와 관련있는 곳을 빠르게 찾아서 대응 가능하다.
📌 마이크로미터(Micrometer)
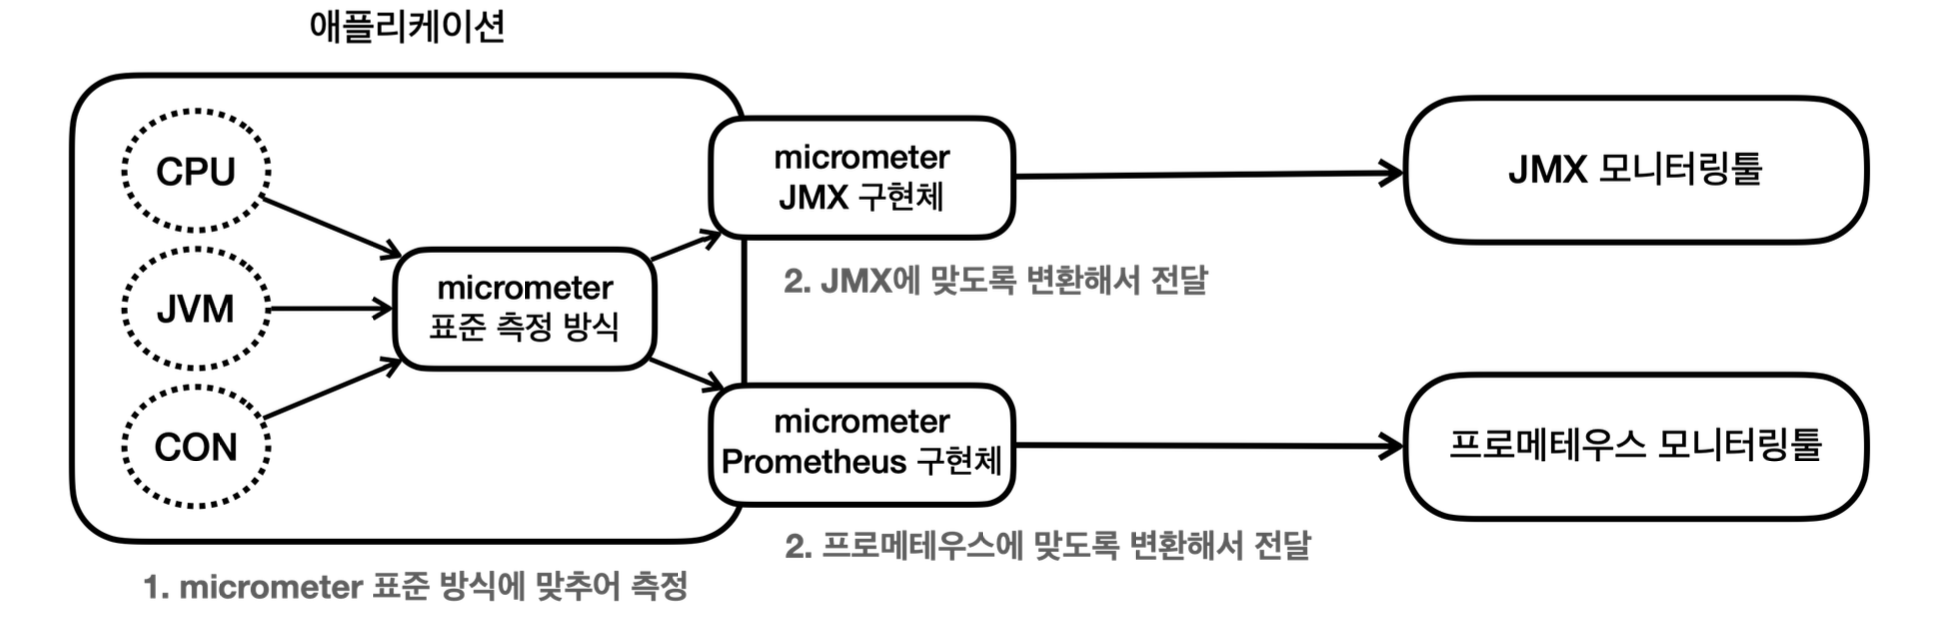
세상에는 수 많은 모니터링 툴(그라파나, 핀포인트)이 존재한다. 하지만 중간에 사용하는 모니터링 툴을 변경하면 상당히 개발자 입장에서는 불편해진다. 따라서 이런 문제를 해결하는 것이 바로 마이크로미터(Micrometer)다.
마이크로미터가 지원하는 모니터링 툴
AppOptics, Atlas, CloudWatch, Datadog, Dynatrace, Elastic, Ganglia, Graphite, Humio, Influx, Instana, JMX, KairosDB, New Relic, Prometheus, SignalFx, Stackdriver, StatsD, Wavefront
메트릭(Metric)
- 메모리 사용률, CPU 사용률, 스레드 사용률 등등 시간에 따른 추이를 추적할 가치가 있는 데이터를 말한다.
- 스프링 부트 액추에이터는 마이크로미터가 제공하는 지표 수집을
@AutoConfiguration를 통해 자동 등록 해준다. - metrics 엔드포인트
metrics엔드포인트를 사용하면 기본으로 제공되는 메트릭들을 확인 가능
http://localhost:8080/actuator/metrics
metrics엔드포인트는 다음과 같은 패턴을 사용해서 더 자세히 확인 가능
http://localhost:8080/actuator/metrics/{name}
🤔 사용자 정의 메트릭
사용자가 직접 메트릭을 정의 할 수도 있다. 예를 들어 주문수, 취소수를 메트릭으로 만들 수 있다.
📌 프로메테우스(Prometheus)
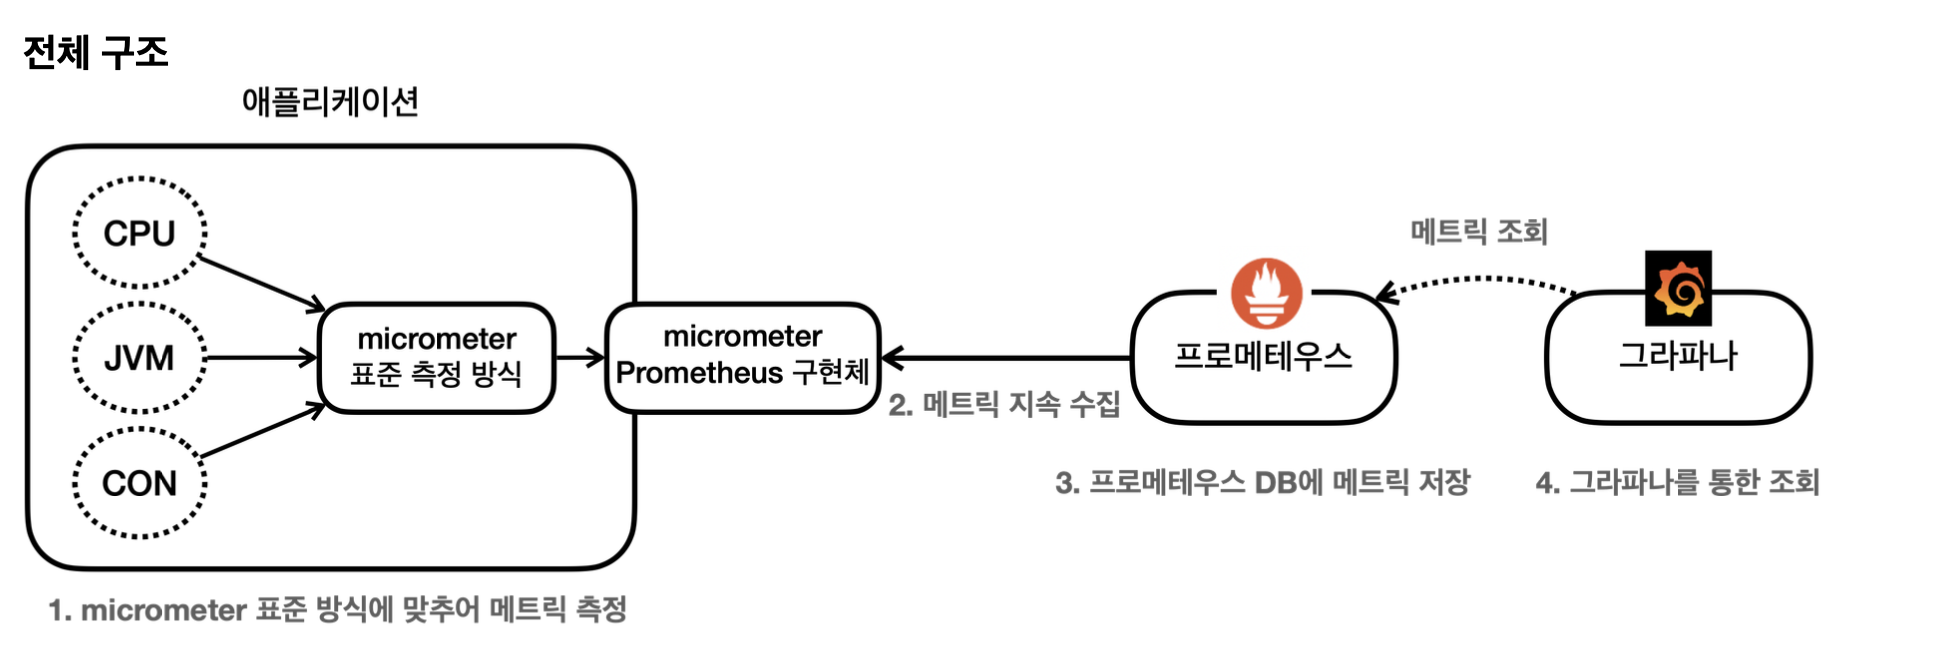
애플리케이션에서 발생한 메트릭을 그 순간만 확인하는 것이 아니라 과거 이력까지 함께 확인하려면 메트릭을 보관하는 DB가 필요하다. 이렇게 하려면 어디선가 메트릭을 지속해서 수집하고 DB에 저장해야한다. 이 역할을 프로메테우스(Prometheus)가 수행 한다.
설치
https://github.com/prometheus/prometheus/releases/download/v2.42.0/
프로메테우스 - 애플리케이션 설정
1) 애플리케이션 설정
프로메테우스가 애플리케이션의 메트릭을 가져가려면 프로메테우스가 사용하는 포켓에 맞추어 메트릭을 만들어야 한다. 참고로 프로메테우스는 포멧(JSON)을 이해하지 못한다. 하지만 마이크로미터가 이를 해결해준다.
build.gradle
implementation 'io.micrometer:micrometer-registry-prometheus'- 액추에이터에 프로메테우스 메트릭 수집 엔드포인트가 자동으로 추가된다.
/actuator/prometheus-> 자동으로 추가
http://localhost:8080/actuator/prometheus
2) 수집 설정
- 프로메테우스 폴더에 있는
prometheus.yml파일 수정, #추가 부분만 작성하면 된다. 나머지는 존재할 것이다.
prometheus.yml
global:
  scrape_interval: 15s
  evaluation_interval: 15s

alerting:
  alertmanagers:
    - static_configs:
        - targets:
          # - alertmanager:9093

rule_files:

scrape_configs:
  - job_name: "prometheus"
    static_configs:
      - targets: ["localhost:9090"]
  # 추가
  - job_name: "spring-actuator"
    metrics_path: '/actuator/prometheus'
    scrape_interval: 1s
    static_configs:
- targets: ['localhost:8080']- 이렇게 설정하면 프로메테우스는
http://localhost:8080/actuator/prometheus를 1초씩 호출하여 애플리케이션의 메트릭을 수집한다. - 너무 수집 주기가 빠른 것같으면 조정하면 된다.
3) 확인
3-1) http://localhost:9090 를 통해 프로메테우스 작동 확인
3-2) prometheus.yml 확인
Status->Configuration
3-3) 연동 확인
-
Status->Targets
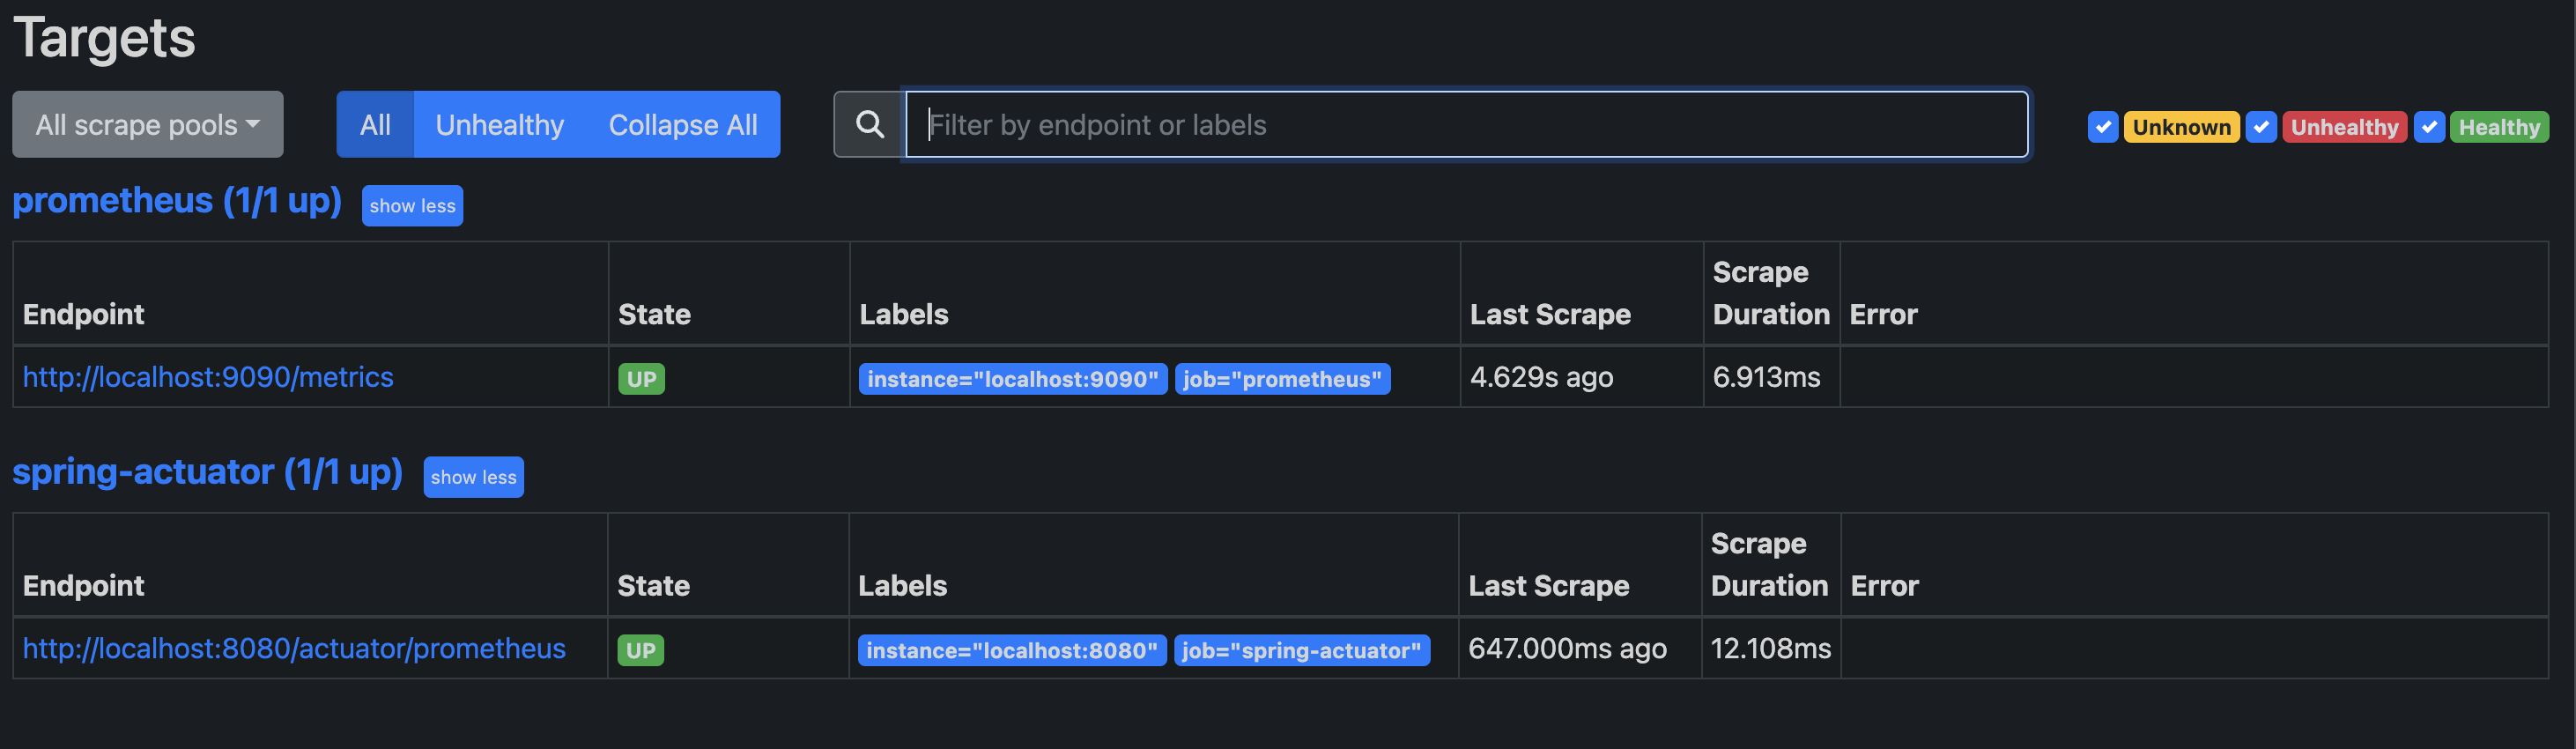
-
State가
UP으로 되어 있으면 정상이고,DOWN으로 되어 있으면 연동 성공 -
prometheus: 프로메테우스 자체에서 제공하는 메트릭 정보 -
spring-actuator: 우리가 연동한 애플리케이션의 메트릭 정보❗️ 반드시 서버가 돌아가야지 연동이 된다.
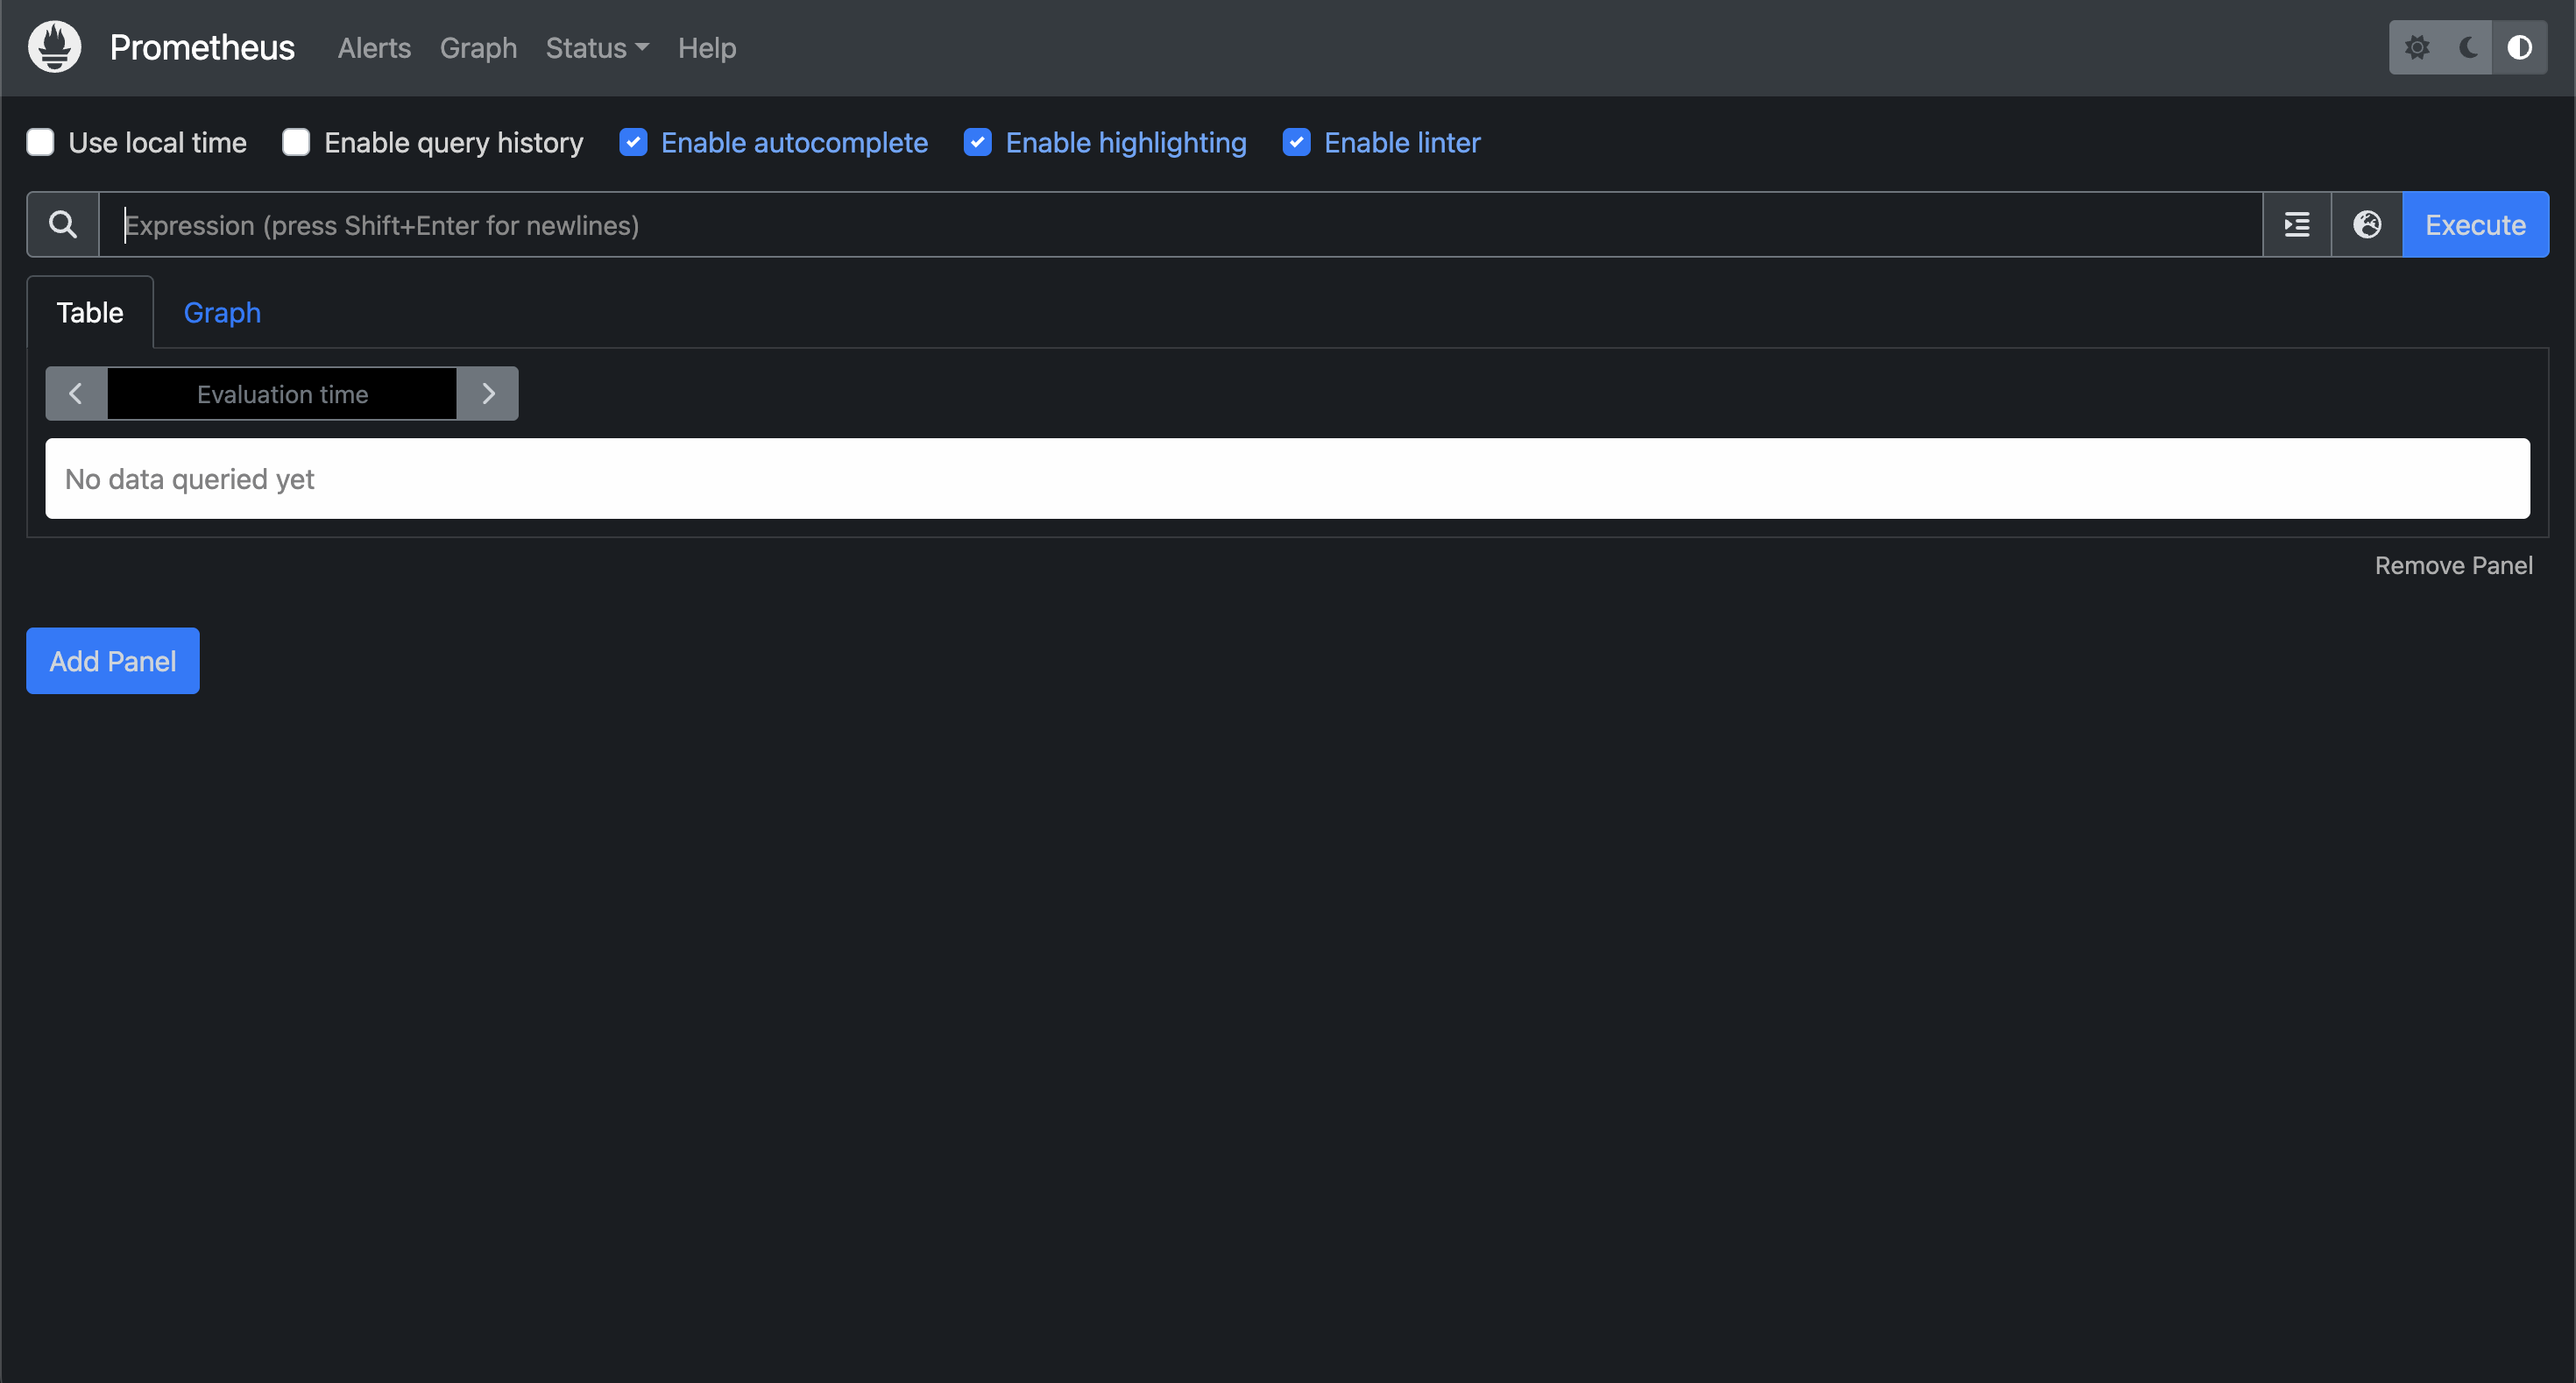
3-4) 간단한 메트릭 조회
jvm_info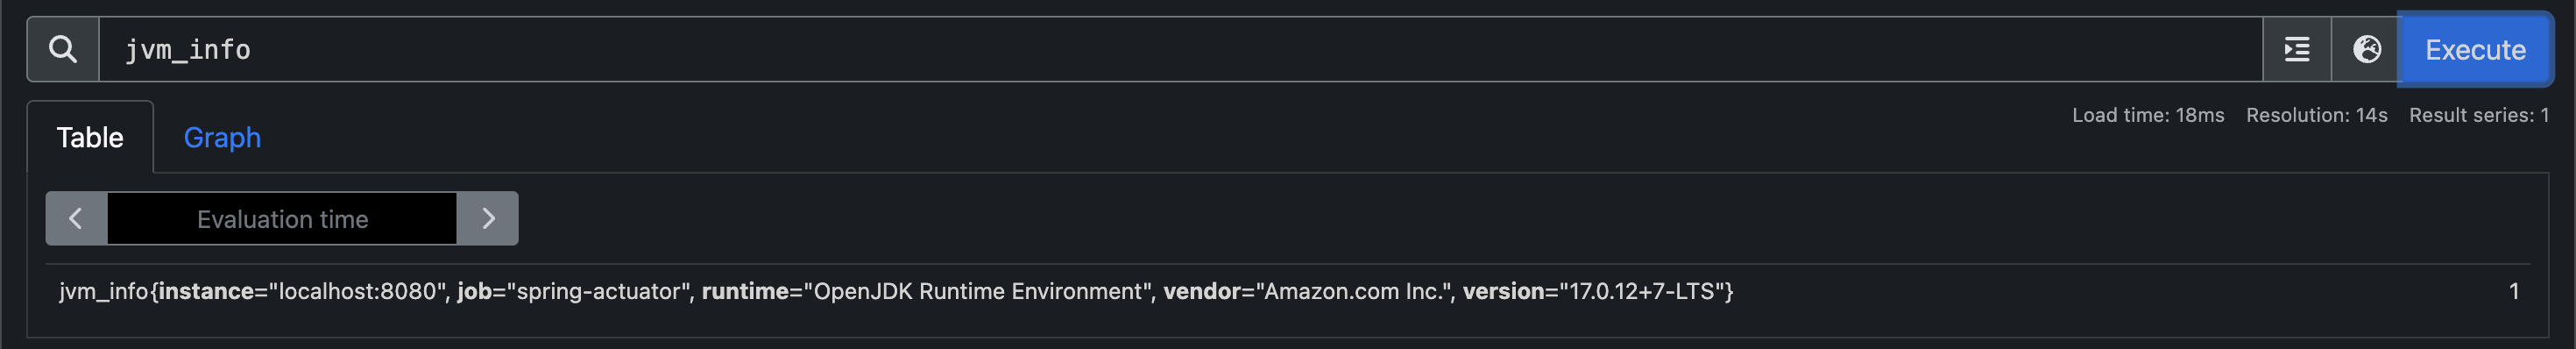
프로메테우스 - 기본 기능
http_server_requests_seconds_count
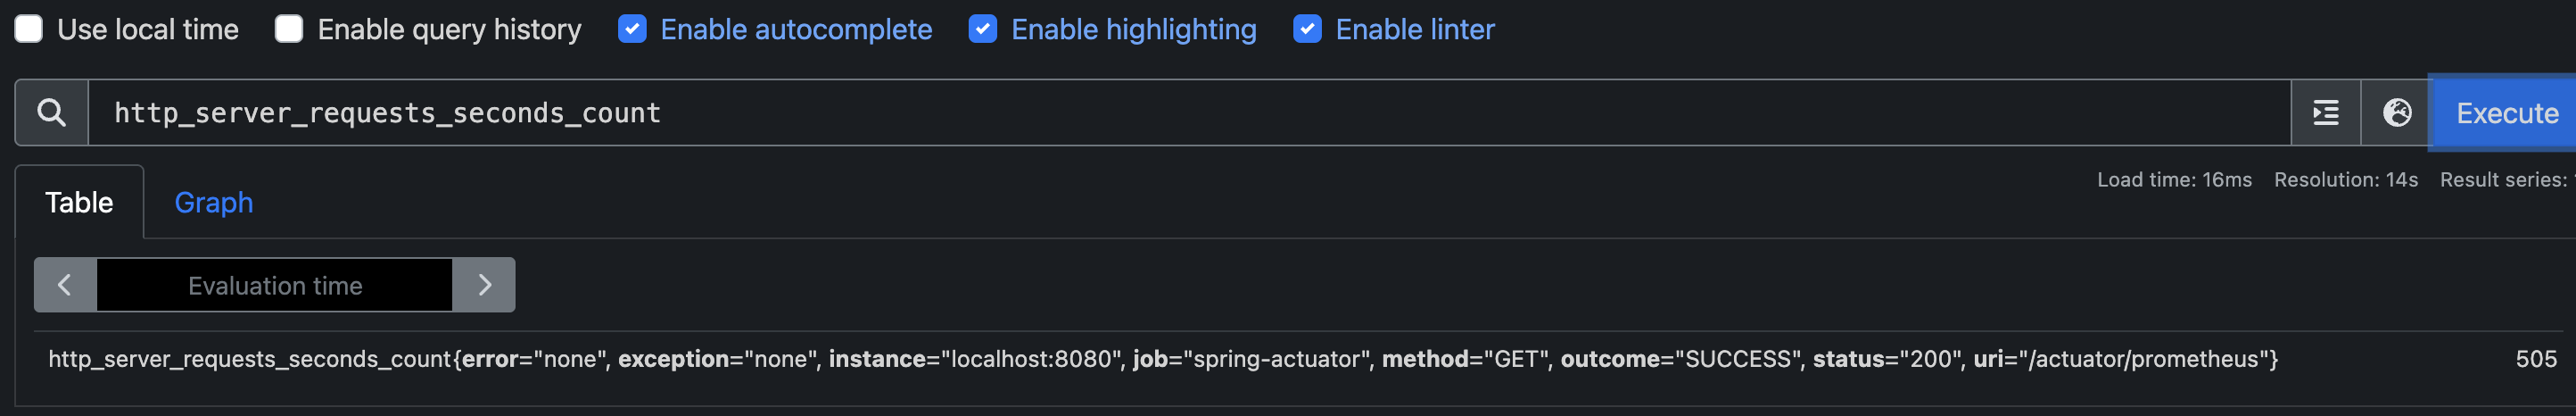
-
끝에 숫자는 해당 메트릭 값,
uri="/actuator/prometheus"는 1초마다 자동으로 호출해서 숫자가 큰 것을 확인 가능하다. -
Table->Evaluation time을 수정해서 과거 시간 조회 가능 -
Graph: 메트릭을 그래프로 조회 가능
필터
- 레이블을 기준으로 필터를 사용할 수 있다.
=: 제공된 문자열과 정확히 동일한 레이블 선택
!=: 제공된 문자열과 같지 않은 레이블 선택
=~: 제공된 문자열과 정규식 일치하는 레이블 선택
!~: 제공된 문자열과 정규식 일치하지 않는 레이블 선택 - 예시)
uri=/log,method=GET조건으로 필터http_server_requests_seconds_count{uri="/log", method="GET"}
프로메테우스 - 게이지와 카운터
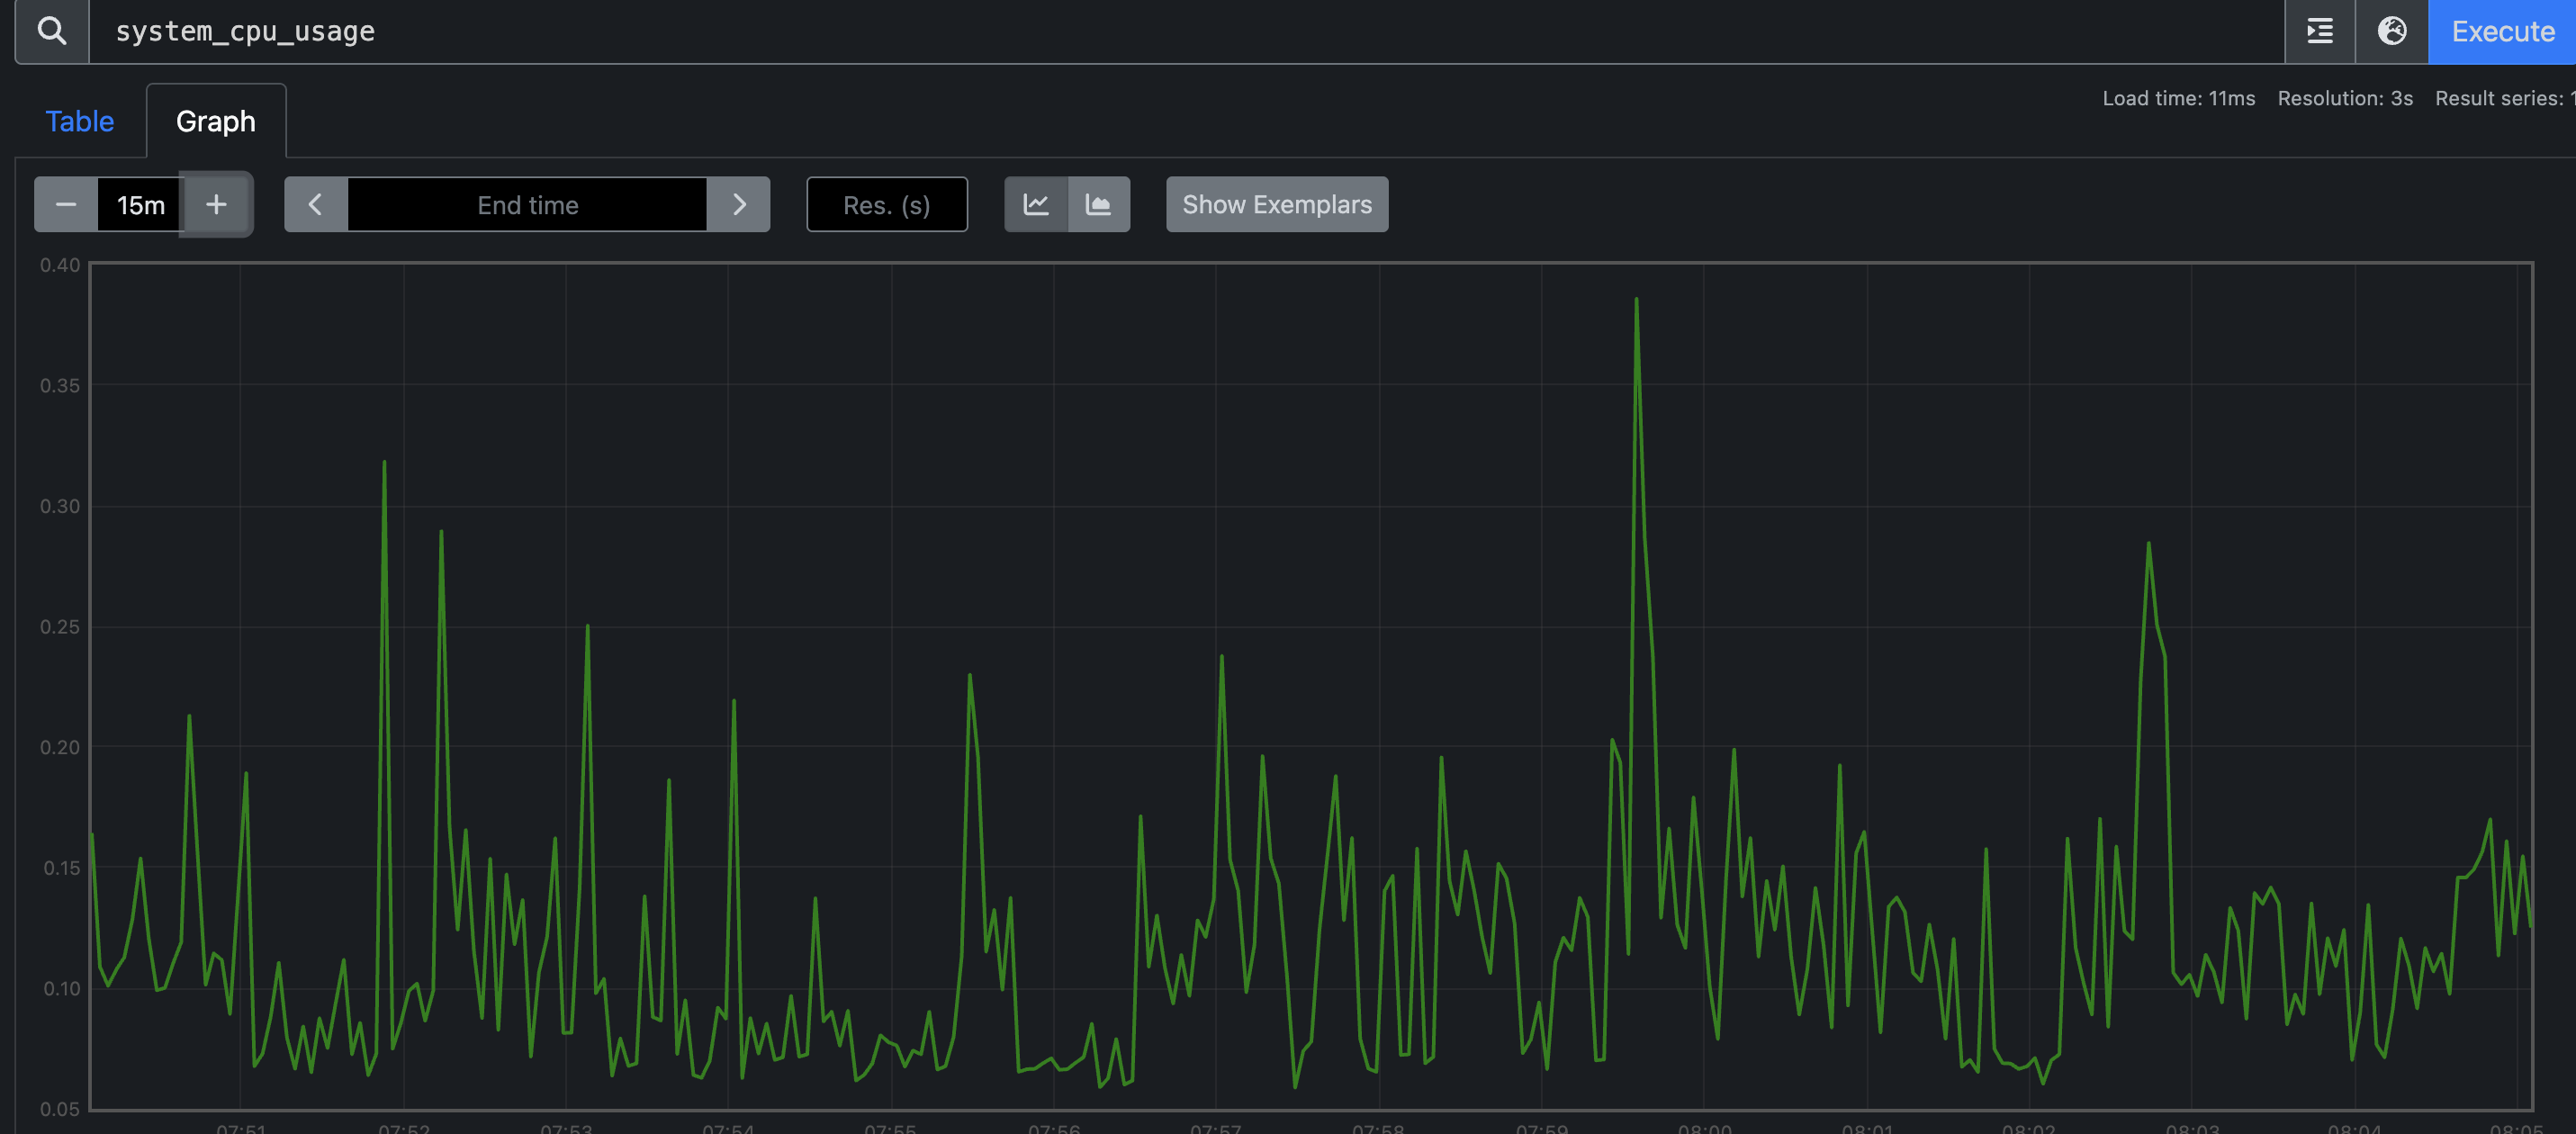
1) 게이지(Gauge)
- 임의로 오르내릴 수 있는 값
에시) CPU 사용량, 메모리 사용량, 사용중인 커넥션
system_cpu_usage
2) 카운터(Counter)
- 단순하게 증가하는 단일 누적 값
예시) HTTP 요청 수, 로그 발생 수
http_server_requests_seconds_count{uri="/log"}
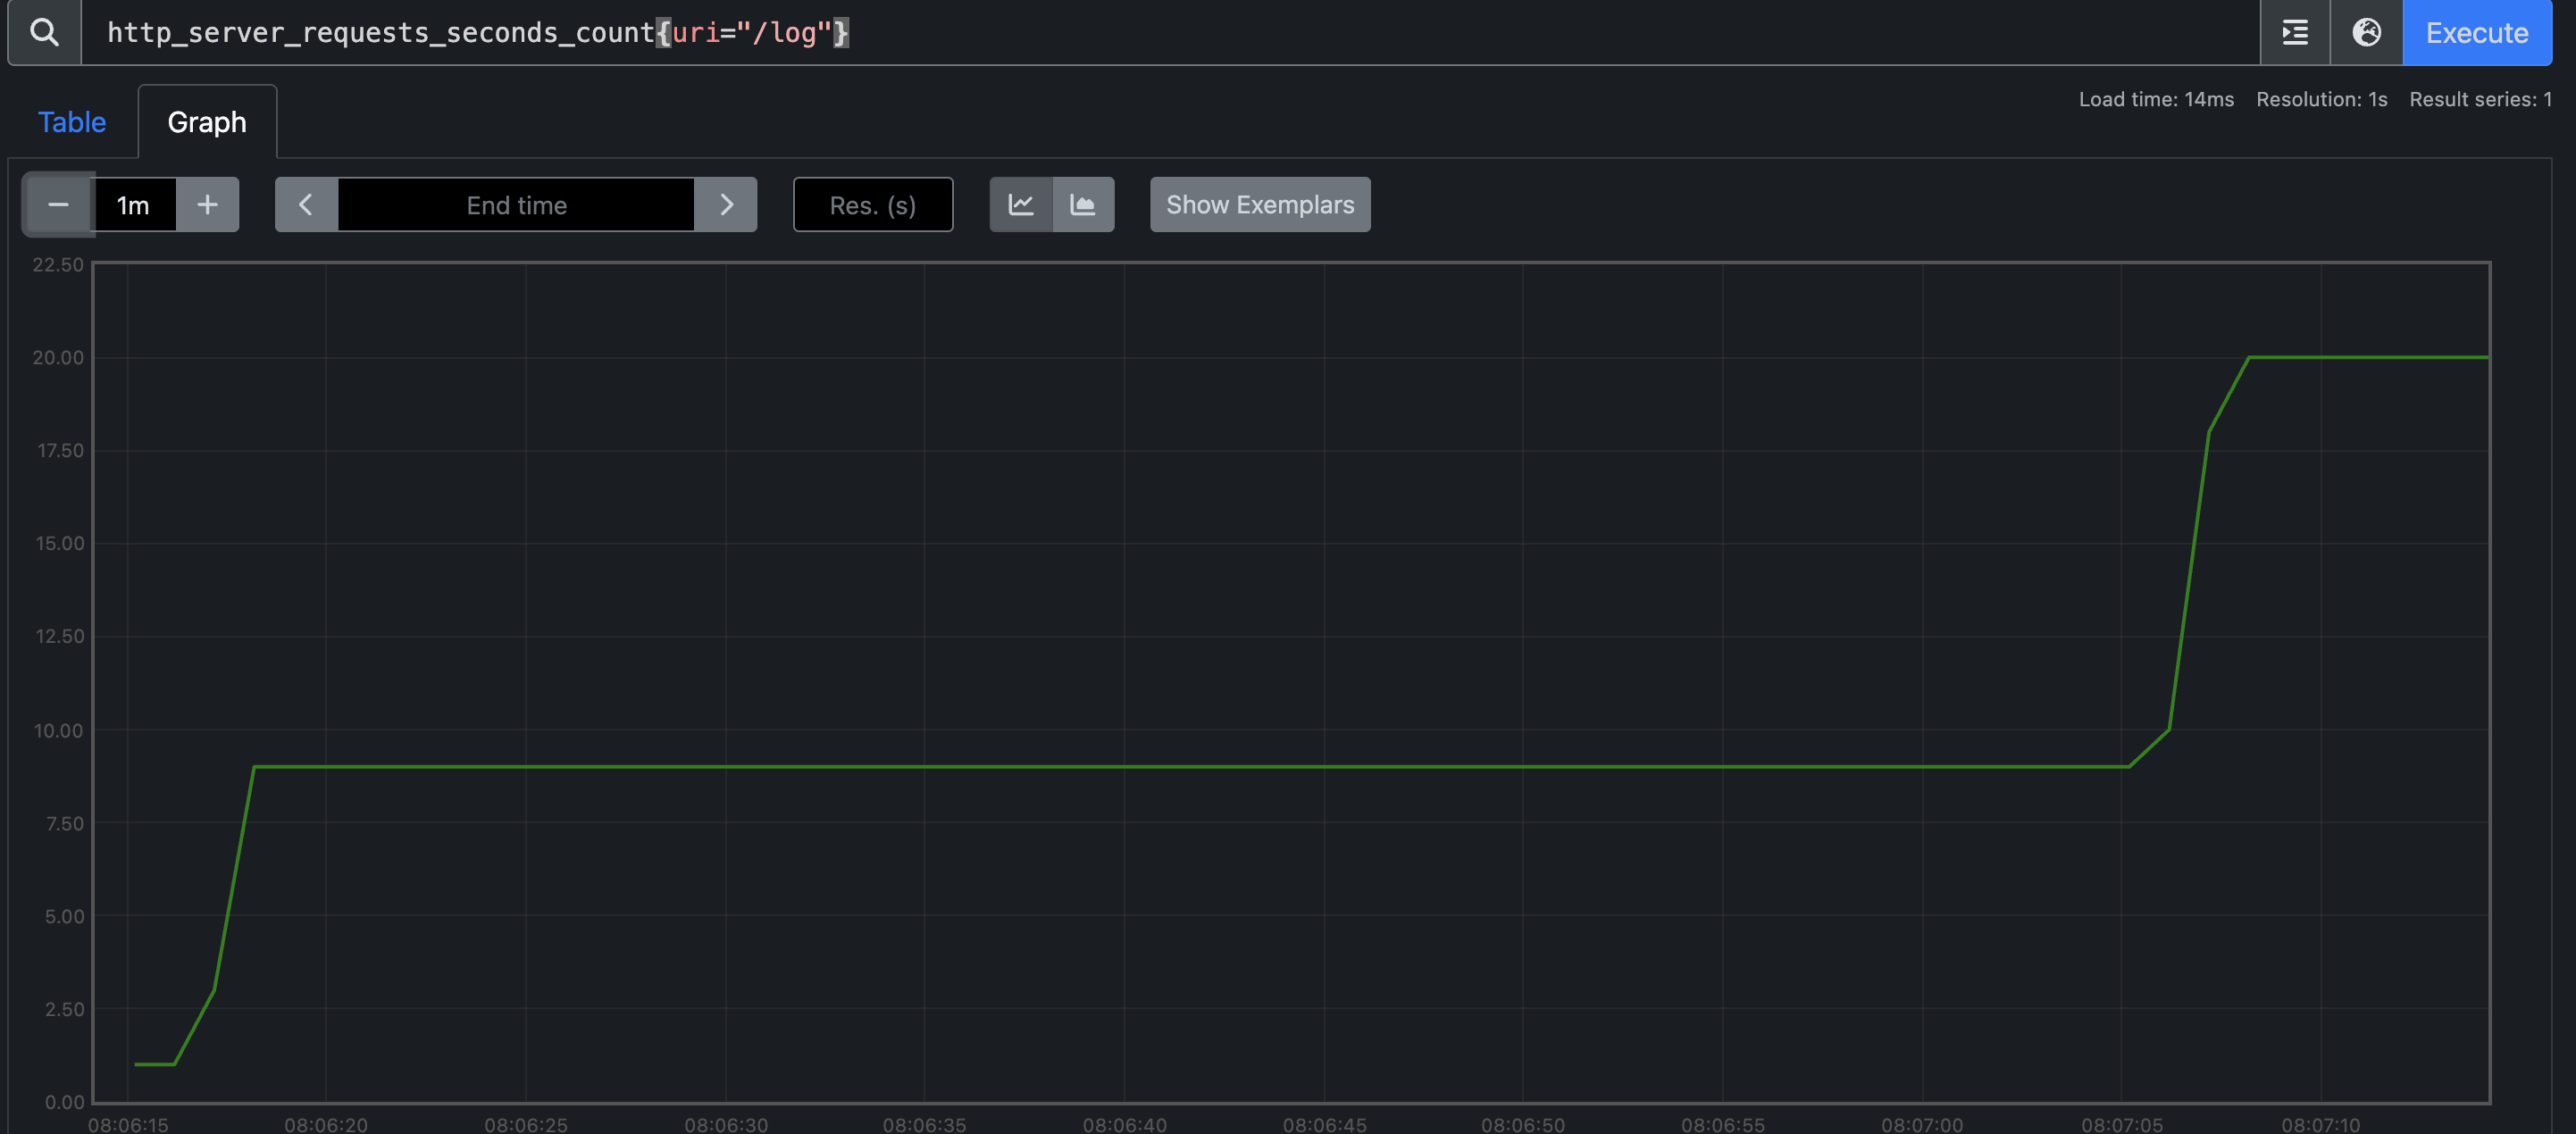
🤔 증가만 하는 그래프에서는 특정 시간에 얼마나 고객의 요청이 들어왔는지 한눈에 확인하기 매우 어렵다. 이런 문제를 해결하기 위해
increase(),rate()같은 함수를 지원를 지원한다.
increase(http_server_requests_seconds_count{uri="/log"}[1m])
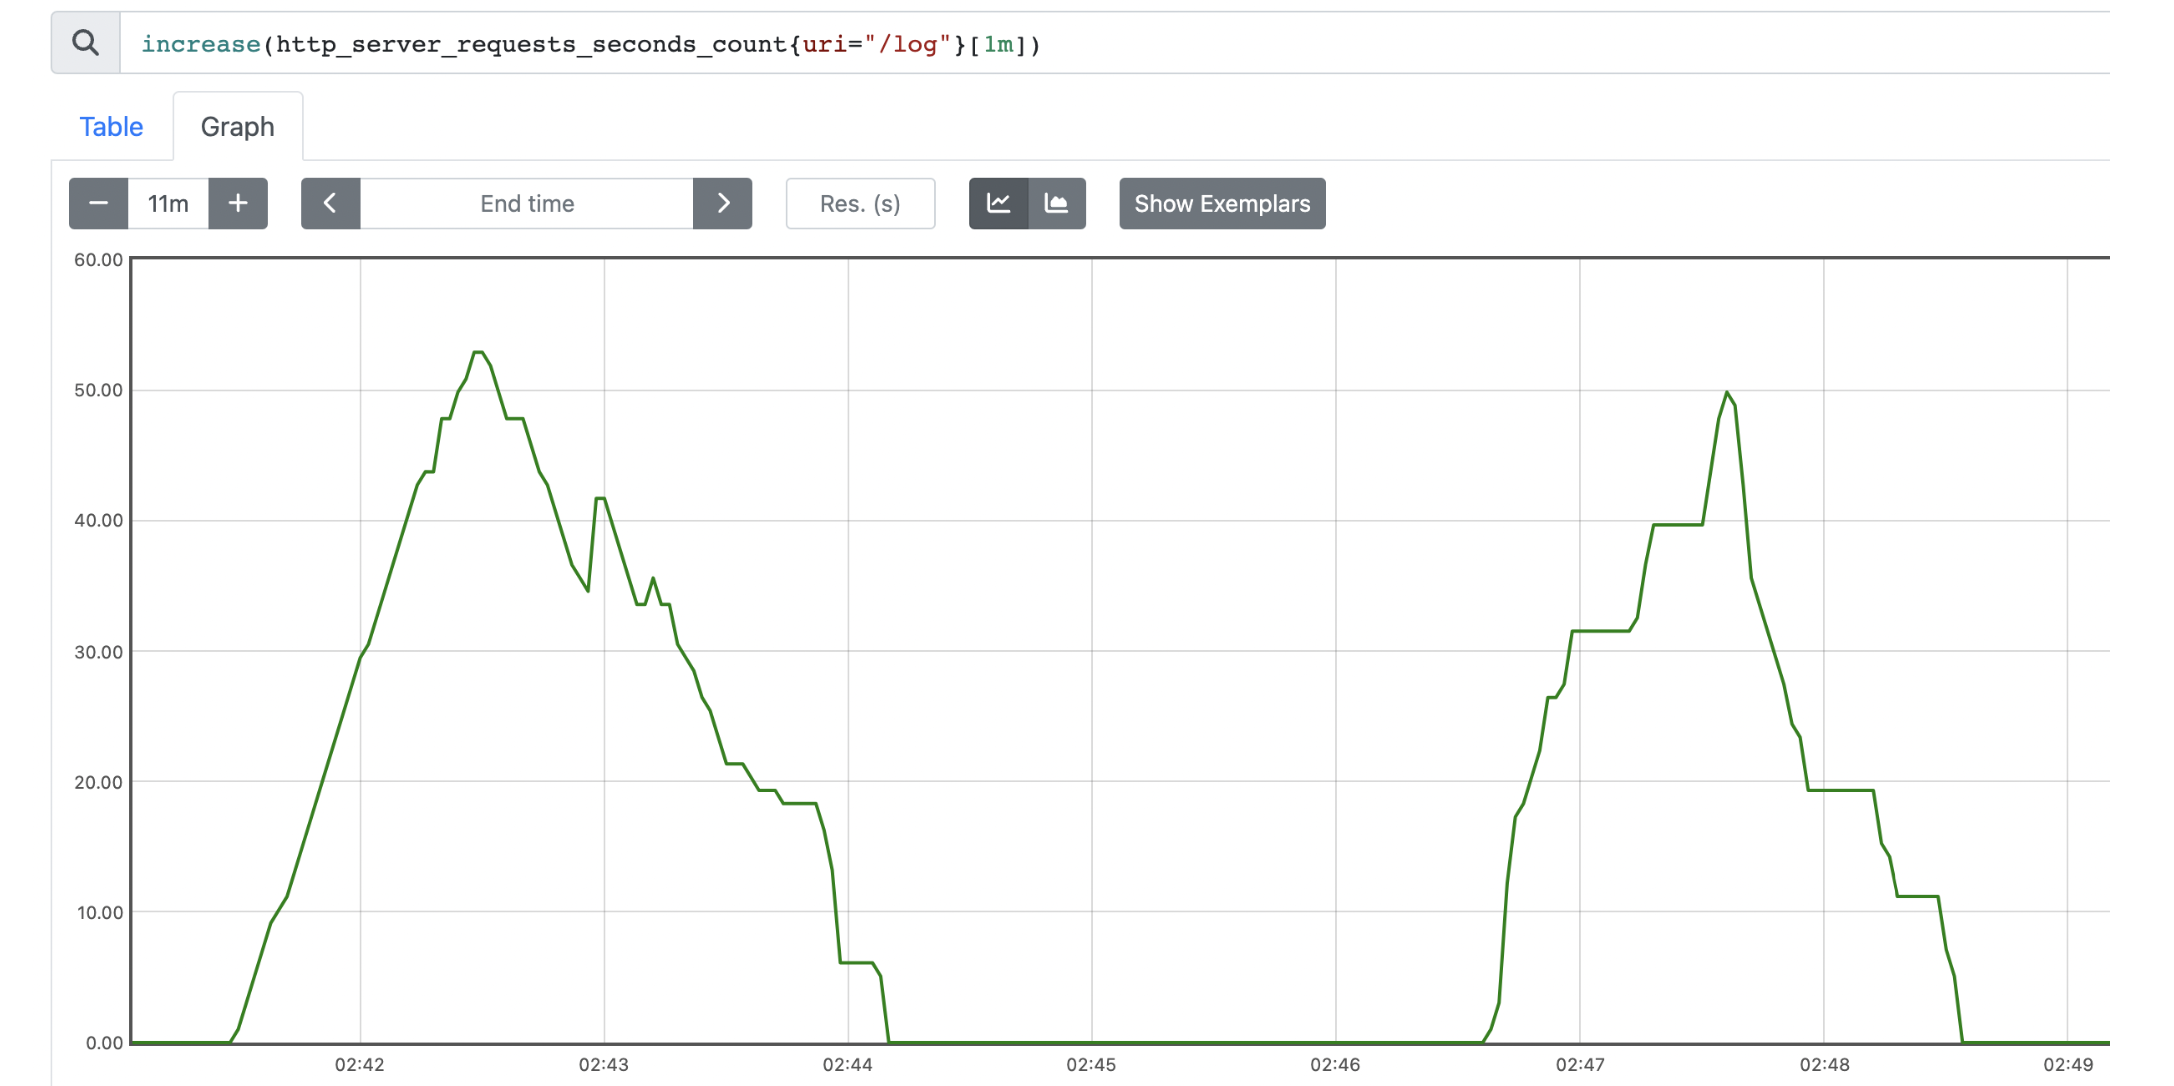
- 02:42 ~ 02:43: 80건 요청
- 02:43 ~ 02:46: 0건 요청
- 02:46 ~ 02:48: 약 50건 요청
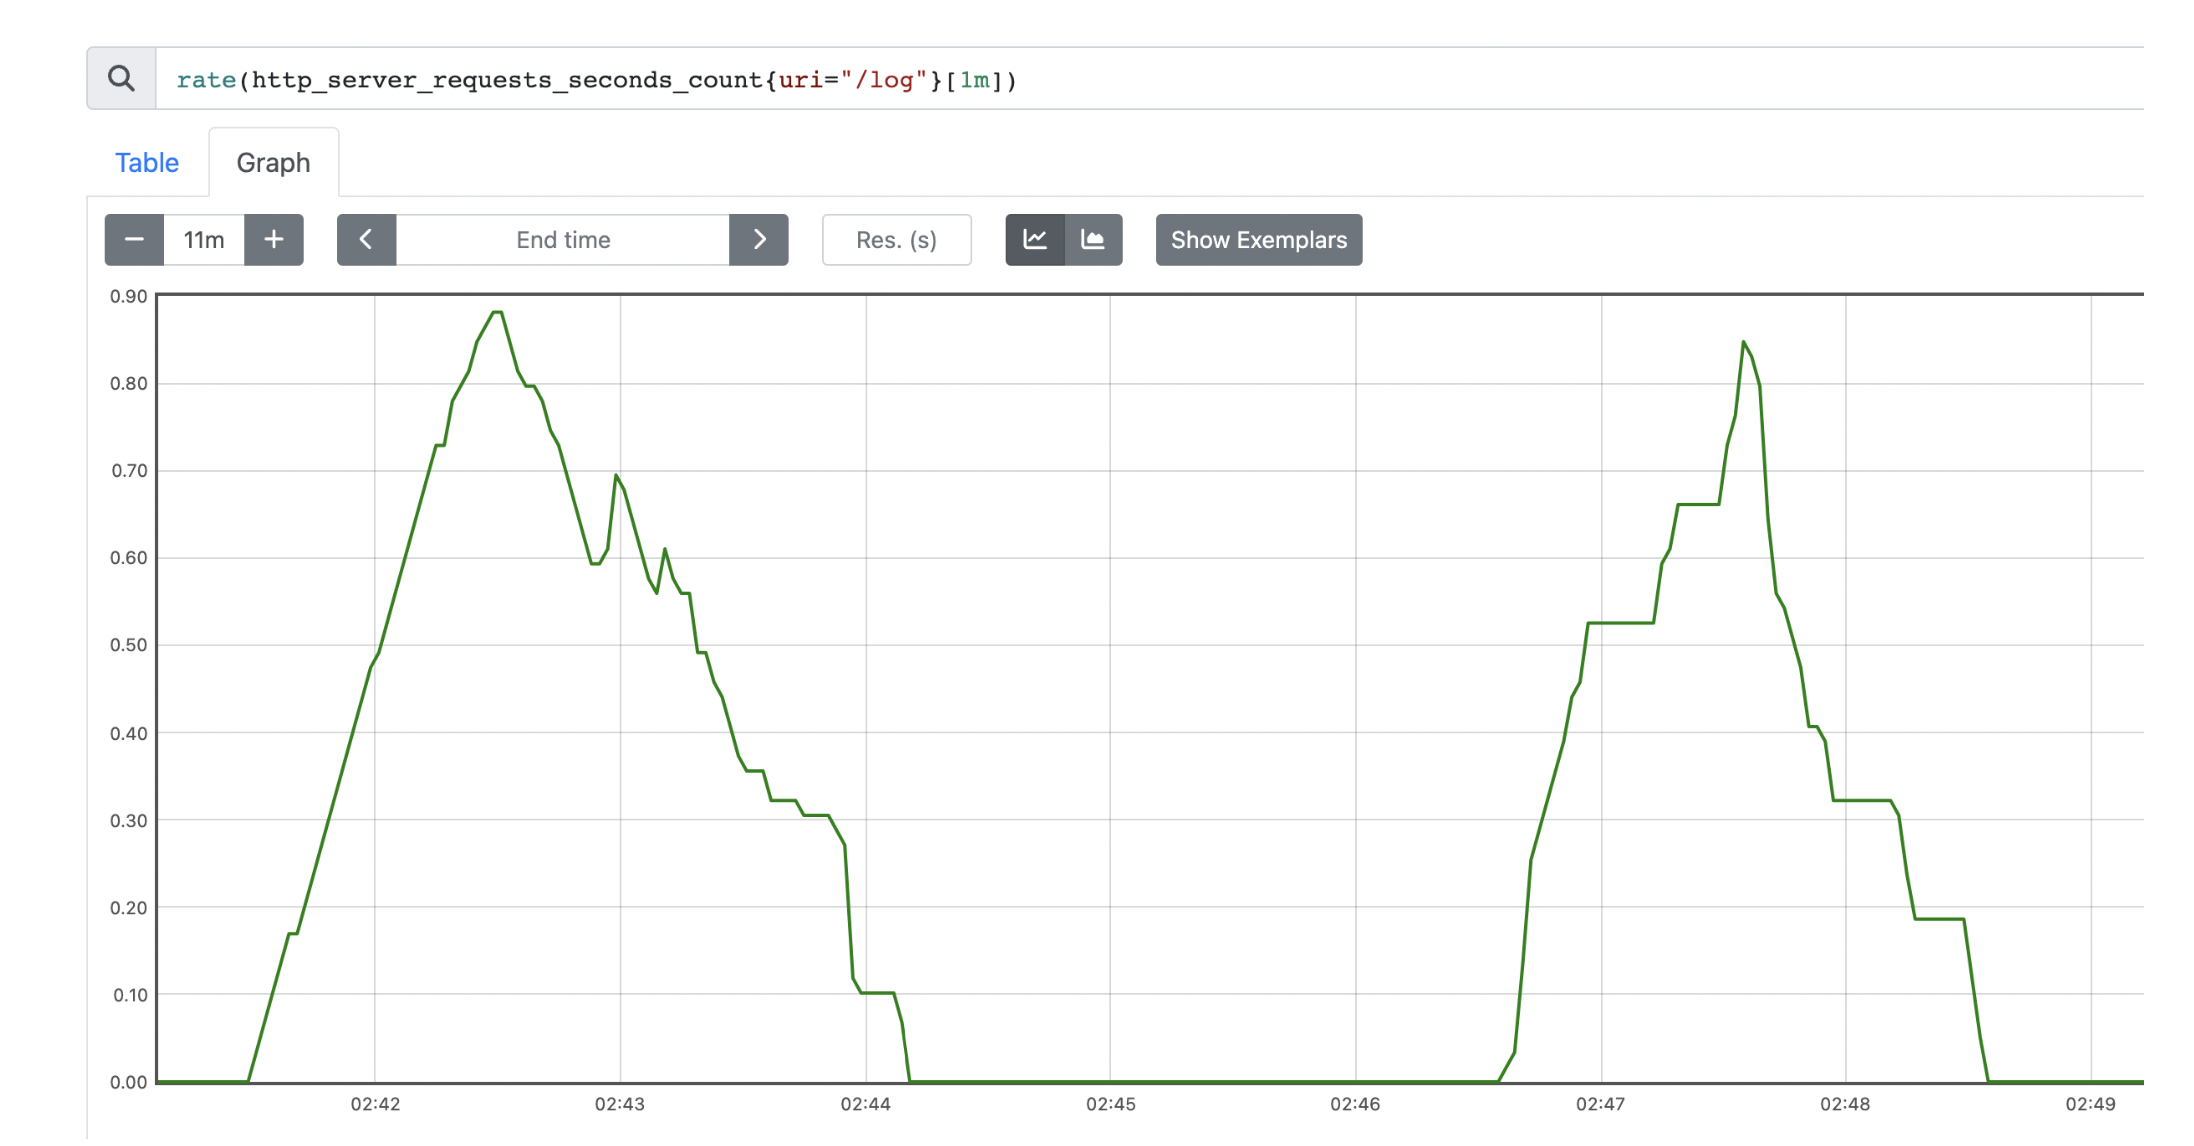
rate(http_server_requests_seconds_count{uri="/log"}[1m])
너무 복잡하게 생각하기 보다는 초당 얼마나 증가하는지 나타내는 지표로 보면 된다.
📌 그라파나(Grafana)
https://grafana.com/grafana/download
그라파나를 설치한 후http://localhost:3000으로 확인해보자
로그인 화면이 나오면
email or username : admin
Password : admin
으로 하고 그 다음에는 SKIP을 하자
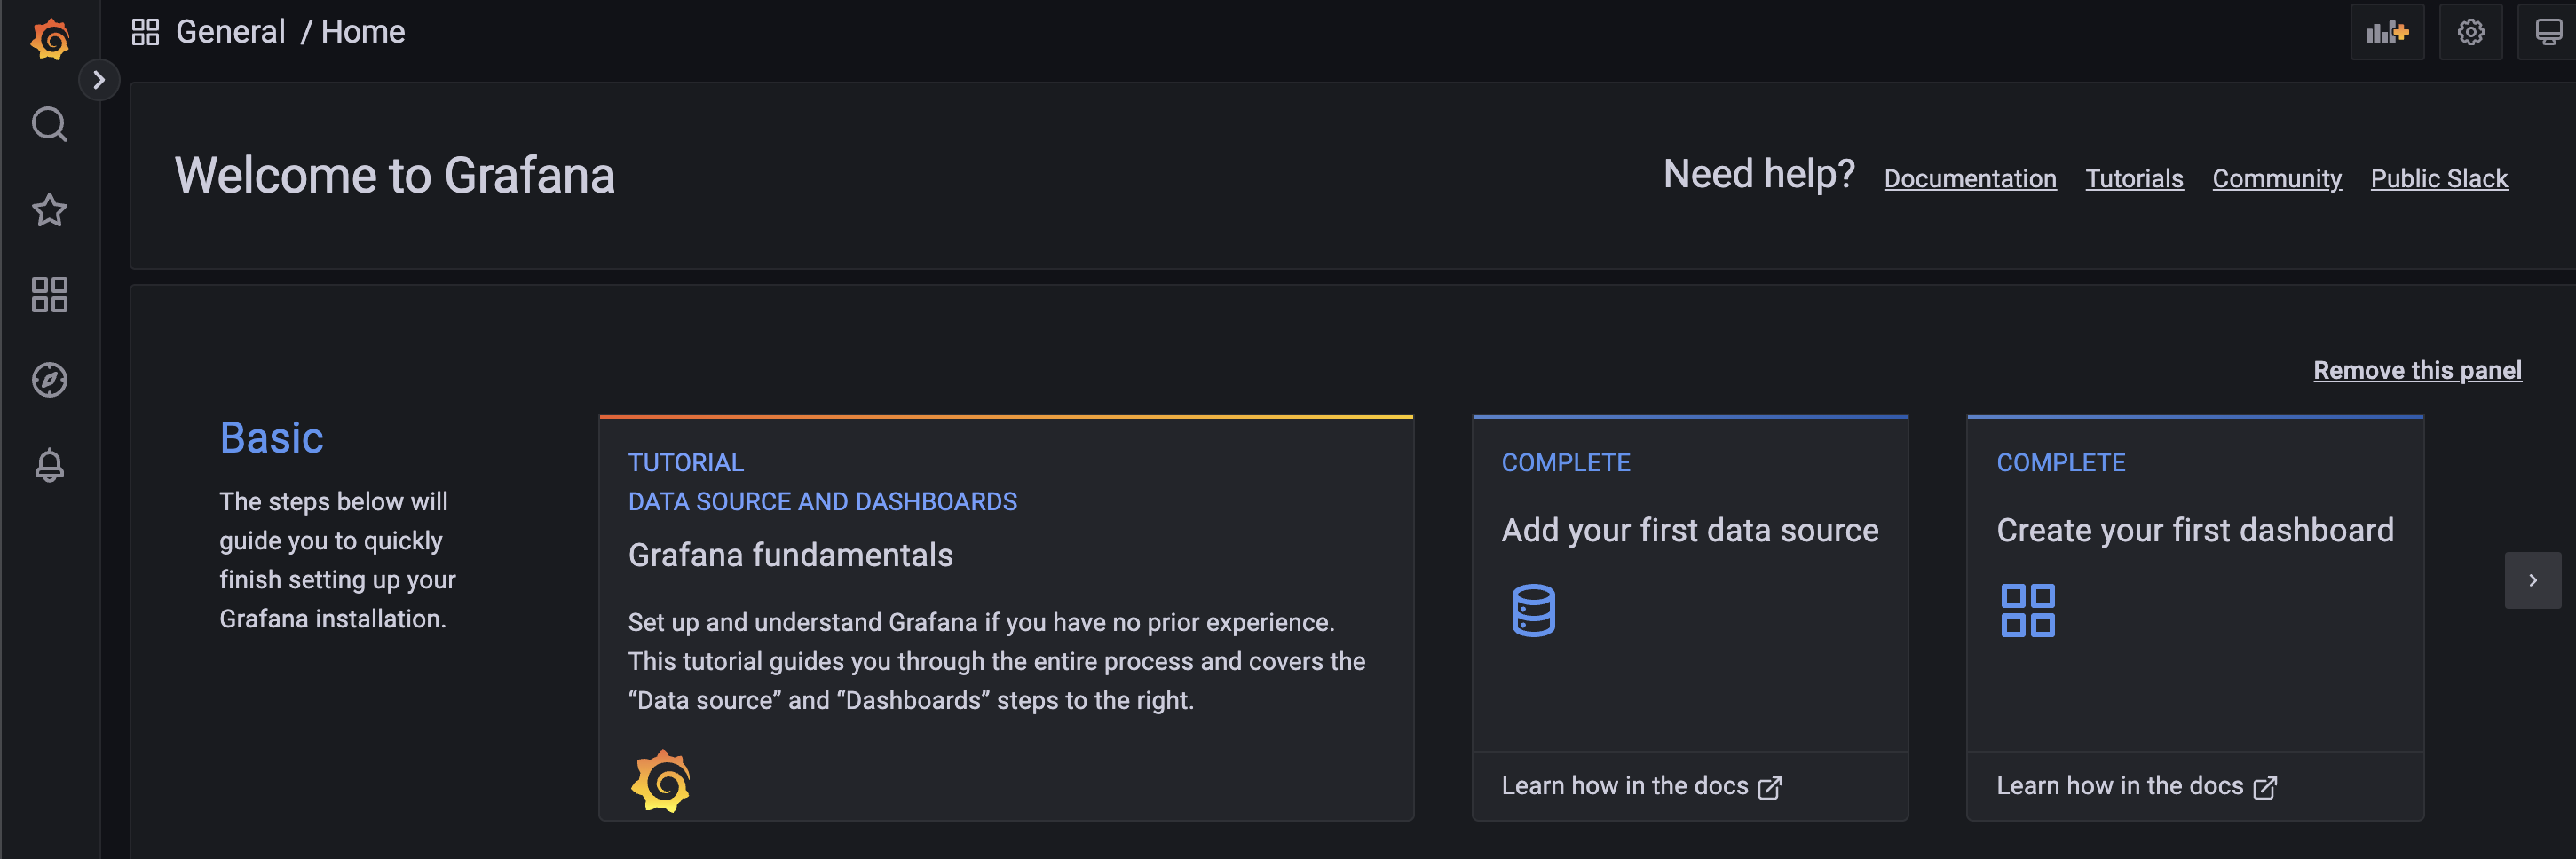
이런 화면이 나와야한다.
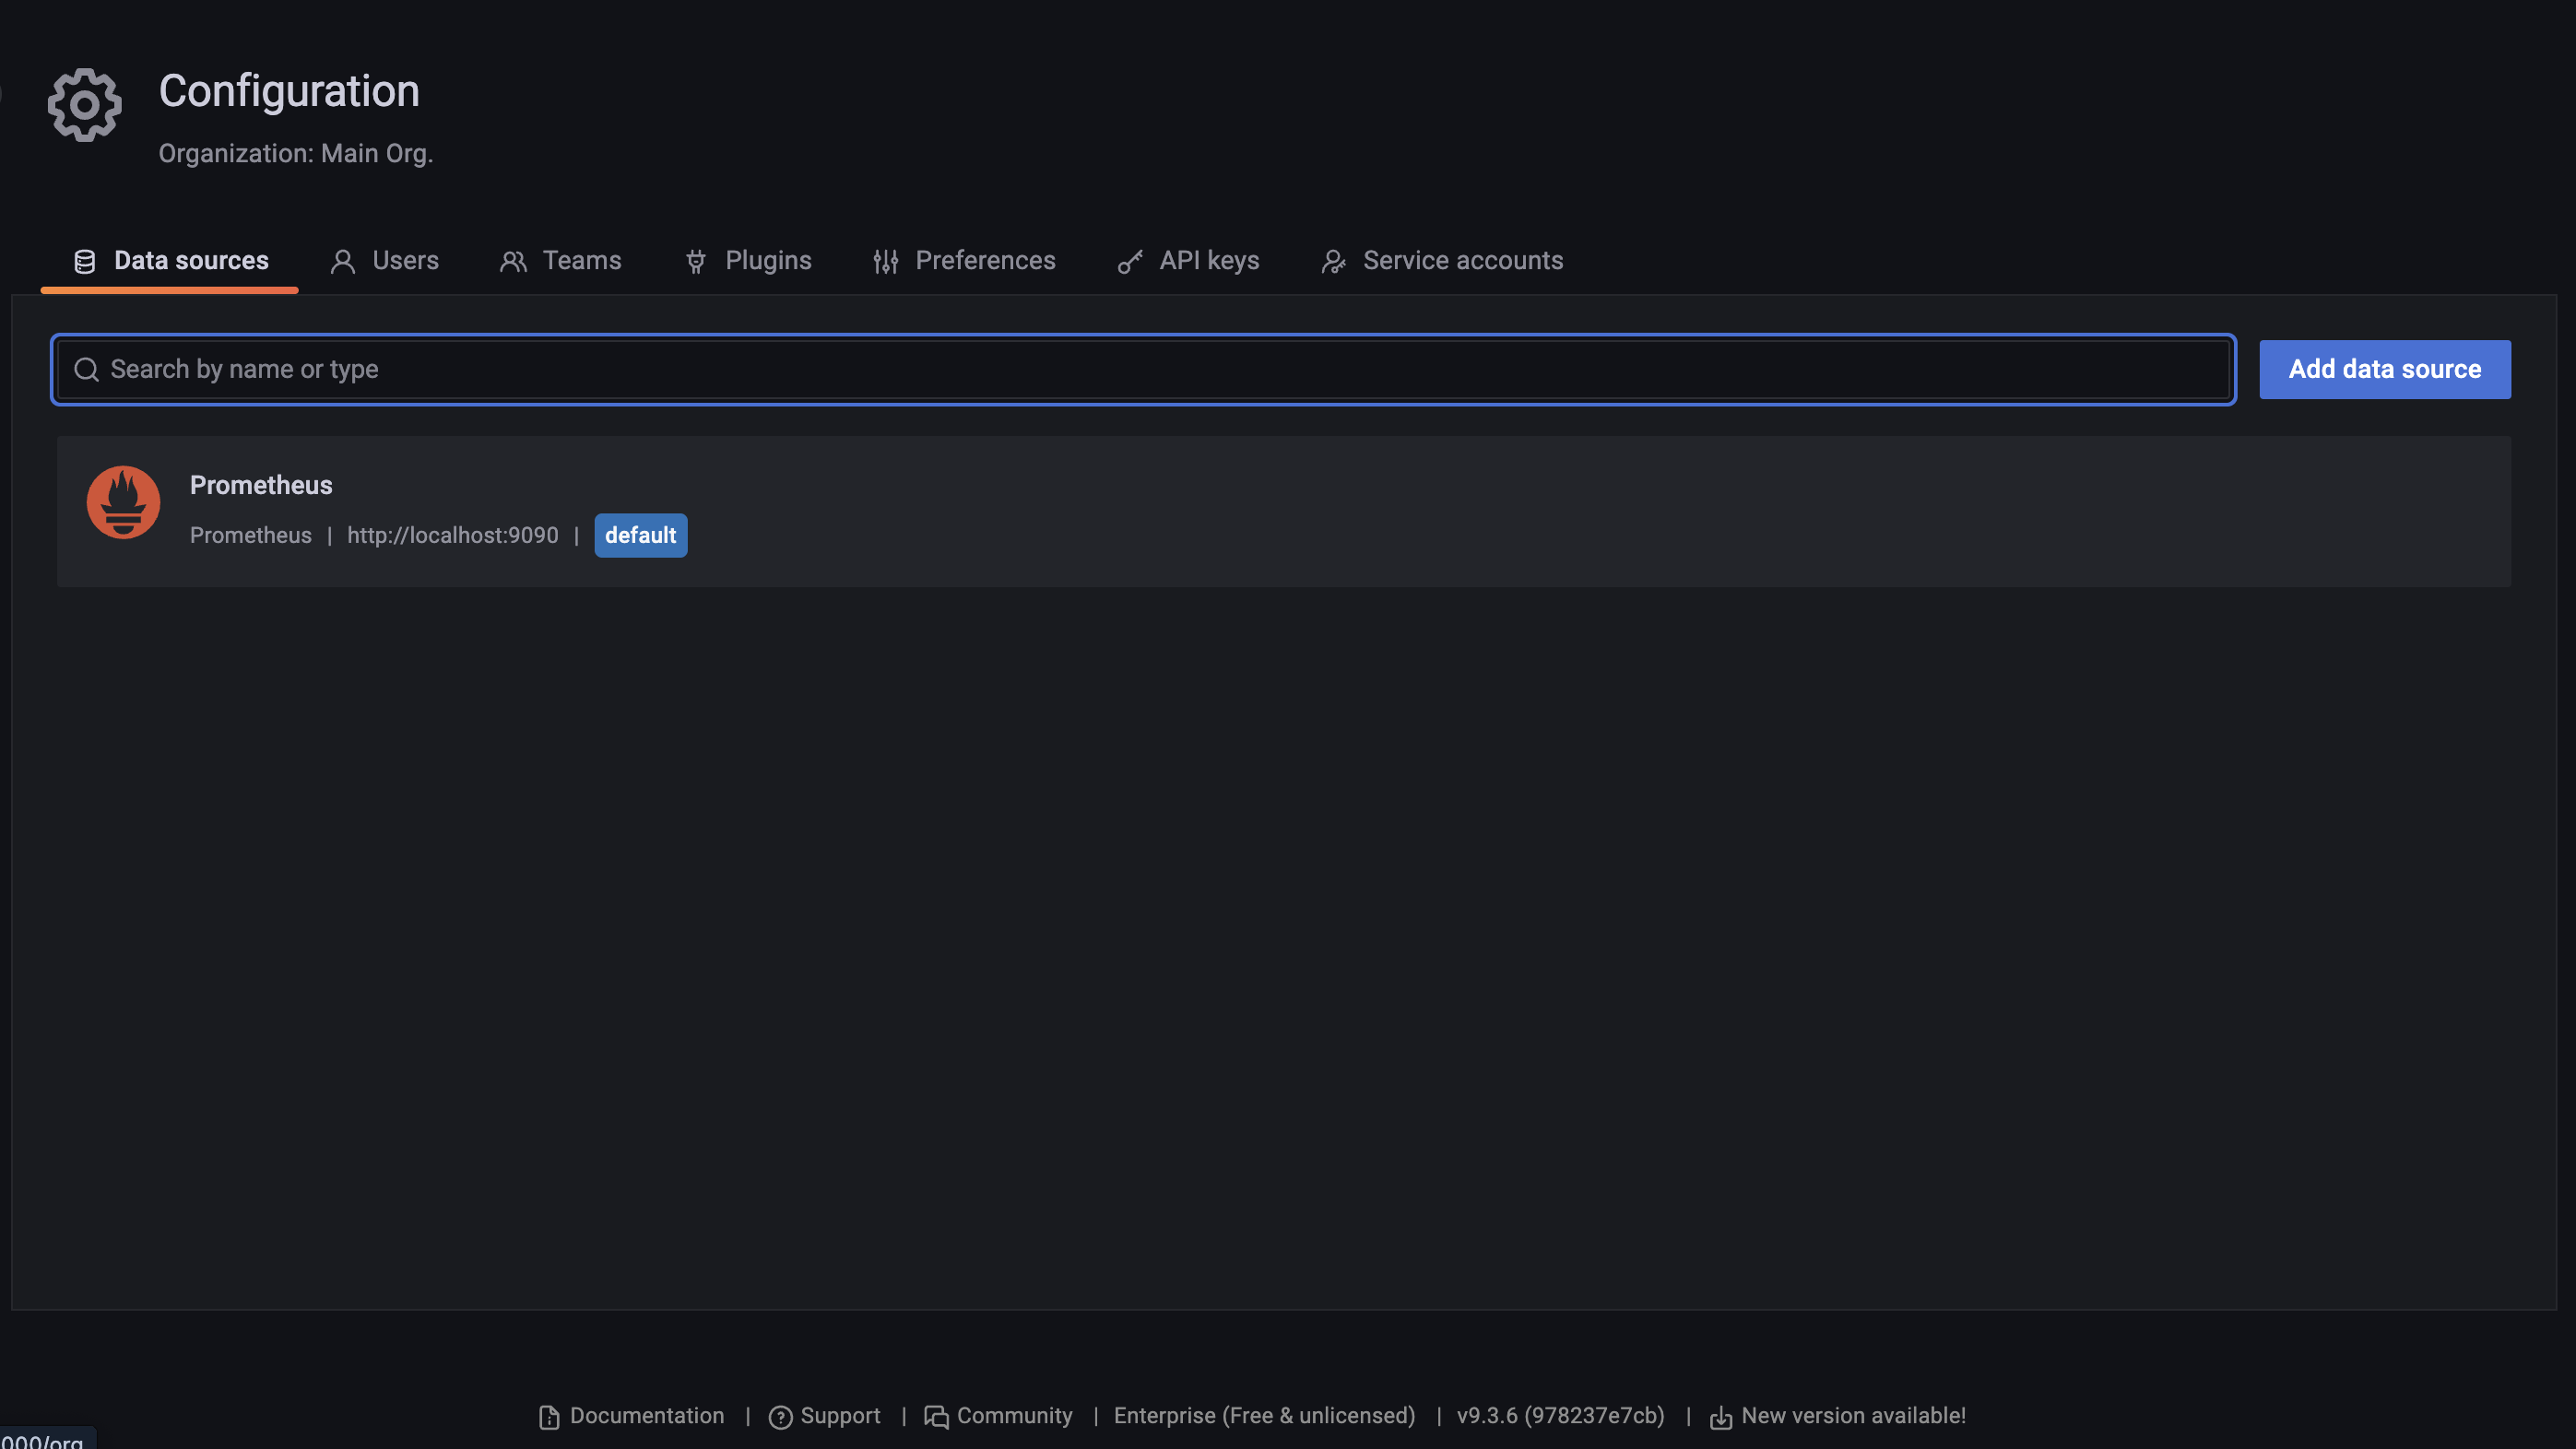
데이터소스 추가
- 왼쪽 하단에 있는 설정(Configuration) 버튼에서 Data sources를 선택한다.
Add data source를 선택한다.Prometheus를 선택한다.
❗️ 반드시 프로메테우스, 그라파나, 애플리케이션 3개가 다 켜져있어야한다.
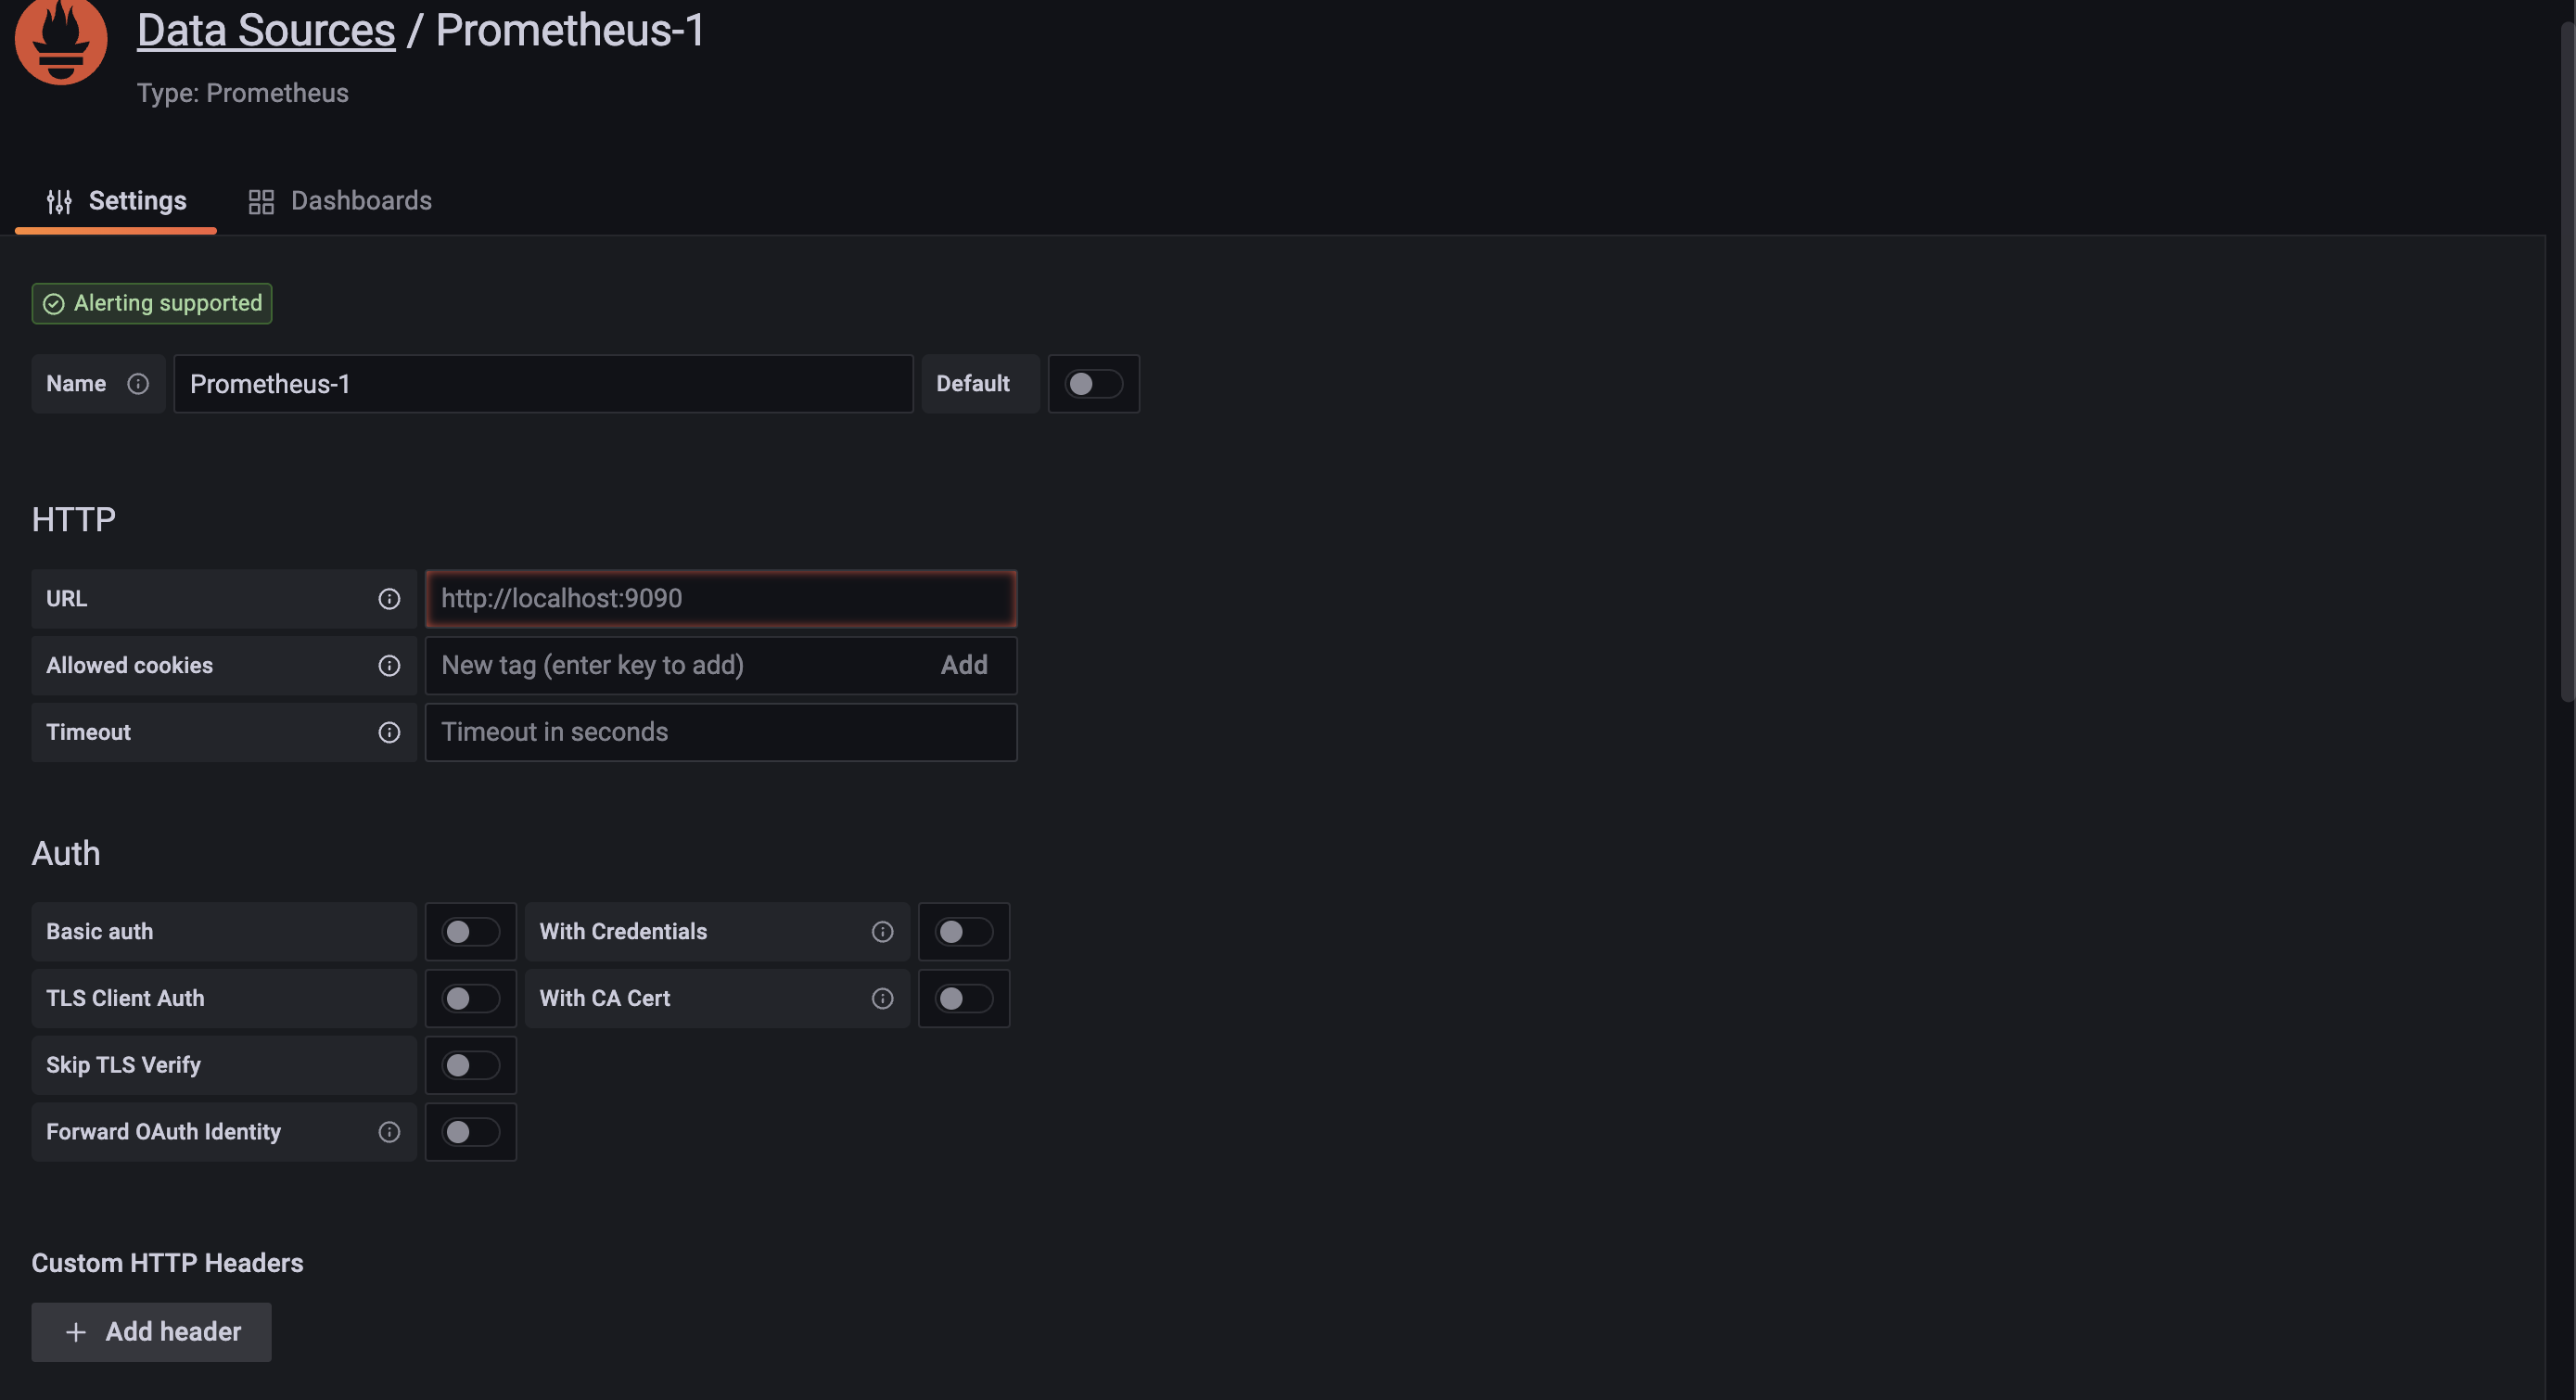
Prometheus 데이터 소스 설정
- URL: http://localhost:9090
- 나머지는 특별히 고칠 부분이 없다면 그대로 두고
Save & test를 선택
그라파나 - 대시보드 만들기
대시보드 저장
- 왼쪽 Dashboards 메뉴 선택
New버튼 선택New Dashboard선택- 오른쪽 상단의
Save dashboard저장 버튼(disk 모양) 선택 - Dashboard name: hello dashboard를 입력하고 저장
대시보드 확인
- 왼쪽 Dashboards 메뉴 선택
- 앞서 만든 hello dashboard 선택
패널 만들기
대시보드에 패널 만들기
-
오른쪽 상단의
Add panel버튼(차트 모양) 선택

-
Add a new panel메뉴 선택 -
패널의 정보를 입력할 수 있는 화면이 나타난다.
-
아래에 보면
Run queries버튼 오른쪽에Builder,Code라는 버튼이 보이는데,Code를 선택 -
Enter a PromQL query... 이라는 부분에 메트릭을 입력하면 된다.
CPU 메트릭 만들기
system_cpu_usage: 시스템의 CPU 사용량process_cpu_usage: JVM 프로세스 CPU 사용량
PromQL 에 system_cpu_usage 를 입력하고 Run queries 클릭
+ Query 버튼를 통해 process_cpu_usage 추가
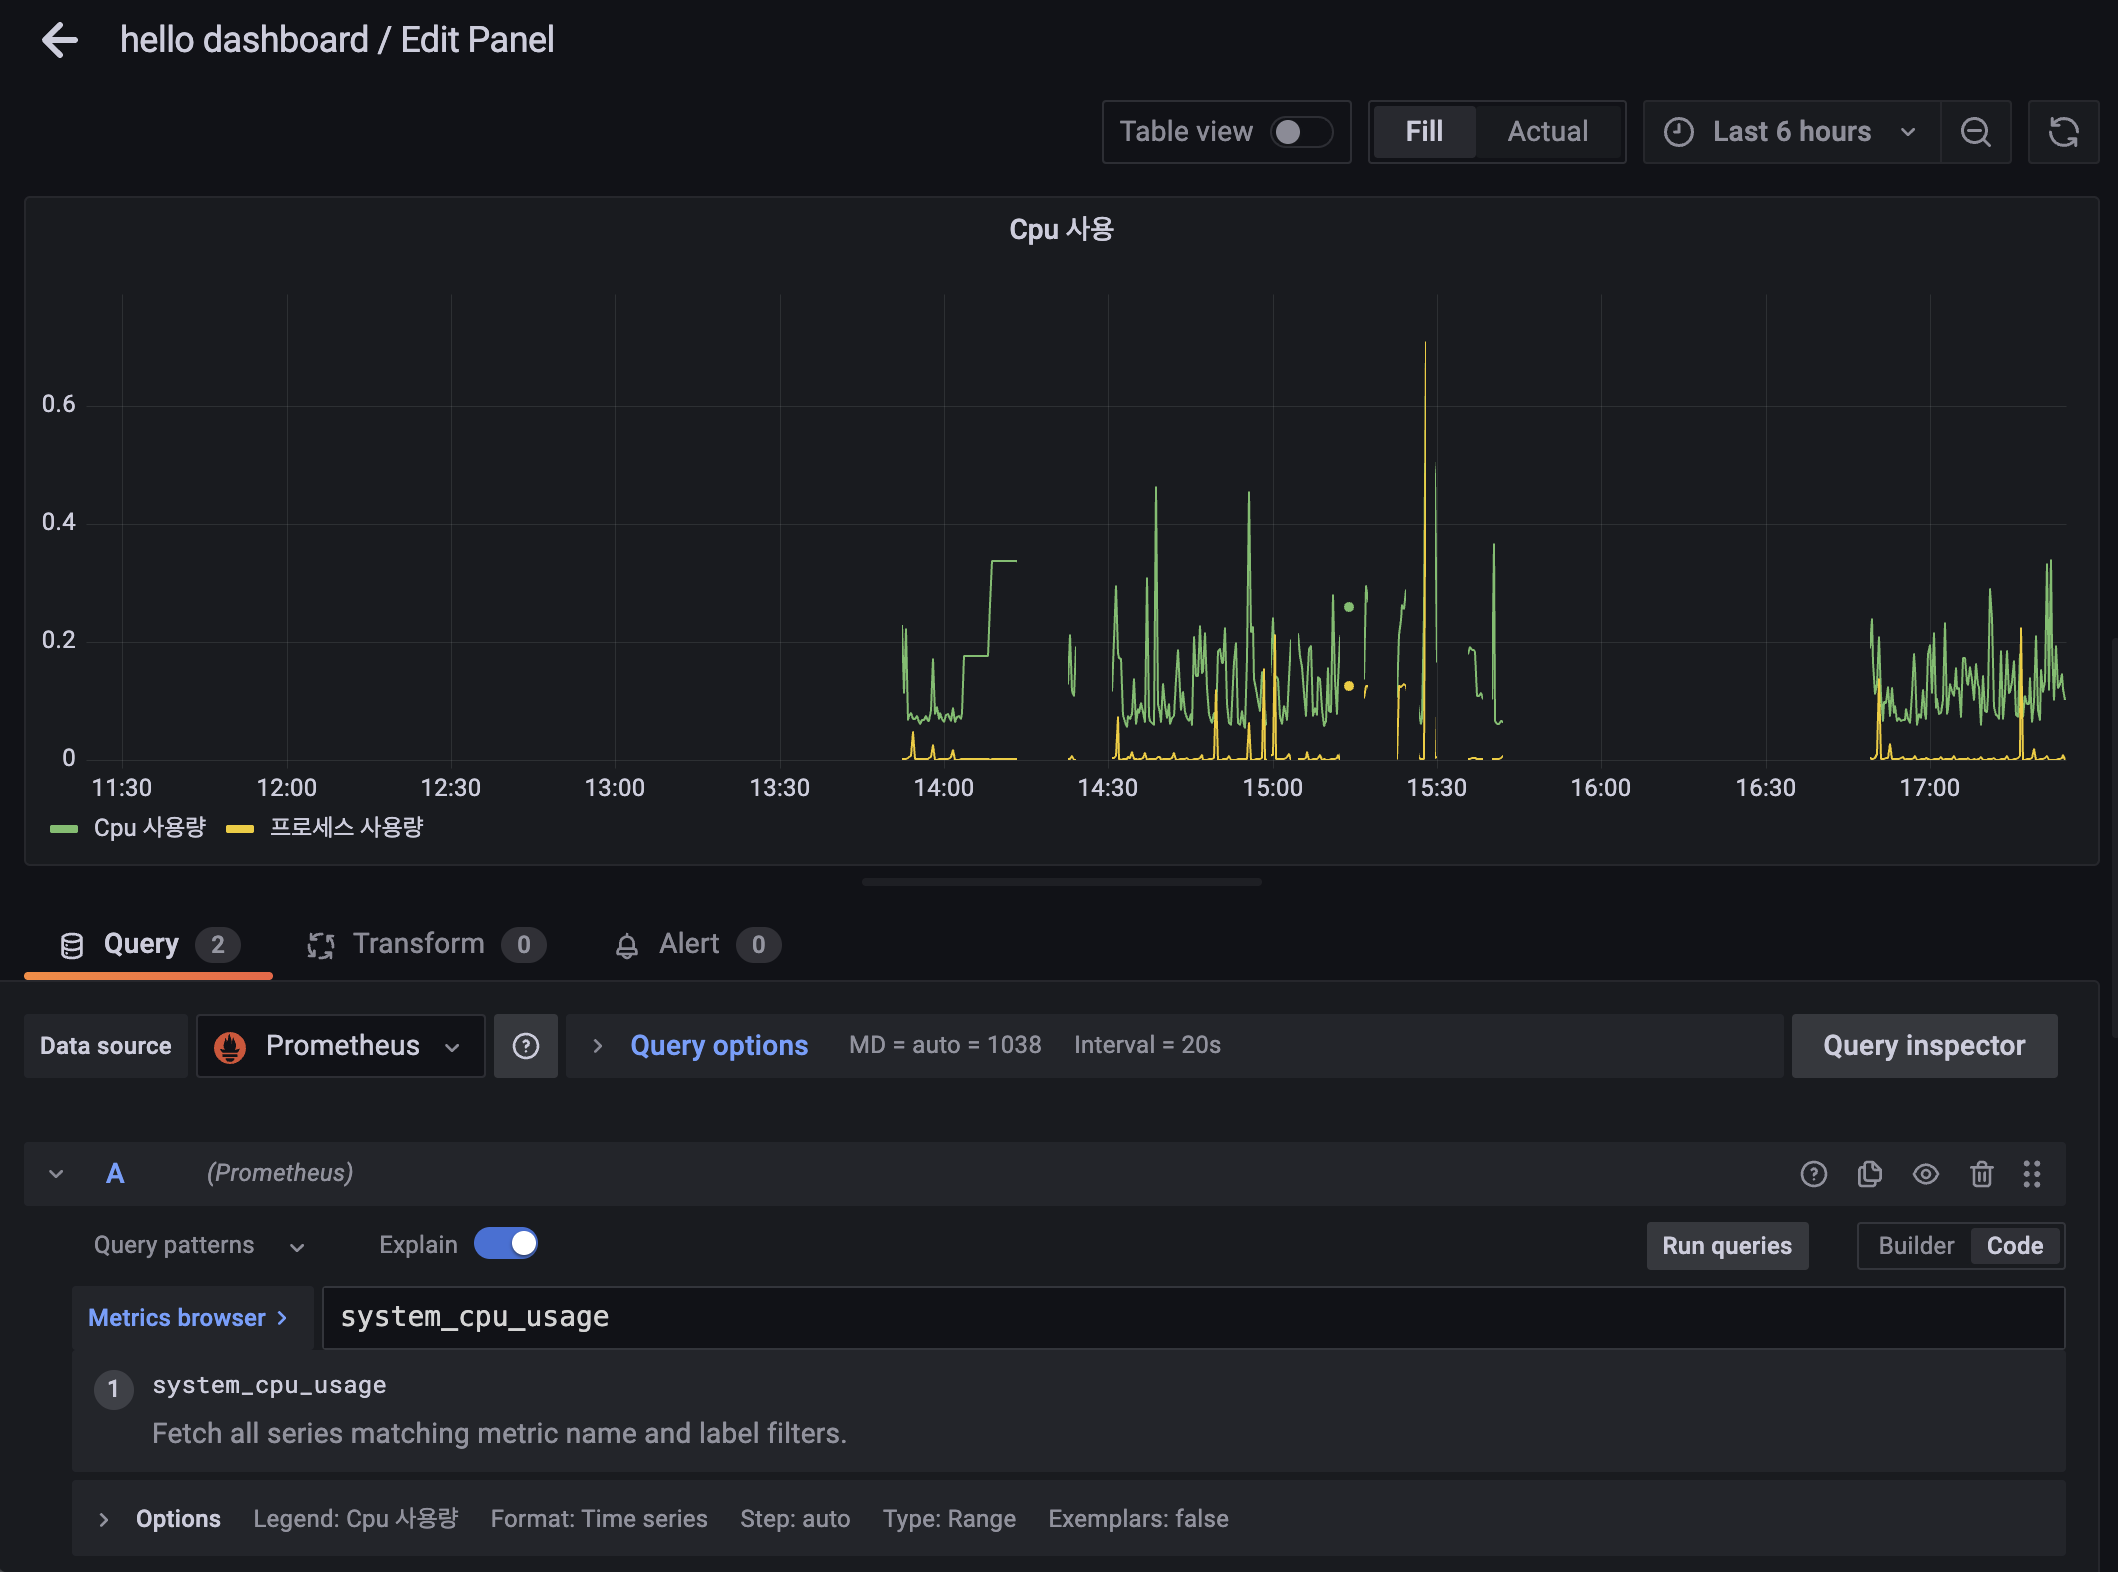
그래프 이름 변경
- 하단의
Options->Legend를 선택하고 Custom을 선택 ->Cpu 사용량를 입력
패널 이름 설정
오른쪽에 보면 Panel options -> Title 수정
그래프 데이터 사이즈 변경
Standard options->Unit->Data->bytes(SI)를 선택
최소값 변경
Standard options->Min- >0을 선택
그라파나 - 공유 대시보드 활용
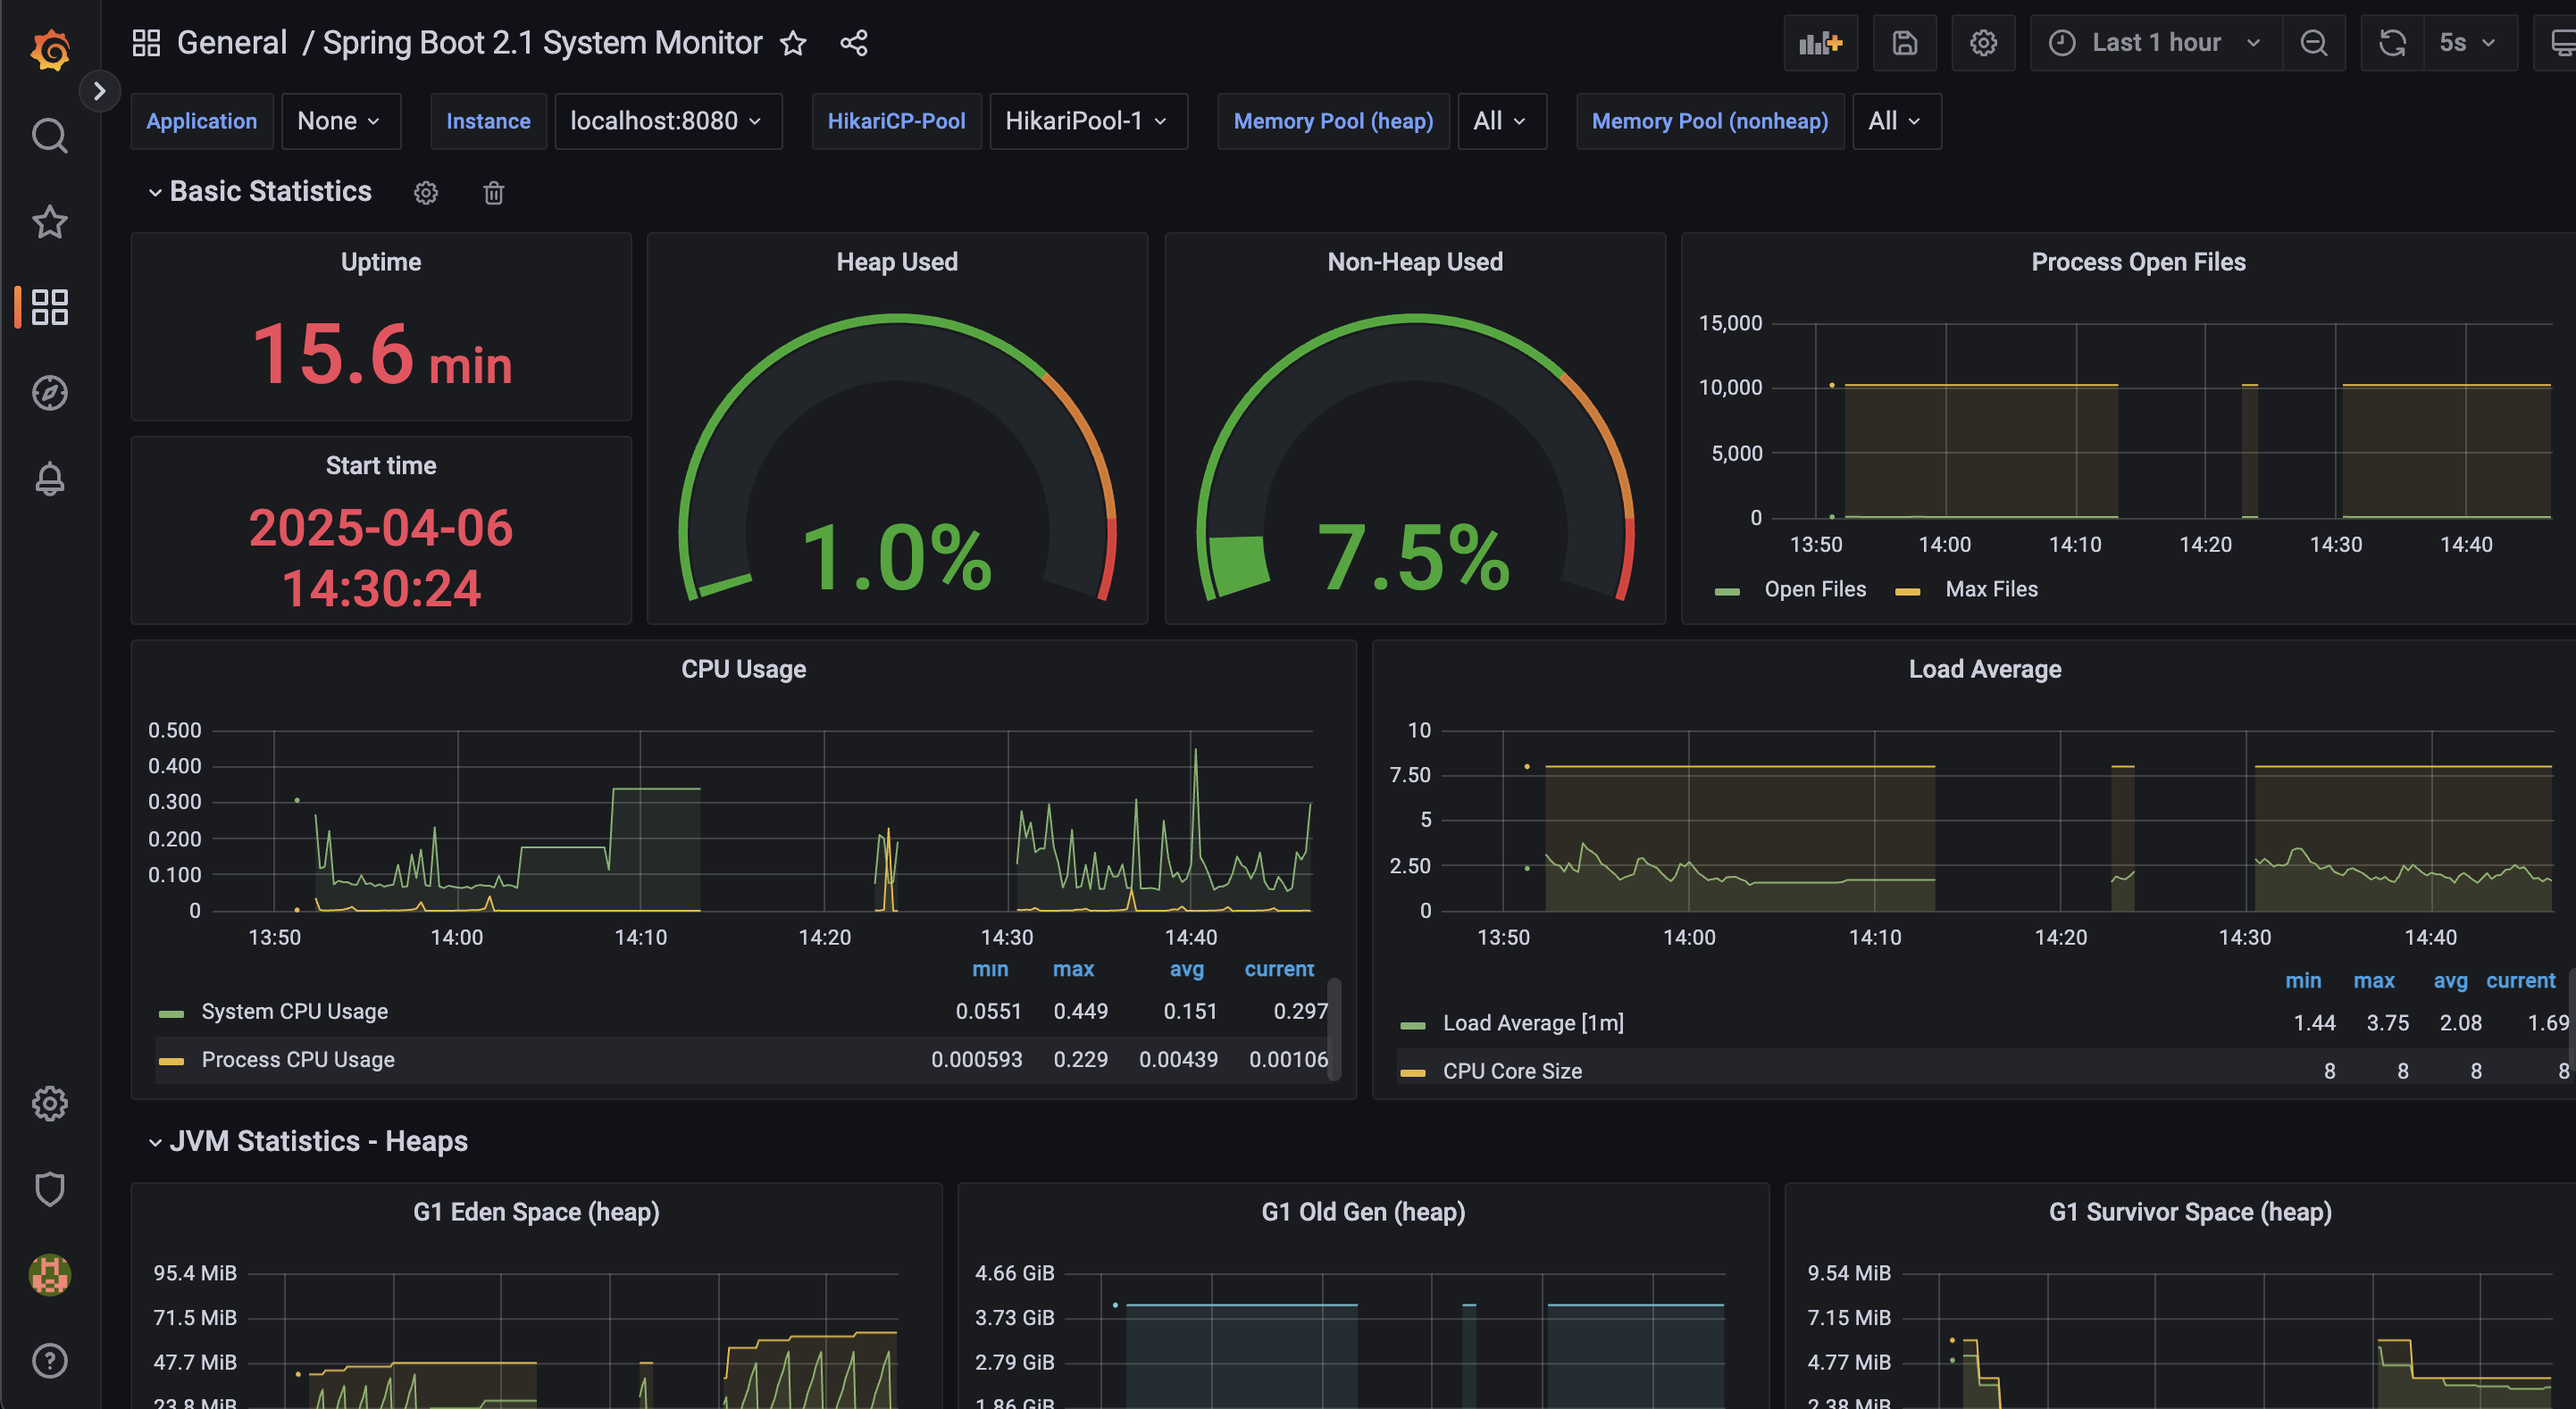
1) 스프링 부트 시스템 모니터 대시보드
https://grafana.com/grafana/dashboards/11378-justai-system-monitor/
Copy Id to clipboard를 통해 id 카피
대시보드 불러오기
- 왼쪽 Dashboards 메뉴 선택
New버튼 선택 ->Import선택- 불러올 대시보드 숫자(
11378)를 입력하고Load버튼 선택 - Prometheus 데이터소스를 선택하고
Import버튼 선택

불러온 대시보드 수정하기
- 오른쪽 상단의 설정 버튼(톱니바퀴, Dashboard settings)을 선택 ->
Make editable선택
Jetty 통계 -> Tomcat 통계
-
Title을
Tomcat Statistics로 수정 -
Thread Config Max 패널 설정 변경
jetty_threads_config_max->tomcat_threads_config_max_threads -
Thread 패널 설정 변경
jetty_threads_current->tomcat_threads_current_threads
jetty_threads_busy->tomcat_threads_busy_threads
jetty_threads_idle-> 제거
jetty_threads_jobs-> 제거
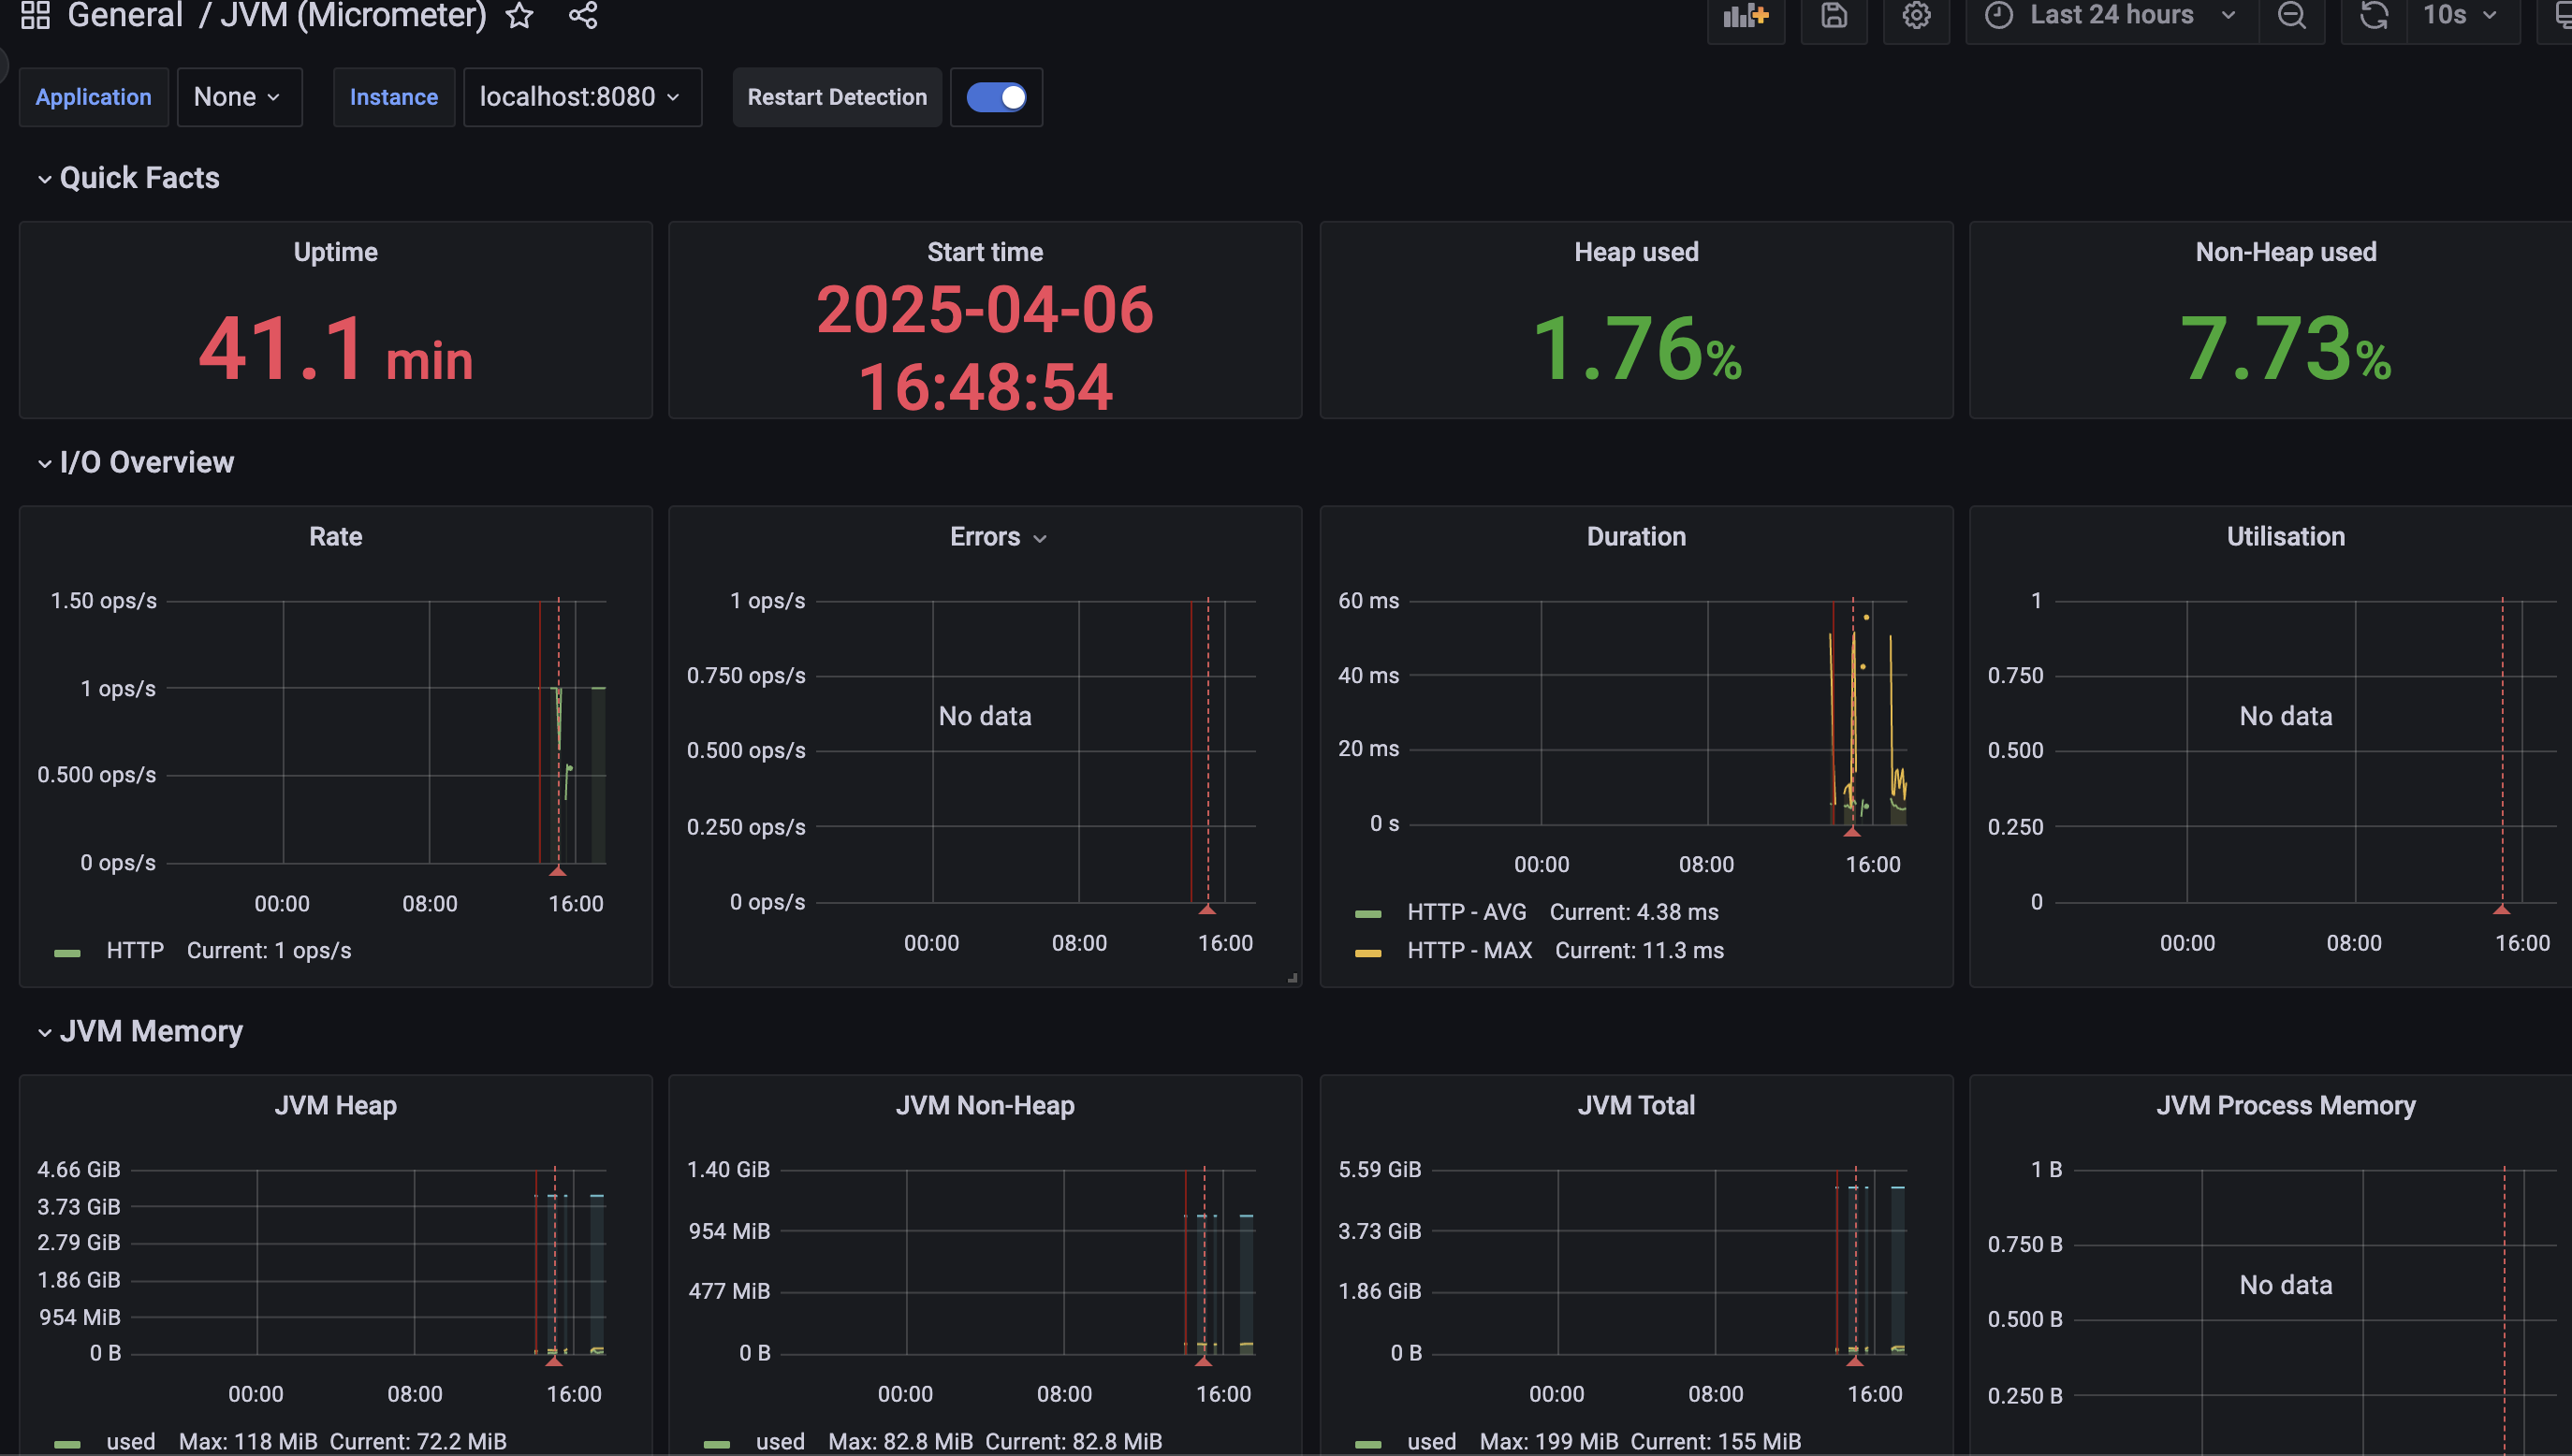
2) 마이크로미터 대시보드 불러오기
마이크로미터 대시보드는 JVM 성능과 리소스 활용 상태를 실시간으로 모니터링하고 최적화를 지원하는 데 유용
https://grafana.com/grafana/dashboards/4701-jvm-micrometer/
프로메테우스와 그라파나 컨테이너를 도커에 띄우기
docker-compose.yml
version: '3.7'
services:
  prometheus:
    container_name: prometheus
    image: prom/prometheus:latest
    volumes:
      - ./prometheus.yml:/etc/prometheus/prometheus.yml
    ports:
      - 9090:9090
    networks:
      - es-bridge

  grafana:
    container_name: grafana
    image: grafana/grafana:latest
    ports:
      - 3000:3000
    depends_on:
      - prometheus
    networks:
      - es-bridge

networks:
  es-bridge:
    driver: bridge
위애서 설정한 prometheus.yml를 직접 만들어서 같은 디렉터리에 생성해줘야한다.
❗️ 하지만 위에 로컬에서 설정한 prometheus.yml를 그대로 설정하면
http://localhost:8080/actuator/prometheus가 잘 작동하더라도,Prometheus컨테이너 내부에서는 해당 타겟을 찾지 못해 상태가 다운(Down)으로 표시된다.
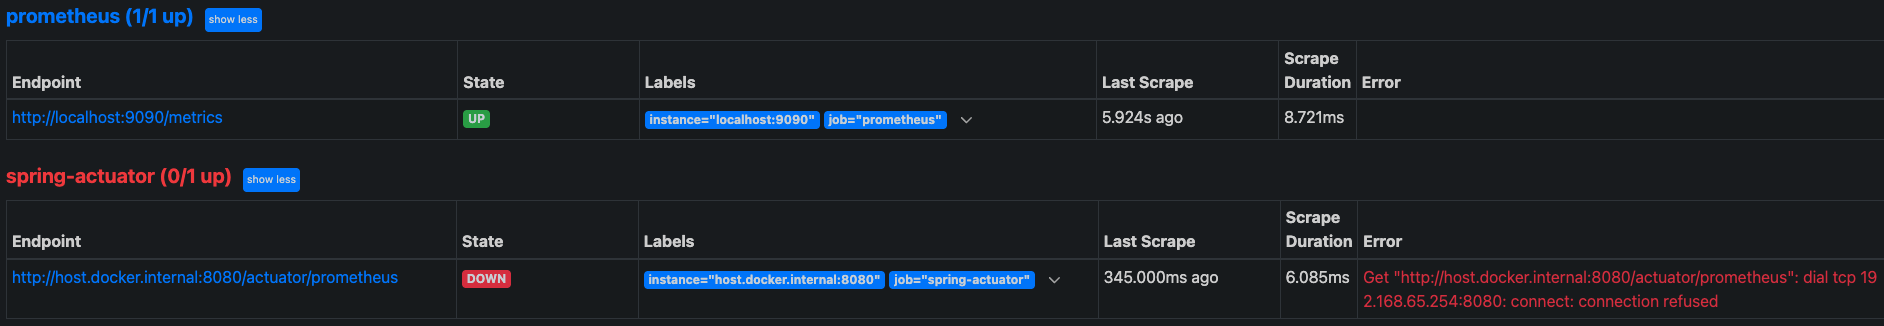
❓ 문제 원인
- 컨테이너 내부의
localhost: Docker 컨테이너는 독립적인 네트워크 네임스페이스를 사용하기 때문에, 컨테이너 내부에서의 localhost는 해당 컨테이너 내에서만 접근 가능한 주소다. - Actuator 서비스가 호스트 또는 다른 컨테이너에서 실행되고 있더라도, Prometheus 컨테이너 내부에서는
localhost:8080으로 접근할 수 없으므로 상태가 다운으로 나타난다.
따라서 이렇게 설정해야한다.
prometheus.yml
# my global config
global:
  scrape_interval: 15s # Set the scrape interval to every 15 seconds. Default is every 1 minute.
  evaluation_interval: 15s # Evaluate rules every 15 seconds. The default is every 1 minute.
  # scrape_timeout is set to the global default (10s).

# Alertmanager configuration
alerting:
  alertmanagers:
    - static_configs:
        - targets:
          # - alertmanager:9093

# Load rules once and periodically evaluate them according to the global 'evaluation_interval'.
rule_files:
# - "first_rules.yml"
# - "second_rules.yml"

# A scrape configuration containing exactly one endpoint to scrape:
# Here it's Prometheus itself.
scrape_configs:
  - job_name: "prometheus"
    static_configs:
      - targets: [ "localhost:9090" ]
  - job_name: "spring-actuator"
    metrics_path: '/actuator/prometheus'
    scrape_interval: 1s
    static_configs:
- targets: [ "host.docker.internal:8080" ]docker-compose up -d❓ 문제 원인
- 그라파나에서 프로메테우스를 데이터소스로 등록하려고 할 때
localhost:9090로 설정을 한다면 밑에 처럼 오류가 발생할 수가 있다.

- 따라서
localhost:9090대신http://prometheus:9090같은 식으로 컨테이너(혹은 서비스) 이름을 호스트로 써야한다.
❗️ Docker 컨테이너 내부에서는 localhost가 해당 컨테이너 자체를 가리키므로, 같은 네트워크의 다른 컨테이너에 접근하려면 컨테이너 이름을 사용해야 한다. 반대로 Docker 컨테이너 내부에서 로컬(호스트) 머신에 접근하려면
host.docker.internal을 사용
참고 :