Actuator 역할
애플리케이션의 상태를 확인하고 모니터링하는 Spring Boot 모듈이다.
애플리케이션 실행 여부, 패키지 로깅 레벨, Bean 목록, Metric(CPU, Heap, Thread 등등)
여러 정보를 실시간으로 모니터링하고 관리하는 도구이다.
의존성 추가 - build.gradle
build.gradle에 아래 내용을 추가해준다.
dependencies {
	...
	implementation 'org.springframework.boot:spring-boot-starter-actuator'
	...
}
application.properties
application.properties 파일에 아래 설정을 추가하면
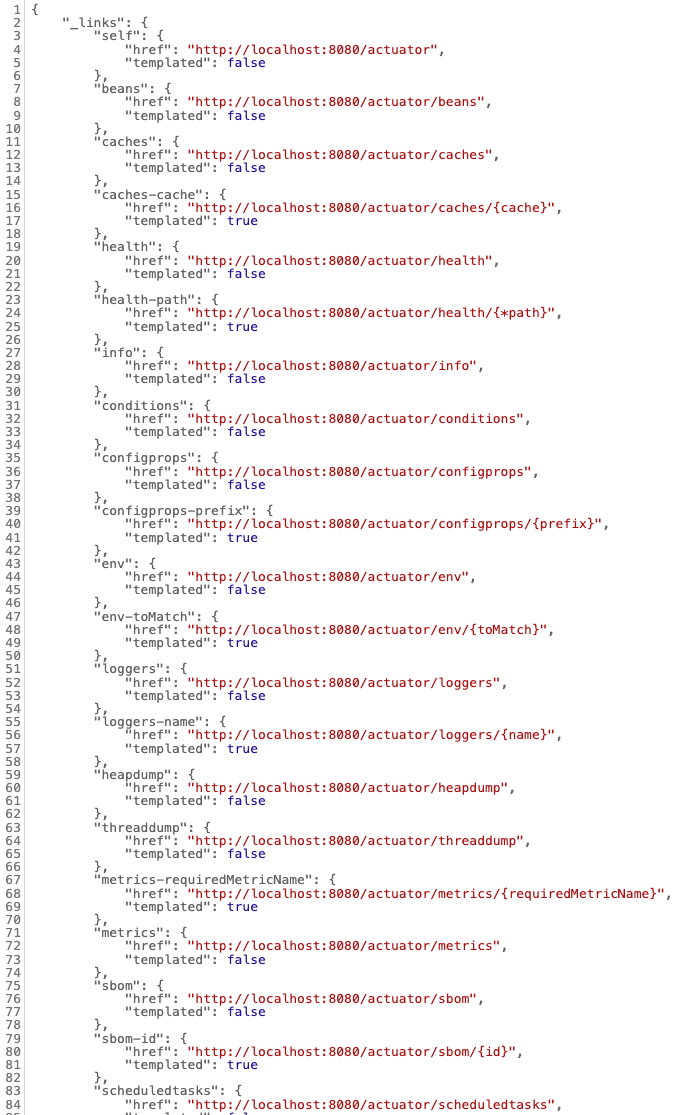
spring actuator가 지원하는 모든 endpoint가 보인다.
management.endpoints.web.exposure.include=*
여기서 endpoint란 스프링 어플리케이션이 실행된 상태에서 특정 URL=HTTP Endpoint
예를 들어 /actuator/health로 이동하면 미리 설정된 모니터링 정보가 나오는 것을 말한다.
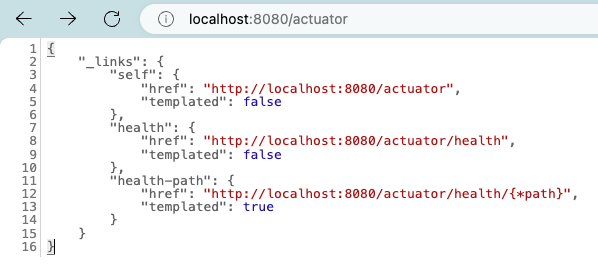
설정 전
설정 후
{
    "_links": {
        "self": {
            "href": "http://localhost:8080/actuator",
            "templated": false
        },
        "beans": {
            "href": "http://localhost:8080/actuator/beans",
            "templated": false
        },
        "caches": {
            "href": "http://localhost:8080/actuator/caches",
            "templated": false
        },
        "caches-cache": {
            "href": "http://localhost:8080/actuator/caches/{cache}",
            "templated": true
        },
        "health": {
            "href": "http://localhost:8080/actuator/health",
            "templated": false
        },
        "health-path": {
            "href": "http://localhost:8080/actuator/health/{*path}",
            "templated": true
        },
        "info": {
            "href": "http://localhost:8080/actuator/info",
            "templated": false
        },
        "conditions": {
            "href": "http://localhost:8080/actuator/conditions",
            "templated": false
        },
        "configprops": {
            "href": "http://localhost:8080/actuator/configprops",
            "templated": false
        },
        "configprops-prefix": {
            "href": "http://localhost:8080/actuator/configprops/{prefix}",
            "templated": true
        },
        "env": {
            "href": "http://localhost:8080/actuator/env",
            "templated": false
        },
        "env-toMatch": {
            "href": "http://localhost:8080/actuator/env/{toMatch}",
            "templated": true
        },
        "loggers": {
            "href": "http://localhost:8080/actuator/loggers",
            "templated": false
        },
        "loggers-name": {
            "href": "http://localhost:8080/actuator/loggers/{name}",
            "templated": true
        },
        "heapdump": {
            "href": "http://localhost:8080/actuator/heapdump",
            "templated": false
        },
        "threaddump": {
            "href": "http://localhost:8080/actuator/threaddump",
            "templated": false
        },
        "metrics-requiredMetricName": {
            "href": "http://localhost:8080/actuator/metrics/{requiredMetricName}",
            "templated": true
        },
        "metrics": {
            "href": "http://localhost:8080/actuator/metrics",
            "templated": false
        },
        "sbom": {
            "href": "http://localhost:8080/actuator/sbom",
            "templated": false
        },
        "sbom-id": {
            "href": "http://localhost:8080/actuator/sbom/{id}",
            "templated": true
        },
        "scheduledtasks": {
            "href": "http://localhost:8080/actuator/scheduledtasks",
            "templated": false
        },
        "mappings": {
            "href": "http://localhost:8080/actuator/mappings",
            "templated": false
        }
    }
}
HTTP endpoint 종류
/actuator
현재 활성화된 spring actuator endpoint들을 반환한다.
/actuator/beans
애플리케이션 사용하는 모든 빈들이 나온다.
/actuator/configprops
application.properties에서 설정한 모든 내용이 나온다.
/actuator/env
애플리케이션 실행환경에 대한 세부내용이 표시된다.
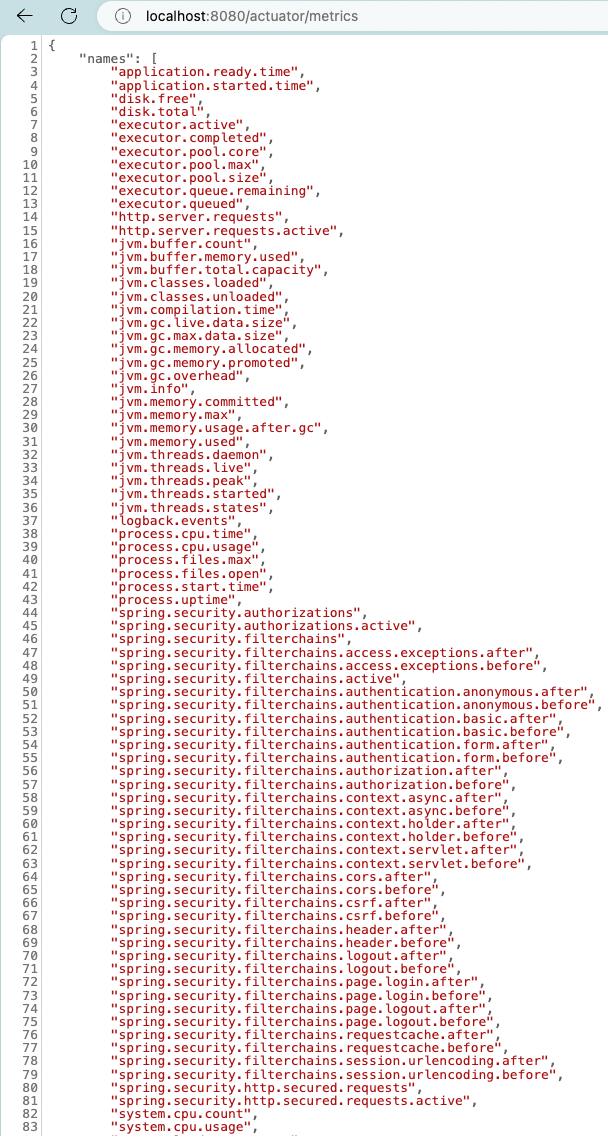
/actuator/metrics
사용된 JVM 메모리, 시스템 CPU 사용량, 열린 파일 등등 확인가능하다.
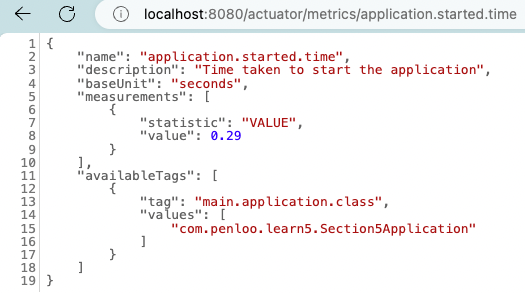
자세한 내용을 알고싶다면 /actuator/metrics/이름 형식으로 하면 가능하다.
예를 들어 /actuator/metrics/application.started.time로 들어가면
아래처럼 해당정보가 나오게 된다.\\\\\\\\\\\\\\\\\\\\\\\\\\\\\\\\\\\\\
이외에도 많은 엔드포인트가 있지만 주로 사용되는 것들만 나열해봤다.