
이번엔 EKS를 사용하면서 모니터링 환경을 구축하는 방법에 대해서 알아보도록 하겠다. 먼저 로깅에 대해서 알아보자.
EKS에서의 로그는 두 가지로 나눌 수 있는데,
- 컨트롤 플레인 로그
- 워커노드에서 실행되는 어플리케이션 로그
이렇게 두 가지로 나눌 수 있다.
컨트롤 플레인에서의 로그는 k8s apiserver, controller manager, scheduler 등 과 같은 시스템 레벨의 로그를 확인할 수 있고, 워커 노드의 로그에서는 kublet, kube-proxy 관련된 로그와 컨테이너에서 실행되는 어플리케이션 레벨의 로그를 확인할 수 있다.
일단 로그를 구현하기 전에 쿠버네티스의 구조를 간단히 다시 보자.
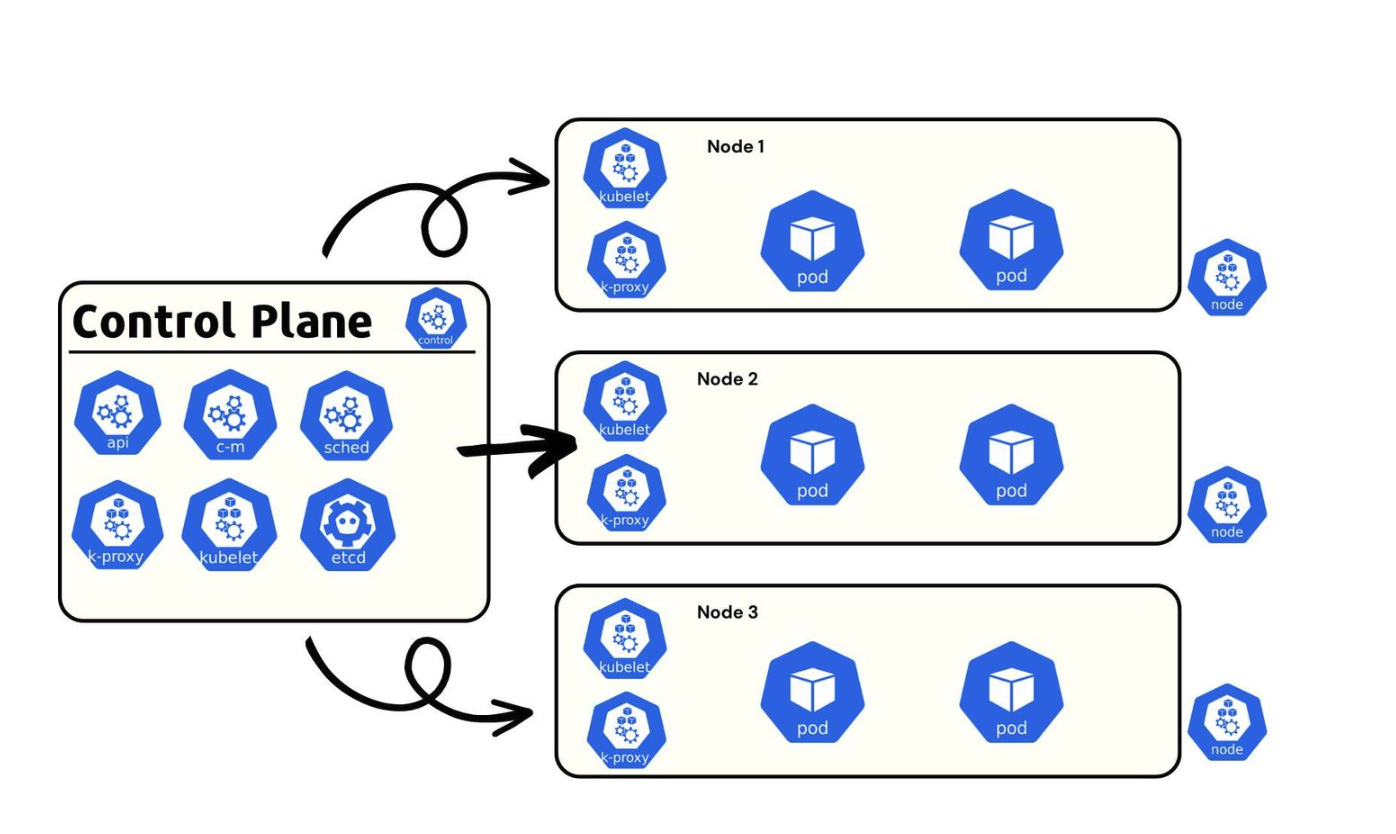
대략 이러한 구조로 컨트롤 플레인과 여러 노드로 구성되어 있다. 그리고 노드마다 파드를 가지고 있는데, 예를 들어서 파드의 종류가
- Nginx
- Java
- Prometheus
이렇게 세 개 종류의 파드가 있고 각각 n개의 레플리카가 설정되어 있다고 하자. 각 파드마다 한 노드에만 배포되는 것이 아니라, 컨트롤 플레인의 계산에 따라 적절히 노드에 분산되고 섞여서 파드가 생성되고 사라짐을 반복한다.
따라서 로그를 수집하려면 무언가가 중간에서 적절히 로그가 어디서 오는지 확인해서 수집하고 어딘가로 보내줘야 한다.
이러한 역할을 해주는 대표적인 툴이 fluentd, fluentbit이다.
fluentbit, fluentd는 각 노드마다 존재하여 파드들의 로그를 수집 후 특정 장소로 보내준다. 이전에는 fluentd라는 이름의 툴이 오랫동안 사용되어 레퍼런스와 플러그인이 많지만, luentbit는 fluentd에 비해 경량이며, fluentd보다 많은 양의 로그를 유실없이 전달할 수 있다고 한다.
또 fluentd 관련해서는 aws가 공식적으로 지원을 종료하면서 fluentbit를 사용하는게 일반적이라고 한다.
이번 글을 통해 fluentbit를 설치하여 파드들의 로그를 수집 후 AWS Cloudwatch로 보내는 설정방법을 알아보자.
FluentBit을 통해 AWS Cloudwatch로 로그 보내기
먼저 설정에 필요한 클러스터 먼저 생성해보자. 참고로 이번 글에서는 micro 사양의 인스턴스로는 진행이 어려울 수 있다. 노드 개수만큼 로깅 에이전트가 많이 실행이 되기 때문에 충분한 사양의 인스턴스 타입을 설정해주는 것이 좋다.
eksctl create cluster \
--name monitoring-test \
--nodegroup-name ng-default \
--node-type t3.xlarge \
--nodes 2
아주 넉넉하게 t3.xlarge 로 생성했다. t3.xlarge 는 medium에 비해 거의 3배 가까운 가격을 자랑하므로 얼른 테스트를 하고 종료하는걸 추천한다.
이제 로깅을 위한 fluentbit 관련 파드와 설정들이 위치할 네임스페이스를 만들어준다
kubectl apply -f https://raw.githubusercontent.com/aws-samples/amazon-cloudwatch-container-insights/latest/k8s-deployment-manifest-templates/deployment-mode/daemonset/container-insights-monitoring/cloudwatch-namespace.yaml그리고 configmap도 생성해야 하는데, fluentbit가 이 configmap을 참고해서 로그를 읽어온다.
ClusterName=monitoring-test
RegionName=ap-northeast-2
FluentBitHttpPort='2020'
FluentBitReadFromHead='Off'
[[ ${FluentBitReadFromHead} = 'On' ]] && FluentBitReadFromTail='Off'|| FluentBitReadFromTail='On'
[[ -z ${FluentBitHttpPort} ]] && FluentBitHttpServer='Off' || FluentBitHttpServer='On'
kubectl create configmap fluent-bit-cluster-info \
--from-literal=cluster.name=${ClusterName} \
--from-literal=http.server=${FluentBitHttpServer} \
--from-literal=http.port=${FluentBitHttpPort} \
--from-literal=read.head=${FluentBitReadFromHead} \
--from-literal=read.tail=${FluentBitReadFromTail} \
--from-literal=logs.region=${RegionName} -n amazon-cloudwatch
참고로 여기서 진행하는 cluster의 이름은 위에서 monitoring-test로 설정했기 때문에 ClusterName값에 monitoring-test가 들어있는데, 이름이 다르다면 수정해주면 된다.
이제 fluentbit를 설치한다.
kubectl apply -f https://raw.githubusercontent.com/aws-samples/amazon-cloudwatch-container-insights/latest/k8s-deployment-manifest-templates/deployment-mode/daemonset/container-insights-monitoring/fluent-bit/fluent-bit.yaml이렇게 하면 설치가 완료되지만 로그가 바로 cloudwatch에 전송되진 않는다. 실제로 cloudwatch에 log group 콘솔에 들어가도 아무런 반응이 없다.
이유는 권한이 없기 때문인데
kubectl describe sa fluent-bit -n amazon-cloudwatch이 커맨드를 실행하면 annotation 쪽에 <None> 이라고 되어 있다.
eksctl utils associate-iam-oidc-provider \
    --cluster monitoring-test \
    --region ap-northeast-2 \
    --approve

eksctl create iamserviceaccount \
--cluster=monitoring-test \
--namespace=amazon-cloudwatch \
--name=fluent-bit \
--attach-policy-arn=arn:aws:iam::aws:policy/CloudWatchAgentServerPolicy \
--override-existing-serviceaccounts \
--approve
위 커맨드를 통해 권한을 주고 다시 권한 확인 명령어를 실행하면 annotation에 권한이 있음을 확인할 수 있다. 참고로 여기서 주는 policy는 AWS에 기본 policy이므로 따로 만들어줄 필요는 없다.
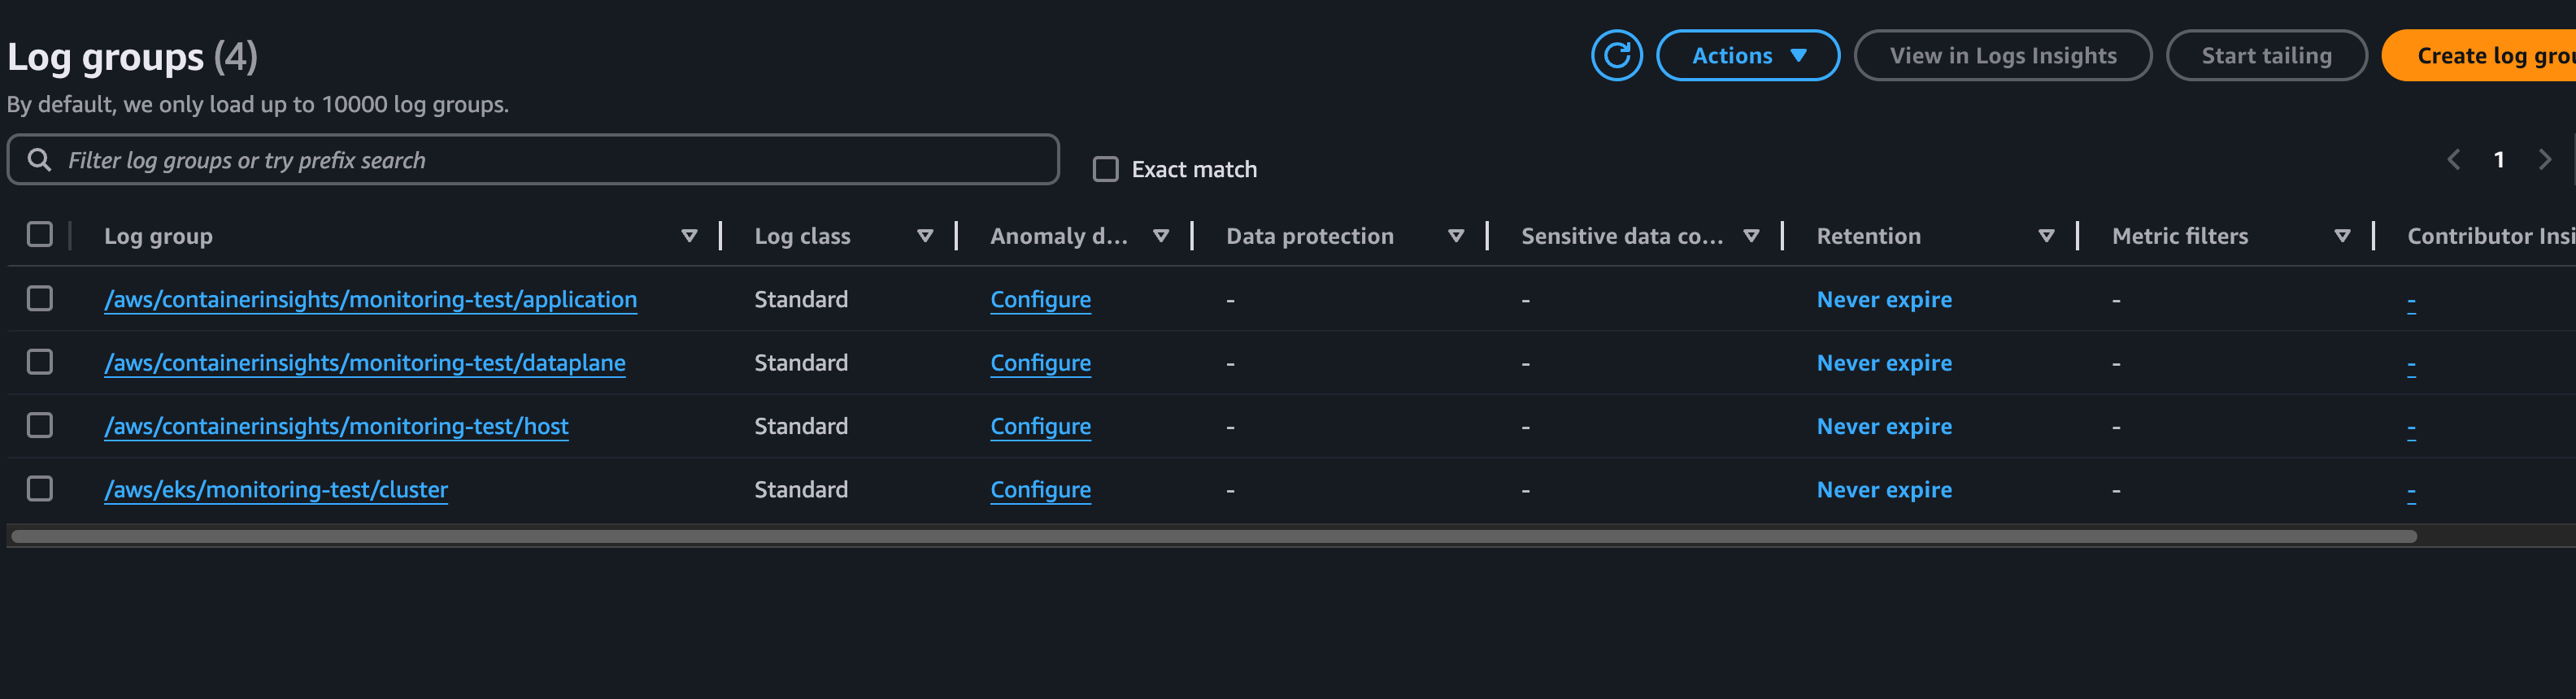
다시 Cloudwatch 콘솔에 log group에 들어가면
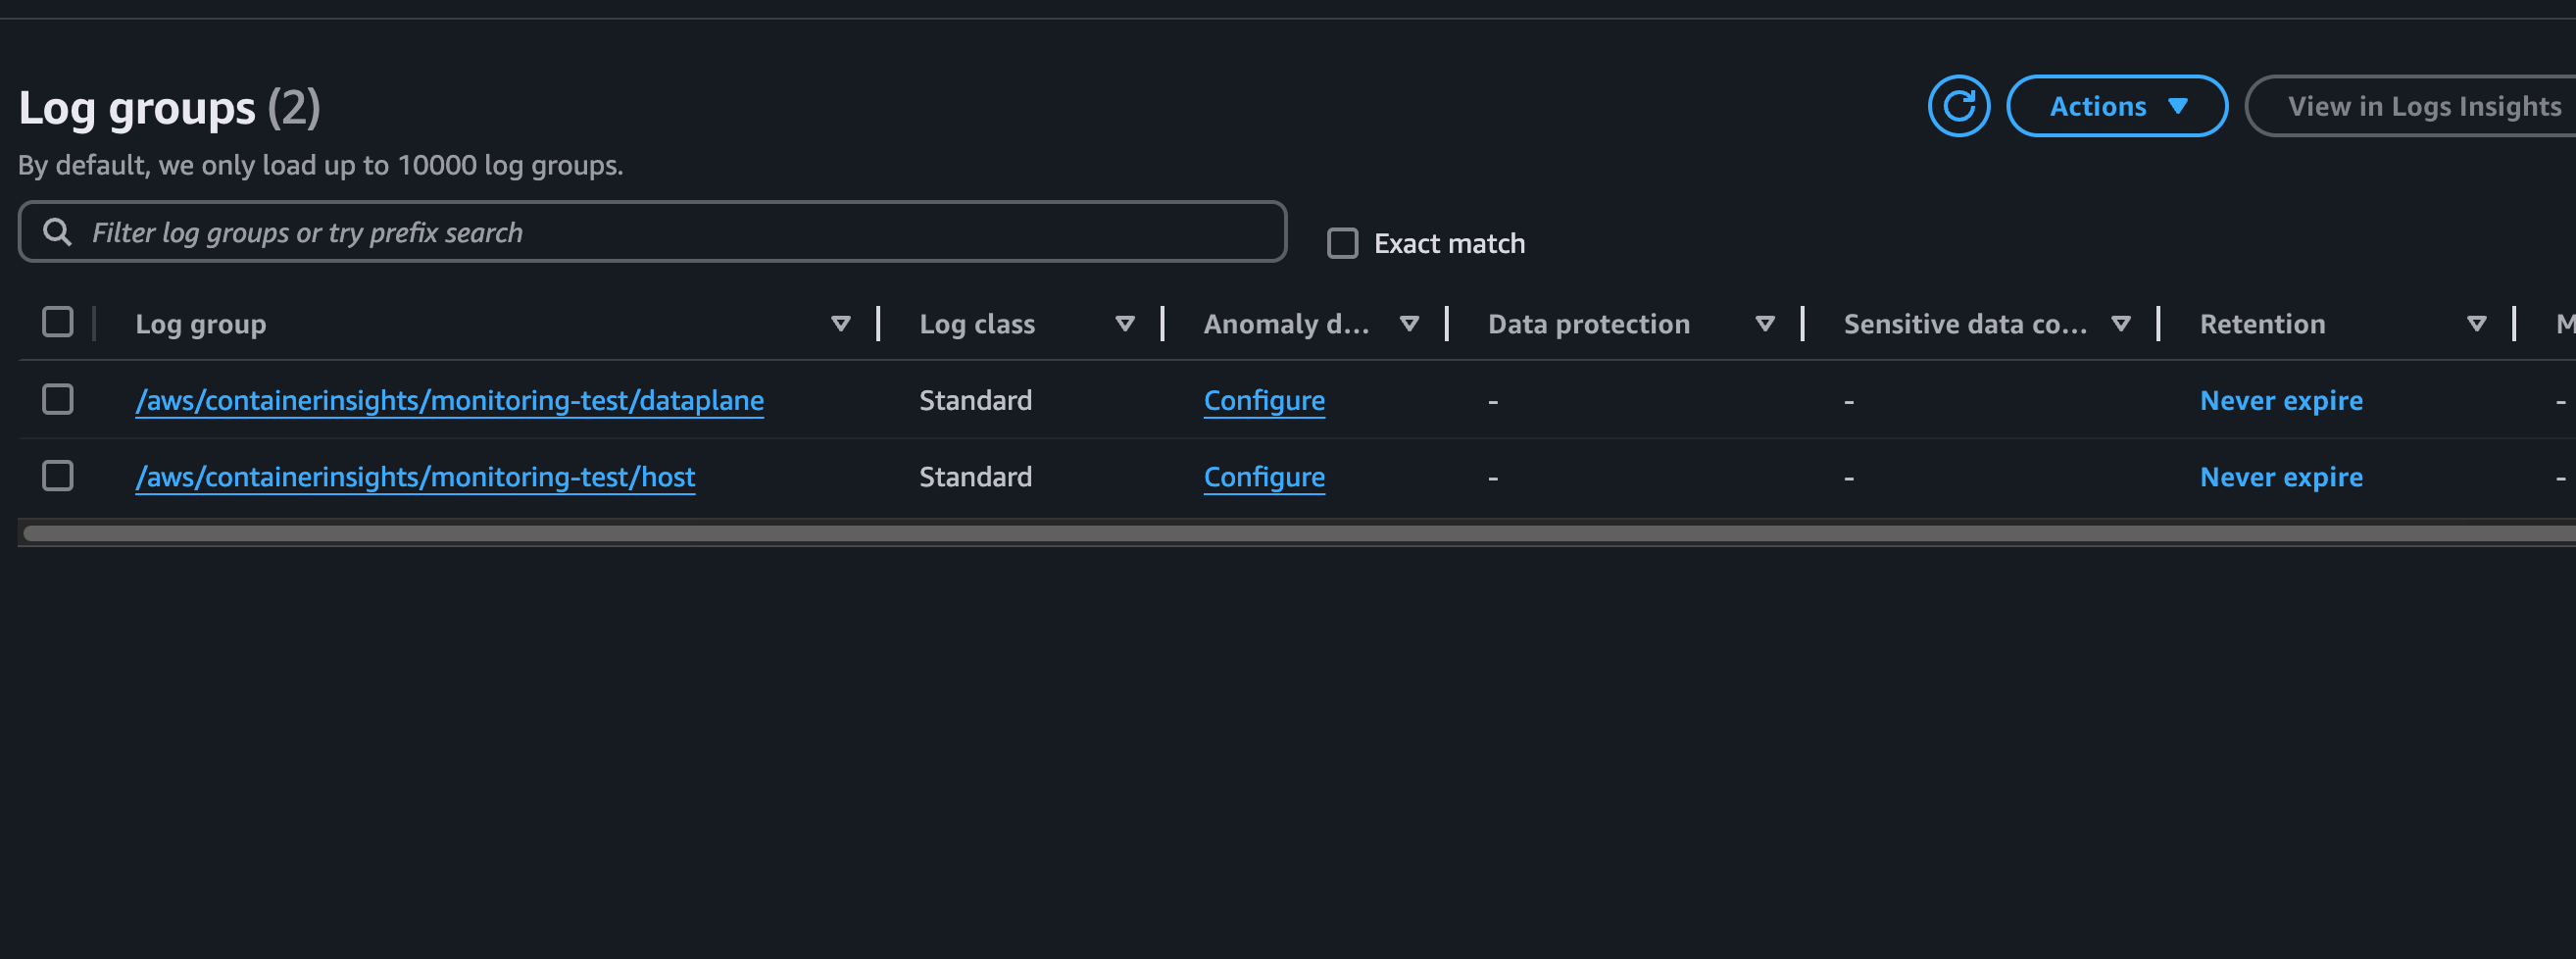
로그 그룹이 정상적으로 생성된 것을 확인할 수 있다. 지금은 dataplane, host라는 시스템 관련된, 즉 위에서 설명한 컨트롤 플레인 로그만 있는데 어플리케이션 로그도 확인하기 위해 어플리케이션을 만들어보자
apiVersion: v1
kind: Service
metadata:
  name: lb-service
  labels:
    app: lb-service
spec:
  type: LoadBalancer
  ports:
  - port: 80
  selector:
    app: frontend
---
apiVersion: apps/v1
kind: Deployment
metadata:
  name: frontend-deployment
spec:
  replicas: 2
  selector:
    matchLabels:
      app: frontend
  minReadySeconds: 30
  strategy:
    type: RollingUpdate
    rollingUpdate:
      maxSurge: 1
      maxUnavailable: 0
  template:
    metadata:
      labels:
        app: frontend
    spec:
      containers:
      - name: frontend-container
        image: nginx
위 파일을 생성하고, kubectl apply -f {filename} 을 실행하면 nginx 어플리케이션에 로드밸런서를 달아서 배포해준다.
이 때 여기서 t3.micro로 실행했다가
  Type     Reason            Age                From               Message
  ----     ------            ----               ----               -------
  Warning  FailedScheduling  52s (x9 over 41m)  default-scheduler  0/2 nodes are available: 2 Too many pods. preemption: 0/2 nodes are available: 2 No preemption victims found for incoming pod.
이런 에러를 만나서 서버를 스케일업해줬다. 정상적으로 파드가 동작이 되면
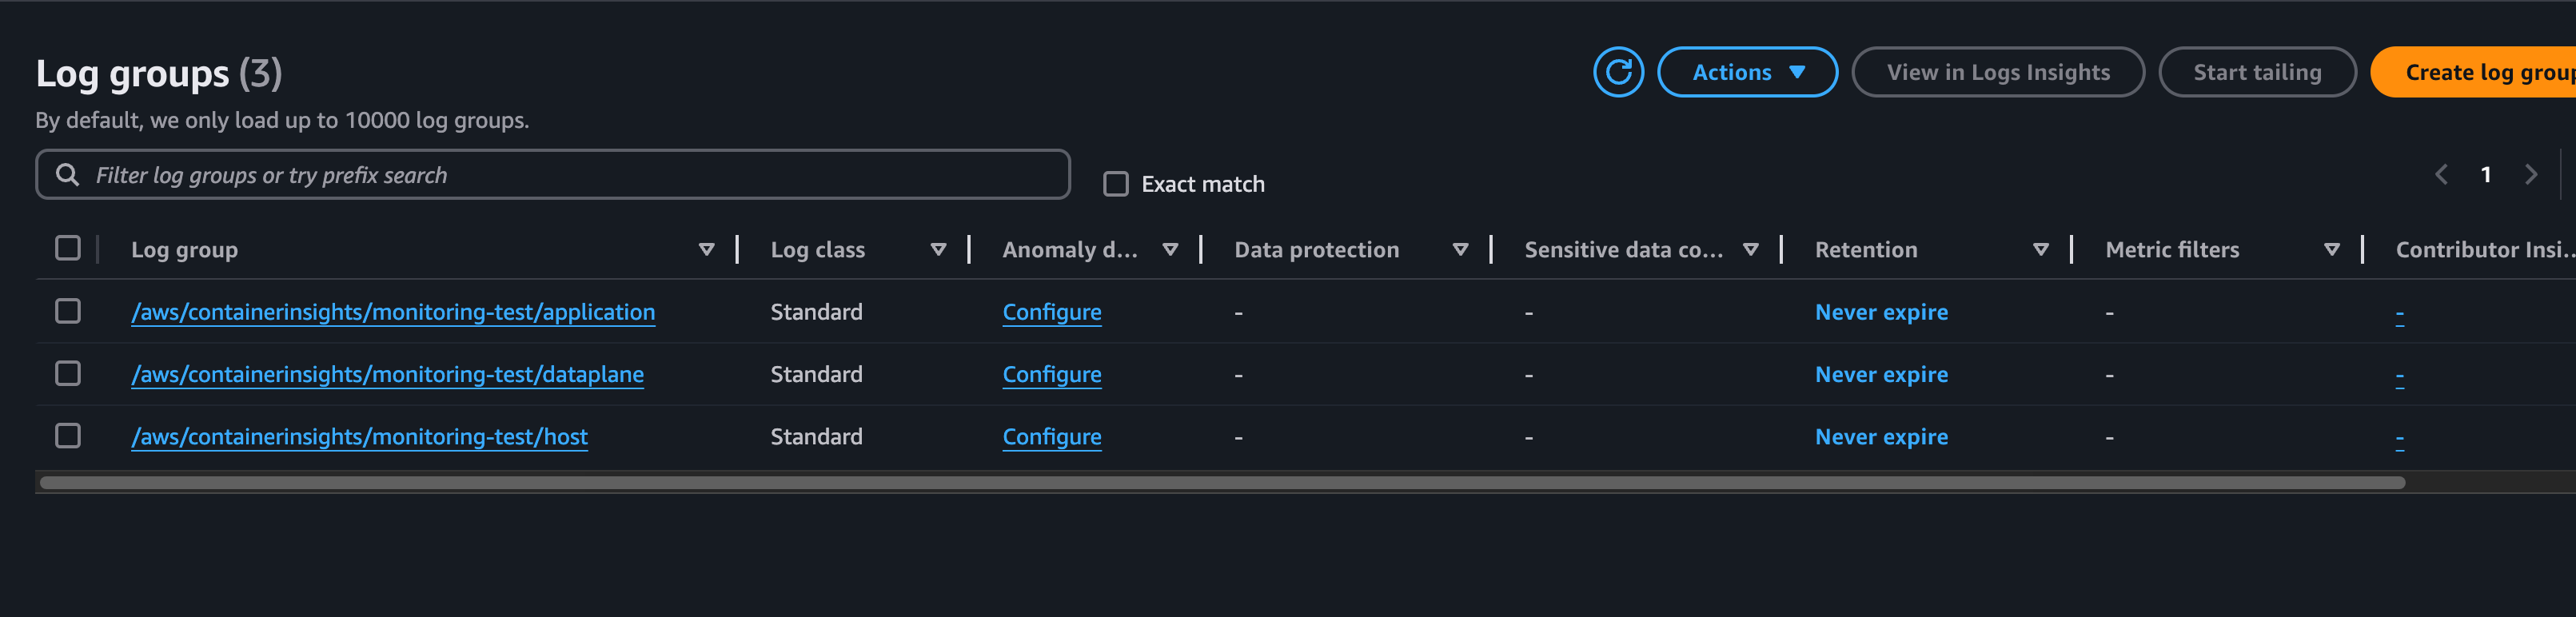
로그 그룹에서 어플리케이션 관련 로그도 확인할 수 있다.
EKS 웹 콘솔에서 컨트롤 플레인 로그를 활성화 시킬수도 있는
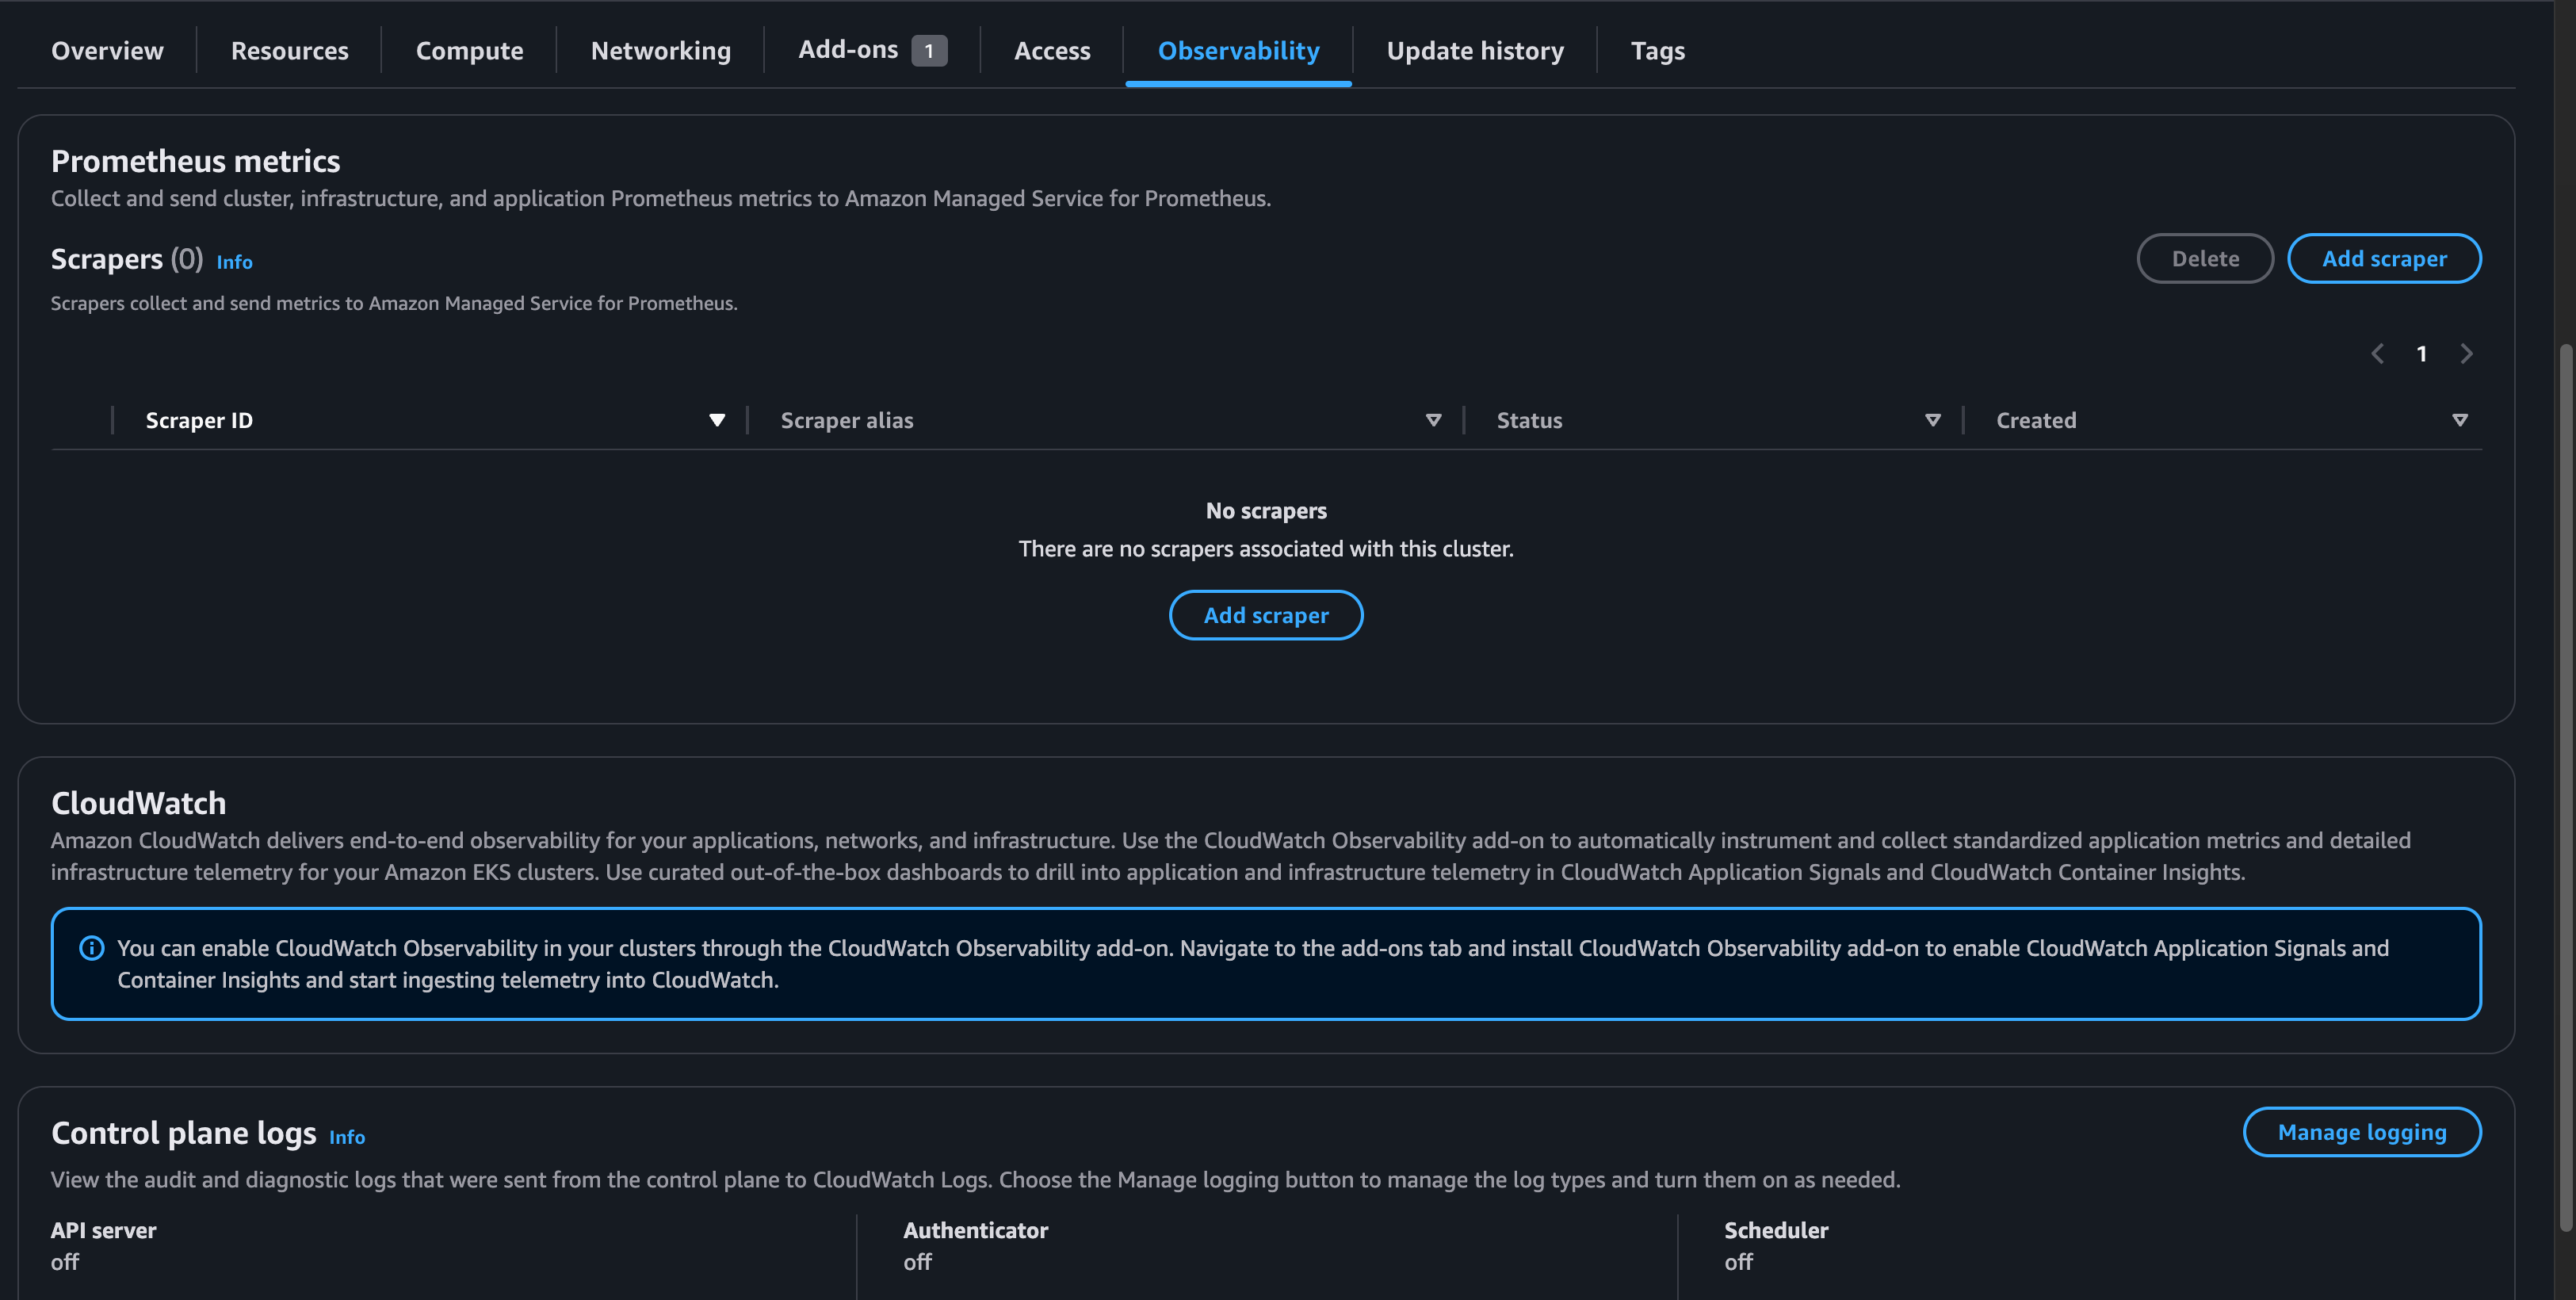
Observablility 탭에 Manage Logging에 들어가서
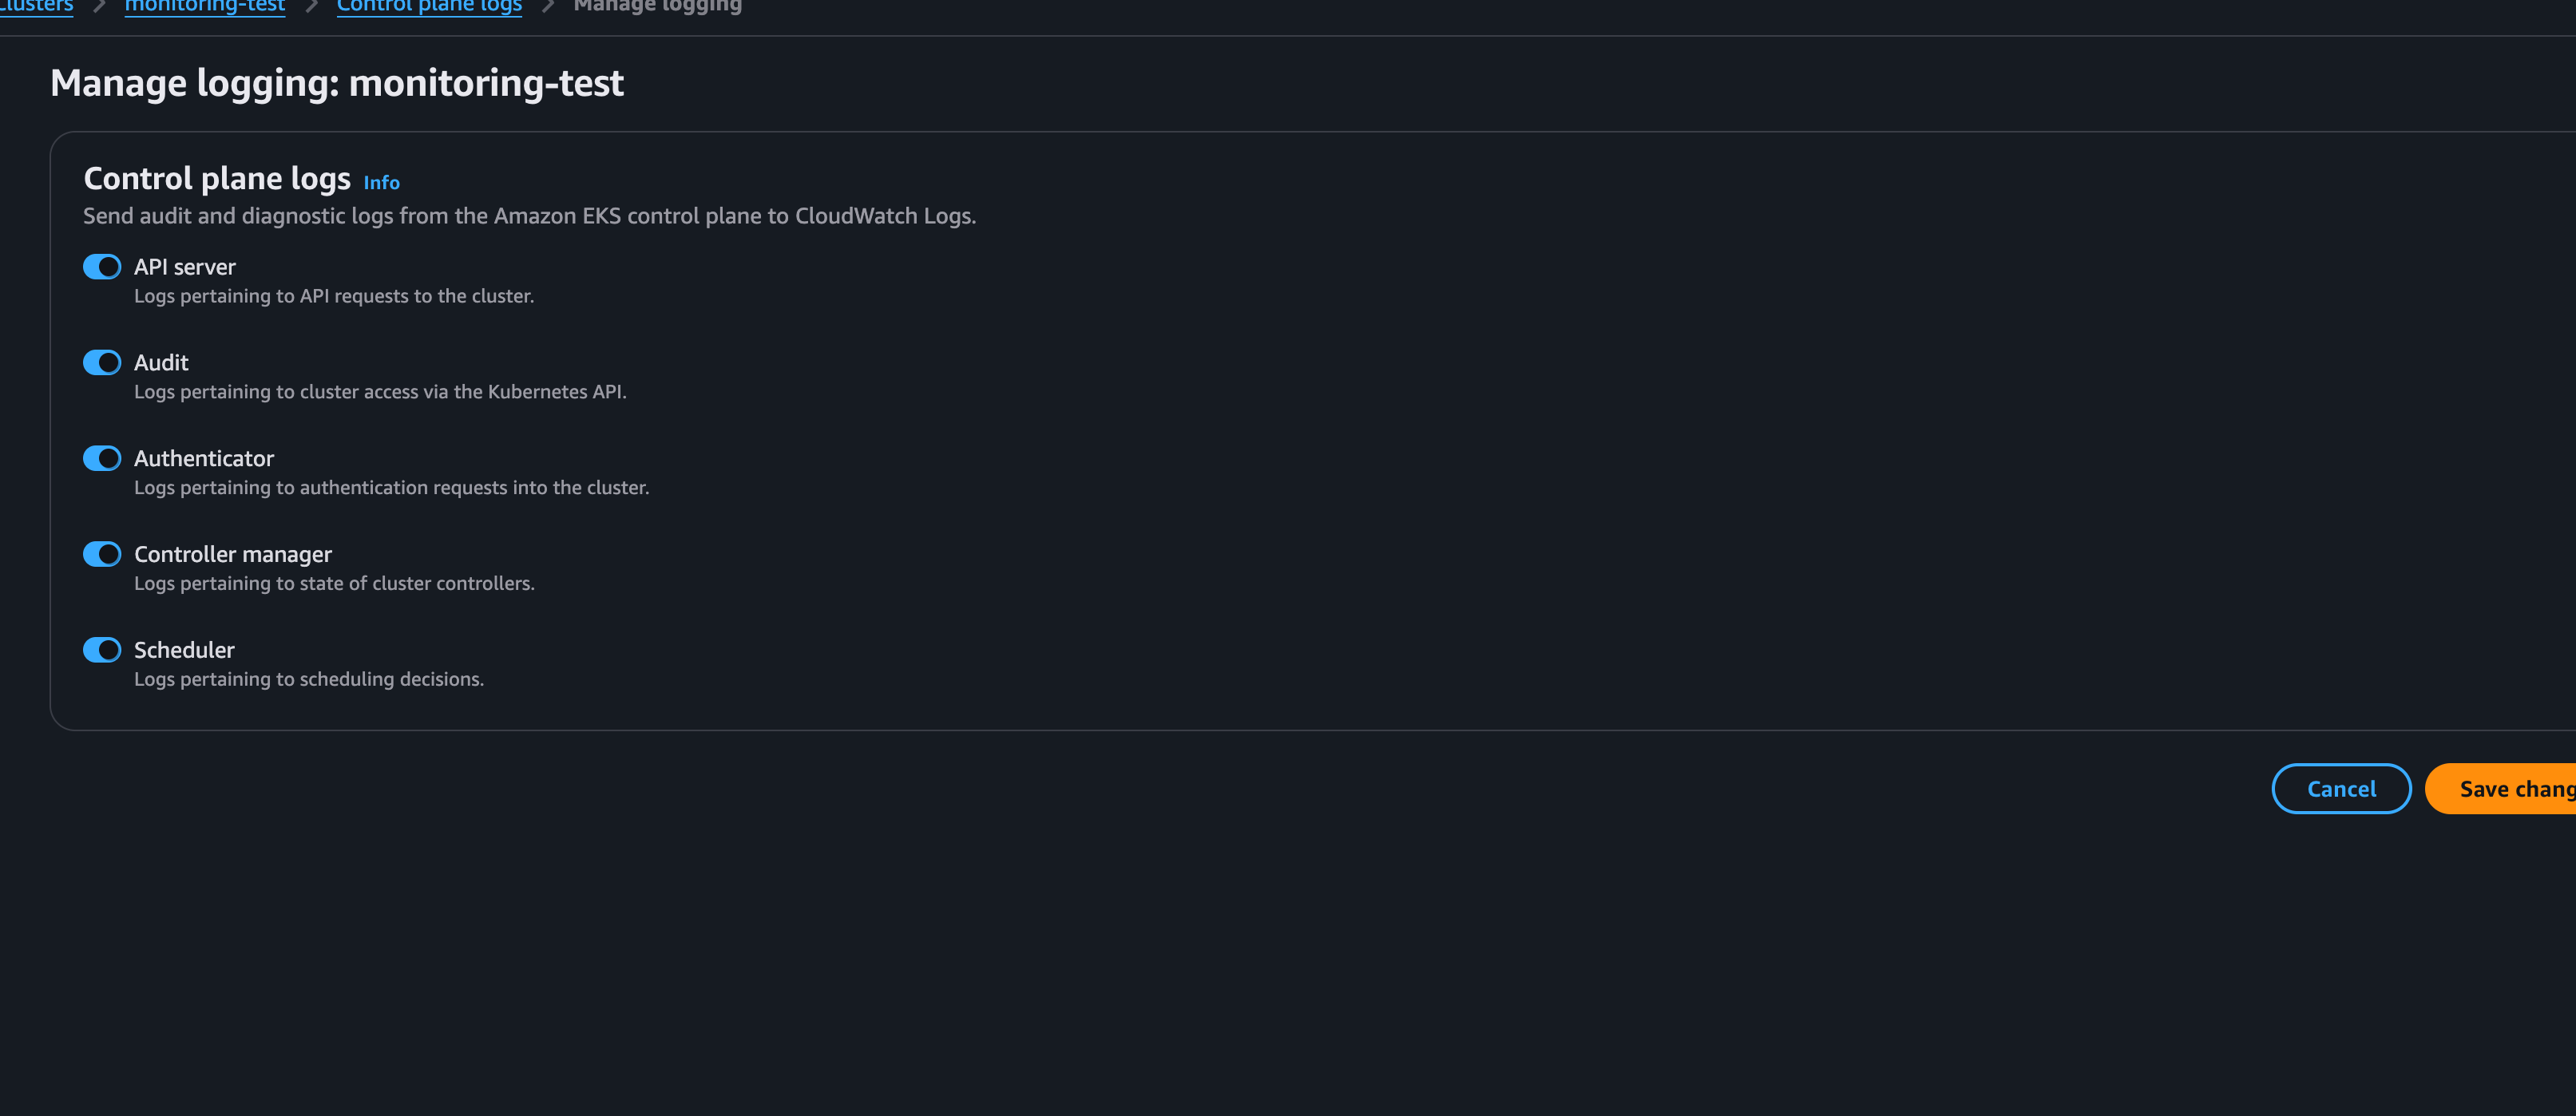
모든 로그를 활성화해주면
Kubernetes 너머의 eks cluster에 대한 로그도 확인할 수 있다.
Prometheus
프로메테우스는 모니터링을 위한 시계열 데이터베이스의 한 종류이다. Pull 방식으로 데이터를 수집하며 PromQL이라는 언어를 통해 데이터를 가져올 수 있다. 많은 서버 어플리케이션에 조합해서 사용할 수 있는데, 쿠버네티스와도 조합하여 모니터링 정보를 제공받을 수 있다.
프로메테우스를 사용하기 위해선 이전 글에서도 설치했던 metrics server를 설치해주어야 한다.
kubectl apply -f https://github.com/kubernetes-sigs/metrics-server/releases/latest/download/components.yaml그리고 프로메테우스 설치를 위한 namespace를 생성해준다.
kubectl create namespace prometheus그리고 프로메테우스를 helm을 통해 설치해준다.
# helm repository가 로컬에 없다면 설치
helm repo add prometheus-community https://prometheus-community.github.io/helm-charts

# prometheus 설치
helm upgrade -i prometheus prometheus-community/prometheus \
    --namespace prometheus \
    --set alertmanager.persistence.storageClass="gp2" \
    --set server.persistentVolume.storageClass="gp2"

# prometheus를 로컬에서 확인할 수 있도록 포트포워딩
kubectl --namespace=prometheus port-forward deploy/prometheus-server 9090
이 후에 localhost:9090 에 접근하면 프로메테우스에 접근할 수 있다.
나는 이 과정에서 추가적인 에러를 겪었는데, 프로메테우스 서버가 제대로 기동되지 않고 있었다. descibe pod 명령어를 통해 실행되지 않는 프로메테우스 서버의 파드를 검사해봤는데,
Type    Reason                Age                   From                         Message
  ----    ------                ----                  ----                         -------
  Normal  WaitForFirstConsumer  14m                   persistentvolume-controller  waiting for first consumer to be created before binding
  Normal  ExternalProvisioning  4m15s (x42 over 14m)  persistentvolume-controller  Waiting for a volume to be created either by the external provisioner 'ebs.csi.aws.com' or manually by the system administrator. If volume creation is delayed, please verify that the provisioner is running and correctly registered.
이런 에러가 나오고 있었다. 프로메테우스도 시계열 데이터베이스인지라 데이터를 로컬에 저장해야하는데, EC2의 볼륨에 접근할 권한이 없는 에러인것으로 생각했다.
# eksctl이 쿠버네티스에 접근할 수 있도록 oidc 허용
eksctl utils associate-iam-oidc-provider \
    --region ap-northeast-2 \
    --cluster monitoring-test \
    --approve

# EBS에 접근할 수 있는 권한을 생성
eksctl create iamserviceaccount \
  --name ebs-csi-controller-sa \
  --namespace kube-system \
  --cluster monitoring-test \
  --region ap-northeast-2 \
  --attach-policy-arn arn:aws:iam::aws:policy/service-role/AmazonEBSCSIDriverPolicy \
  --approve \
  --role-only \
  --role-name AmazonEKS_EBS_CSI_DriverRole

# EKS addon에 Role 추가
eksctl create addon \
  --name aws-ebs-csi-driver \
  --cluster monitoring-test \
  --region ap-northeast-2 \
  --service-account-role-arn arn:aws:iam::<여러분의 AWS ACCOUND_ID>:role/AmazonEKS_EBS_CSI_DriverRole \
  --force
위 명령어를 통해 프로메테우스가 정상적으로 노드의 볼륨에 접근할 수 있도록 권한을 주면 된다.
이제 9090 포트로 접근하면 프로메테우스를 정상적으로 사용할 수 있다.
Grafana
Grafana는 다양한 데이터를 시각화 해주는 플랫폼이다. Prometheus 자체로는 데이터를 한 눈에 알아보기 힘들기 때문에 일반적으로 Grafana와 조합해서 많이 사용한다.
먼저 grafana.yaml 이라는 이름의 파일을 작성해준다.
datasources:
  datasources.yaml:
    apiVersion: 1
    datasources:
    - name: Prometheus
      type: prometheus
      url: http://prometheus-server.prometheus.svc.cluster.local
      access: proxy
      isDefault: true
그리고 helm을 통해서 grafana를 설치해준다.
# helm 리포지토리 추가
helm repo add grafana https://grafana.github.io/helm-charts

# namespace 생성
kubectl create namespace grafana

# grafana 설치
helm install grafana grafana/grafana \
    --namespace grafana \
    --set persistence.storageClassName="gp2" \
    --set persistence.enabled=true \
    --set adminPassword='adminpassword' \
    --values grafana.yaml \
    --set service.type=LoadBalancer
위 커맨드로 설치가 완료되면 service의 type을 LoadBalancer로 주었기 때문에 EKS가 로드밸런서를 추가하여 grafana 대시보드를 웹에서 접속할 수 있도록 해준다.
웹 콘솔에서 로드밸런서의 DNS를 찾아서 접속하면 정상적으로 Grafana를 생성할 수 있는데, 위에서 설정한 비밀번호 adminpassword 로 로그인을 해준다. id는 admin이다.
Create Dashboard를 선택하고 import를 선택하면
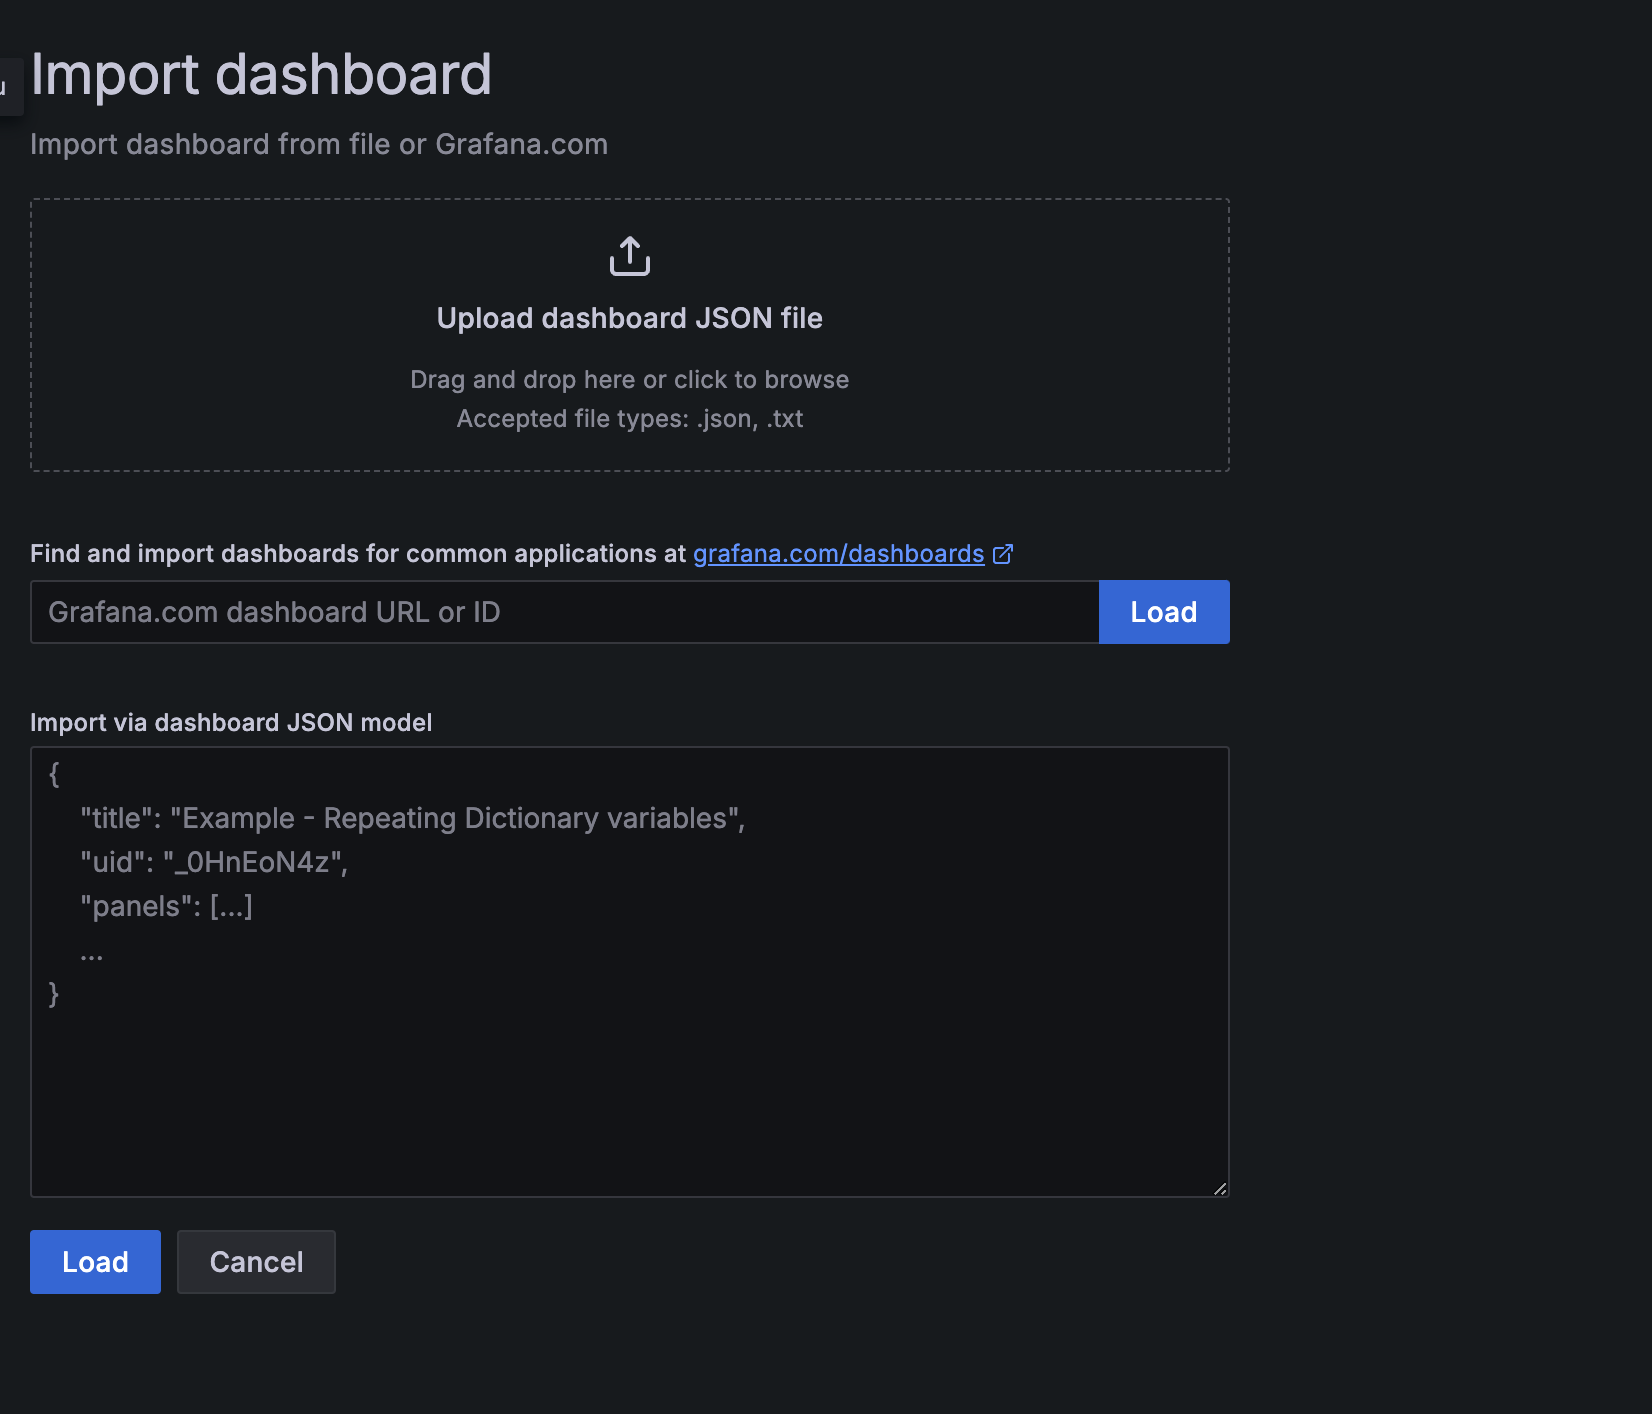
이렇게 대시보드를 가져올 수 있다. Dashboard id에 3119를 입력하고 대시보드를 생성하면
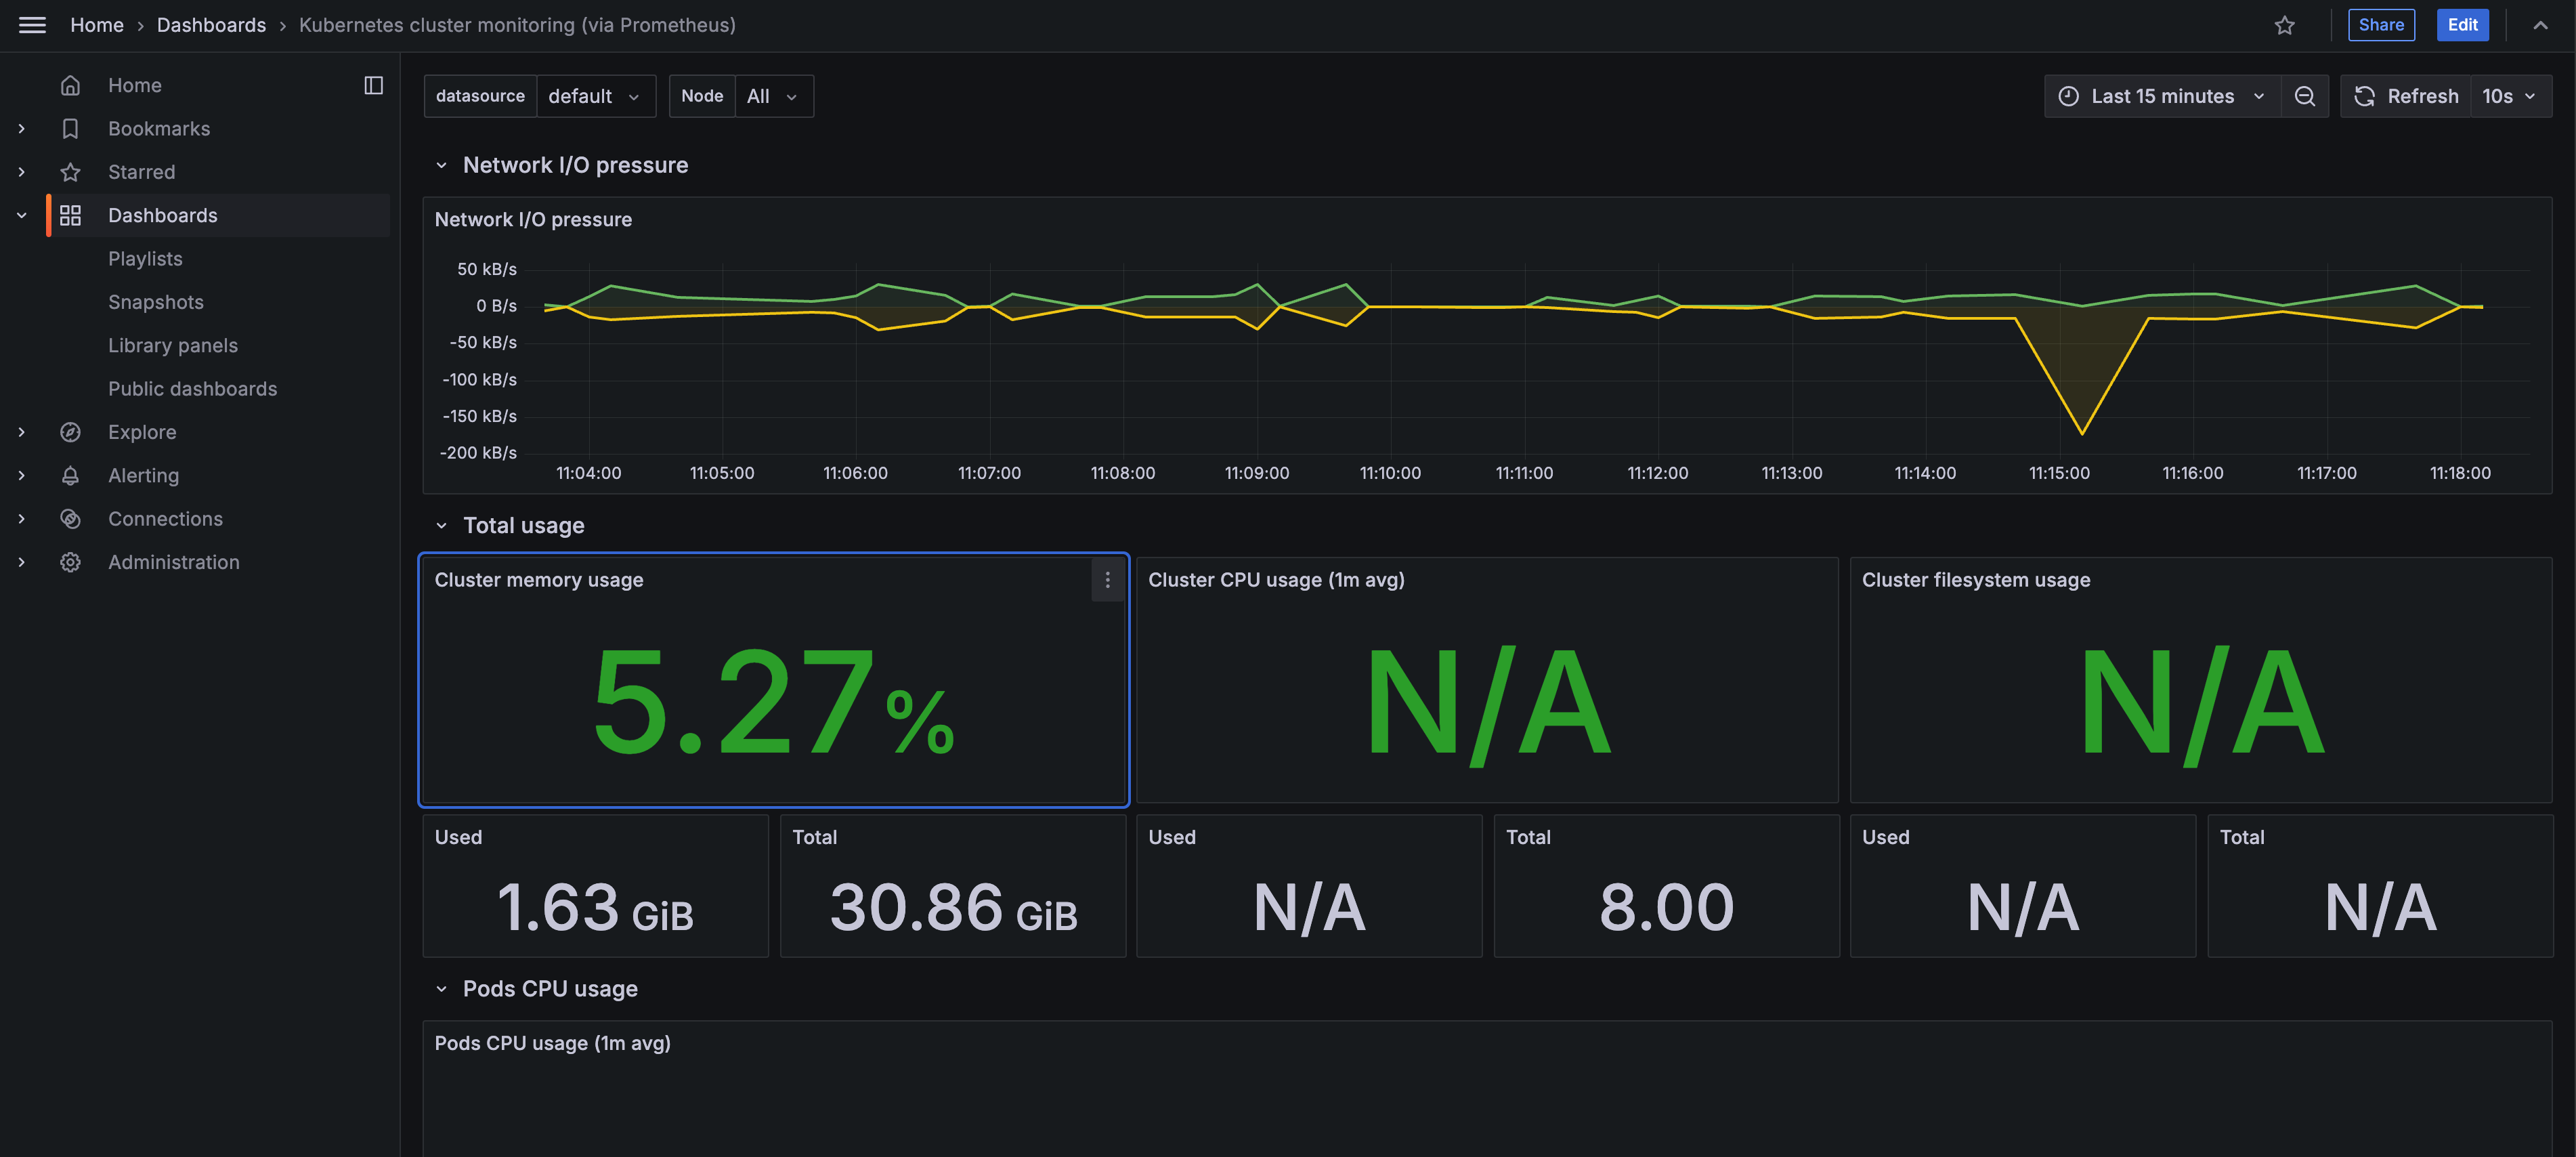
위와 같이 쿠버네티스의 클러스터를 모니터링할 수 있다. 그라파나 대시보드에 가면 다양한 대시보드가 있으니 필요한 대시보드를 찾아서 적용하면 된다.
참고
Fluent Bit를 DaemonSet로 설정하여 CloudWatch Logs에 로그 전송 - Amazon CloudWatch
https://docs.aws.amazon.com/eks/latest/userguide/prometheus.html
KubernetesMetrics 서버를 사용한 리소스 사용량 보기