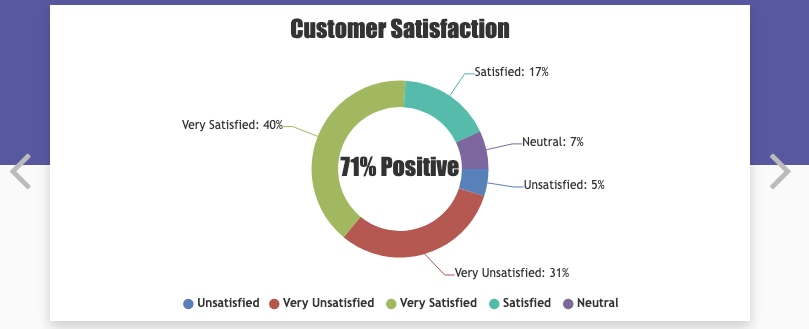
- 원형 그래프 만들고 싶어서 찾아보던중 발견함!
npm i canvasjs-react-charts
import {CanvasJSChart} from "canvasjs-react-charts"; //태그 작성시 자동으로 써짐
// CanvasJsChart를 이용한 원형그래프 시작
const options = {
animationEnabled: true,
title: {
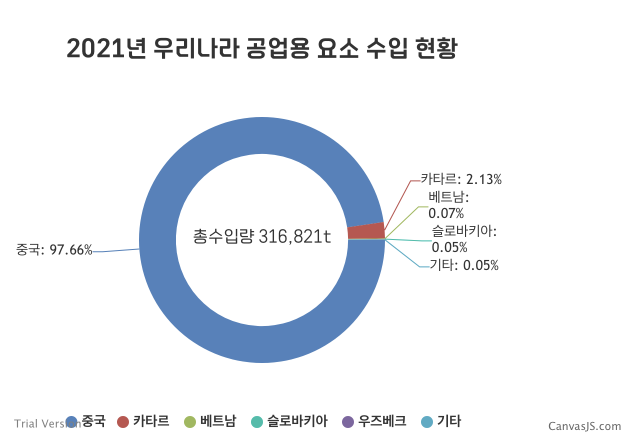
text: "2021년 우리나라 공업용 요소 수입 현황",
fontFamily: "EliceDigitalBaeum_Bold",
fontSize: 24
},
subtitles: [{
text: "총수입량 316,821t",
fontFamily: "EliceDigitalBaeum_Regular",
verticalAlign: "center",
fontSize: 17,
dockInsidePlotArea: true
}],
data: [{
type: "doughnut",
showInLegend: true,
indexLabel: "{name}: {y}",
yValueFormatString: "#,##0.##'%'", //소수점으로 표현하기위해 ##0을 적음
dataPoints: [
{ name: "중국", y: 97.66 },
{ name: "카타르", y: 2.13 },
{ name: "베트남", y: 0.07 },
{ name: "슬로바키아", y: 0.05 },
{ name: "우즈베크", y: 0.04 },
{ name: "기타", y: 0.05 }
]
}]
}
// CanvasJsChart를 이용한 원형그래프 끝
return (
<CanvasJSChart options = {options}/>
);

The future start today, not tomorrow !