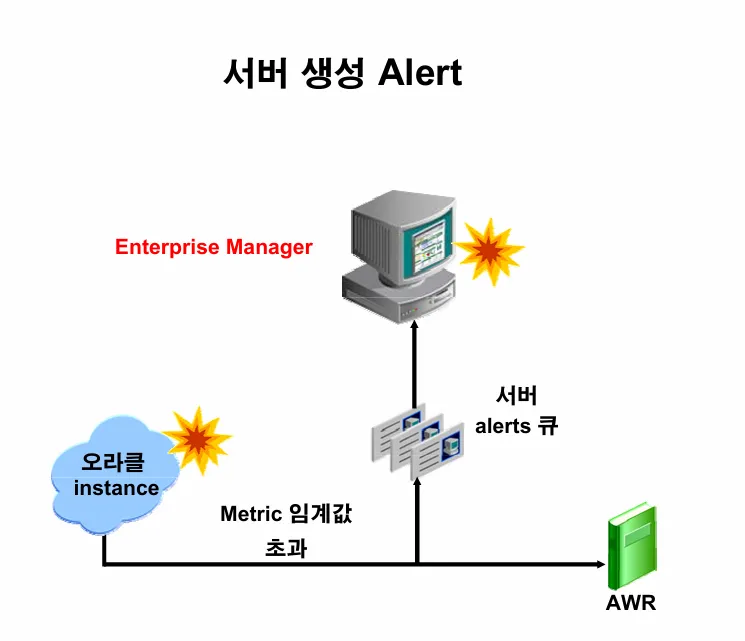
db에 문제가 생겼을 때 바로 그 문제를 확인할 수 있음
[실습1] 데이터베이스에서 발생한 이슈를 확인하시오
select *
 from dba_outstanding_alerts;
[실습2] ts50 이라는 테이블 스페이스를 하나 생성하고 이 테이블 스페이스에 공간이 100% full이 나게 데이터를 입력하시오
select file_name from dba_data_Files;

create tablespace ts50
  datafile '/home/oracle/ts50.dbf' size 10m;

drop table emp50;

create  table  emp50
( empno  number(10),
  ename  varchar2(10) )
 tablespace ts50;

insert into EMP50  values(1111,'aaa');

insert into emp50
select *
 from emp50;  -- 에러 날 때까지 반복하기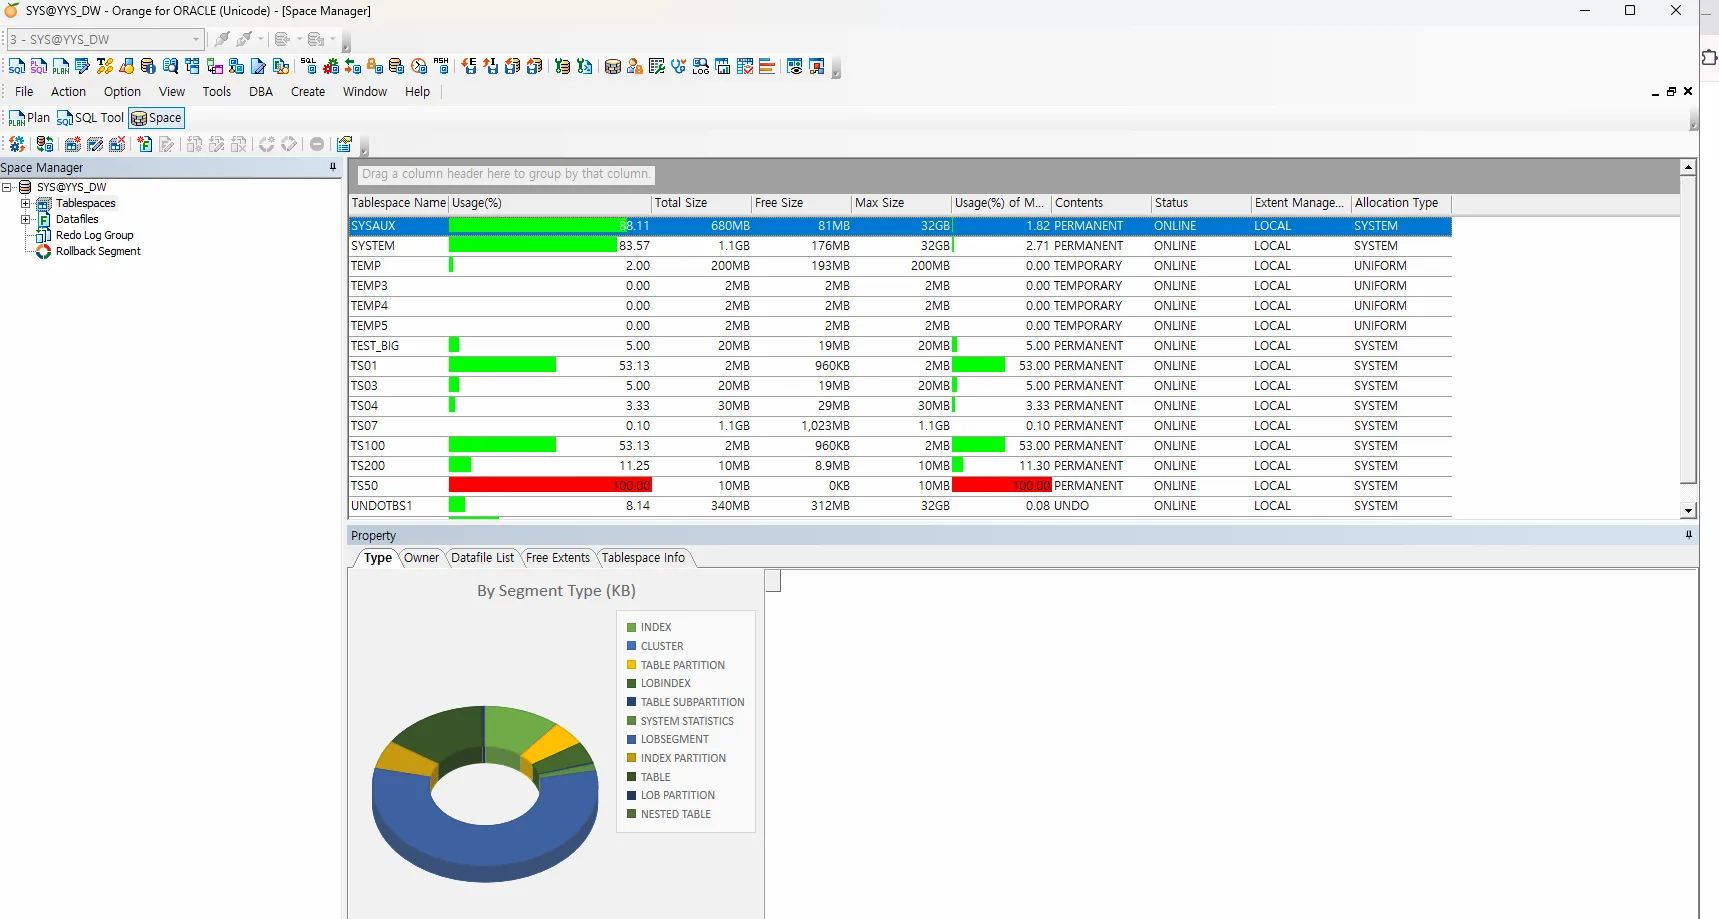
exec dbms_workload_repository.create_snapshot;

select * from dba_outstanding_alerts;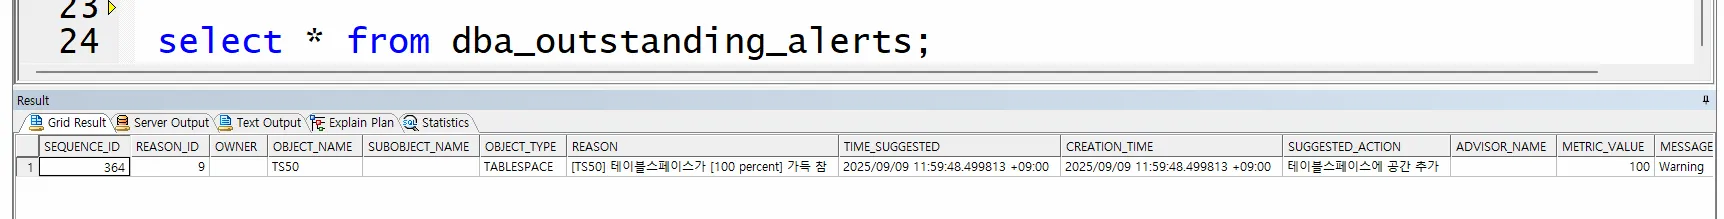
[실습3] tablespace 에 대한 사용량의 경고 메세지와 위기 메세지를 출력하는 임계치를 설정하시오
 select  *
 from  dba_thresholds
 WHERE warning_operator='GE';
--> 85%가 경고의 기준이고 97%가 위기 메세지의 기준임
[실습4] 위의 경고의 임계치와 위기의 임계치를 변경하시오
BEGIN
     DBMS_SERVER_ALERT.SET_THRESHOLD(
         metrics_id => DBMS_SERVER_ALERT.TABLESPACE_PCT_FULL,
         warning_operator => DBMS_SERVER_ALERT.OPERATOR_GE,
         warning_value => '20',
         critical_operator => DBMS_SERVER_ALERT.OPERATOR_GE,
         critical_value => '50',
         observation_period => 1,
         consecutive_occurrences => 3,
         instance_name => 'PROD',
         object_type => DBMS_SERVER_ALERT.OBJECT_TYPE_TABLESPACE,
         object_name => 'TS50'
      );
 END;
/


select reason, message_level from dba_outstanding_alerts;

truncate table emp50;

select * from dba_outstanding_alerts;

 select  *
 from  dba_thresholds
 WHERE warning_operator='GE';


select * from dba_outstanding_alerts;