plt.figure.add_subplot(row,col,index)
fig = plt.figure(figsize=(15,5))
ax1= fig.add_subplot(1,3,1)
ax1.plot(x,y)

ax2= fig.add_subplot(1,3,2)
ax2.bar(x,y)

ax3 = fig.add_subplot(1,3,3)
ax3.scatter(x,y)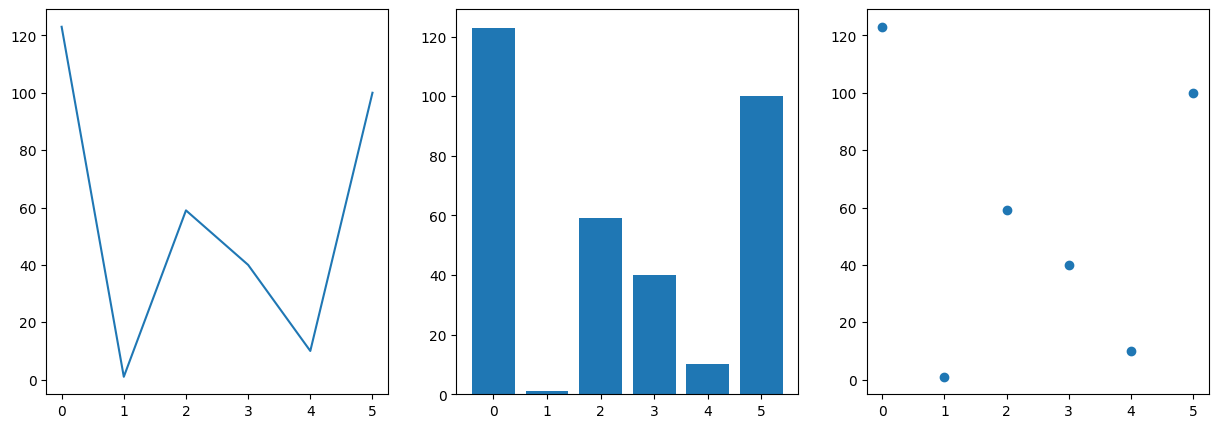
sns.kdeplot()
# seaborn.kdeplot(data=None, color=None, legend=True...)
sns.kdeplot(p['body_mass_g'],color='orange',shade=True)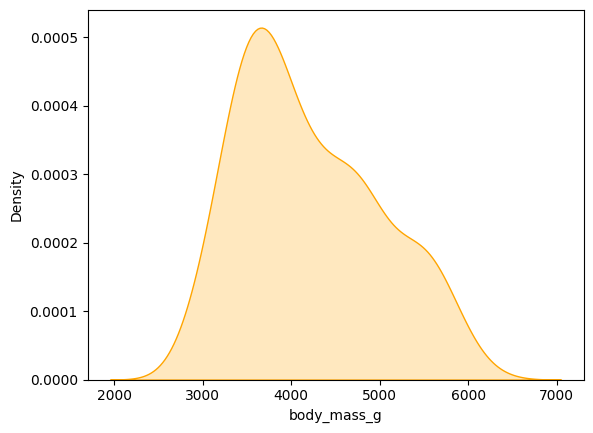
plt.xlabel, plt.ylabel
https://codetorial.net/matplotlib/set_label.html
https://zephyrus1111.tistory.com/215
import matplotlib.pyplot as plt
X = ["'Tom", "Amy", "Jim", "Bill", "Pegi"]
Y = [8, 23, 52, 37, 64]
font = {'color': 'gray',
         'weight': 'bold',
         'size': 14
         }

fig = plt.figure(figsize=(7,7), facecolor='black',edgecolor='lightgray')
plt.bar(X,Y,color = 'lightgray')

plt.xlabel('Salesperson',labelpad=12,fontdict=font)
plt.ylabel('Revenue (1000 s)',labelpad=12,fontdict=font)

plt.show()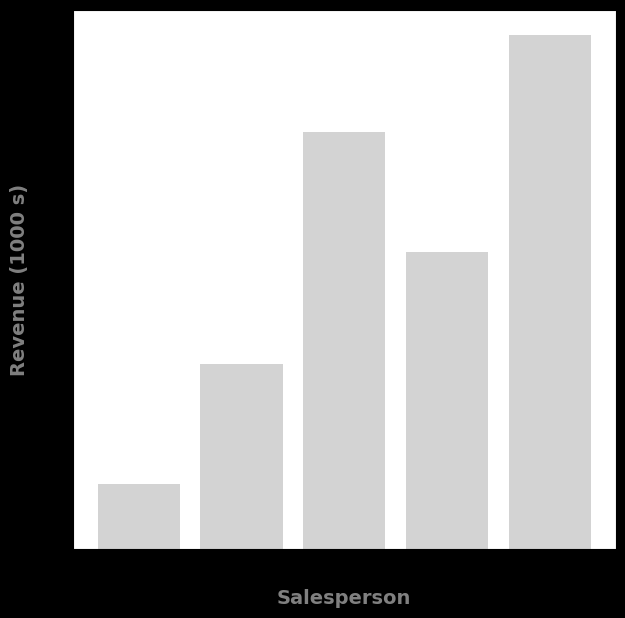
text, 가로선, 세로선
X = ["'Tom", "Amy", "Jim", "Bill", "Pegi"]
Y = [8, 23, 52, 37, 64]
font = {"color": "gray", "weight": "bold", "size": 14}
fig = plt.figure(facecolor="black", edgecolor="lightgray")
ax = fig.add_subplot(111)
ax.bar(X, Y, color="lightgray")
for i in range(len(Y)):
    rec = ax.patches[i]
    x = rec.get_x() + rec.get_width() / 2
    y = rec.get_height()
    ax.text(x, y, s=Y[i])
plt.xlabel("Salesperson", labelpad=12, fontdict=font)
plt.ylabel("Revenue (1000 s)", labelpad=12, fontdict=font)
plt.show()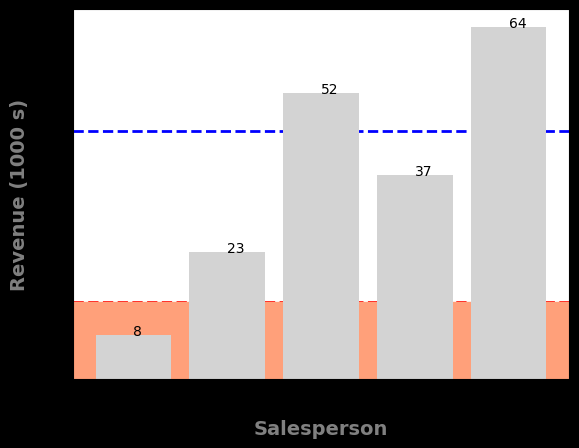

막상 하면 모르니까 일단 하자.