👉 Prometheus 적용
-
프로메테우스 설치
- 설치 사이트 : https://prometheus.io/download/
-
프로메테우스 폴더 내부에 있는 yaml 파일 설정
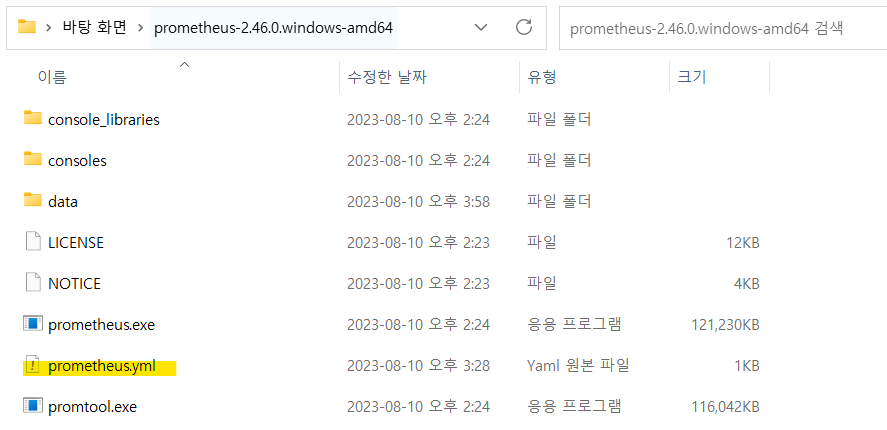
# my global config global: scrape_interval: 15s evaluation_interval: 15s # Alertmanager configuration alerting: alertmanagers: - static_configs: - targets: rule_files: scrape_configs: - job_name: "prometheus" static_configs: - targets: ["localhost:9090"] - job_name: "spring-actuator" # 아무거나 가능 metrics_path: '/actuator/prometheus' scrape_interval: 1s static_configs: - targets: [ 'localhost:8080' ] -
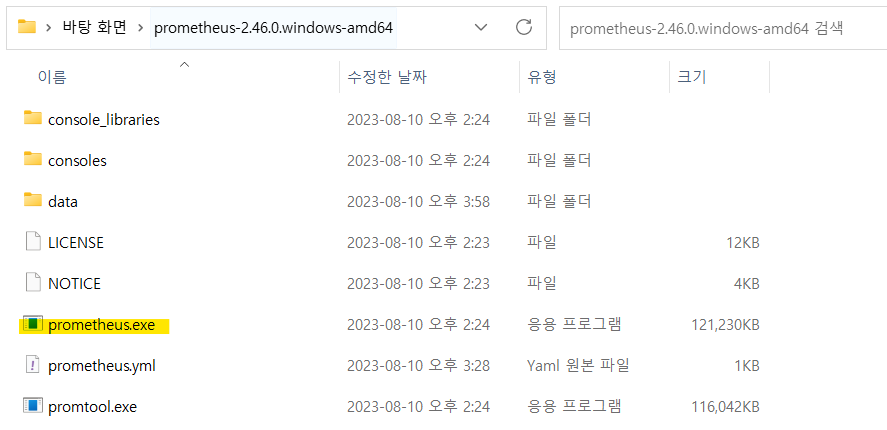
prometheus.exe로 프로메테우스 실행(터미널이 뜸)
-
SpringBoot 프로젝트에 의존성 추가 및 application.yaml 파일에 설정
implementation 'org.springframework.boot:spring-boot-starter-actuator' implementation 'io.micrometer:micrometer-registry-prometheus'management: endpoints: web: exposure: include: health, info, metrics, prometheus- include 부분은 Spring Boot Actuator의 웹 엔드포인트 중 어떤 것들을 외부에 노출할 것인지를 지정하는 설정
- prometheus
- Prometheus 스크레이퍼가 메트릭을 수집할 수 있도록 메트릭 정보를 제공
- health
- 애플리케이션의 건강 상태를 제공
- info
- 애플리케이션의 기본 정보를 제공
- prometheus
- include 부분은 Spring Boot Actuator의 웹 엔드포인트 중 어떤 것들을 외부에 노출할 것인지를 지정하는 설정
-
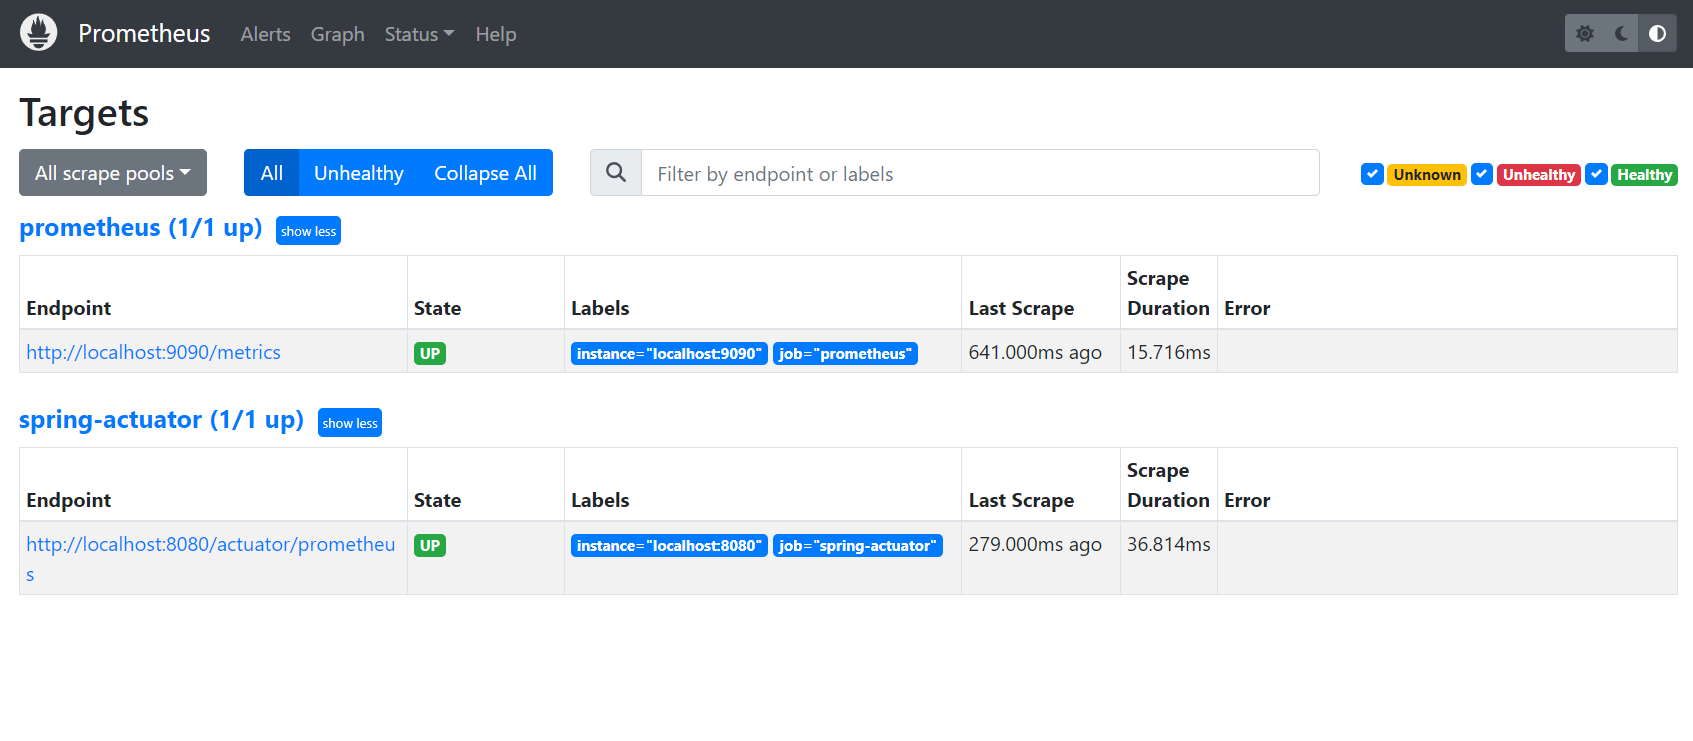
localhost:9090 들어가서 확인
- 프로메테우스 폴더 내부에 있는 yaml 파일에서 9090포트로 설정함(기본)
👉 Prometheus 적용 확인
- localhost:9090 들어가서 상단 메뉴 중 Status → Targets의 Endpoint 확인
👉 Grafana 적용
-
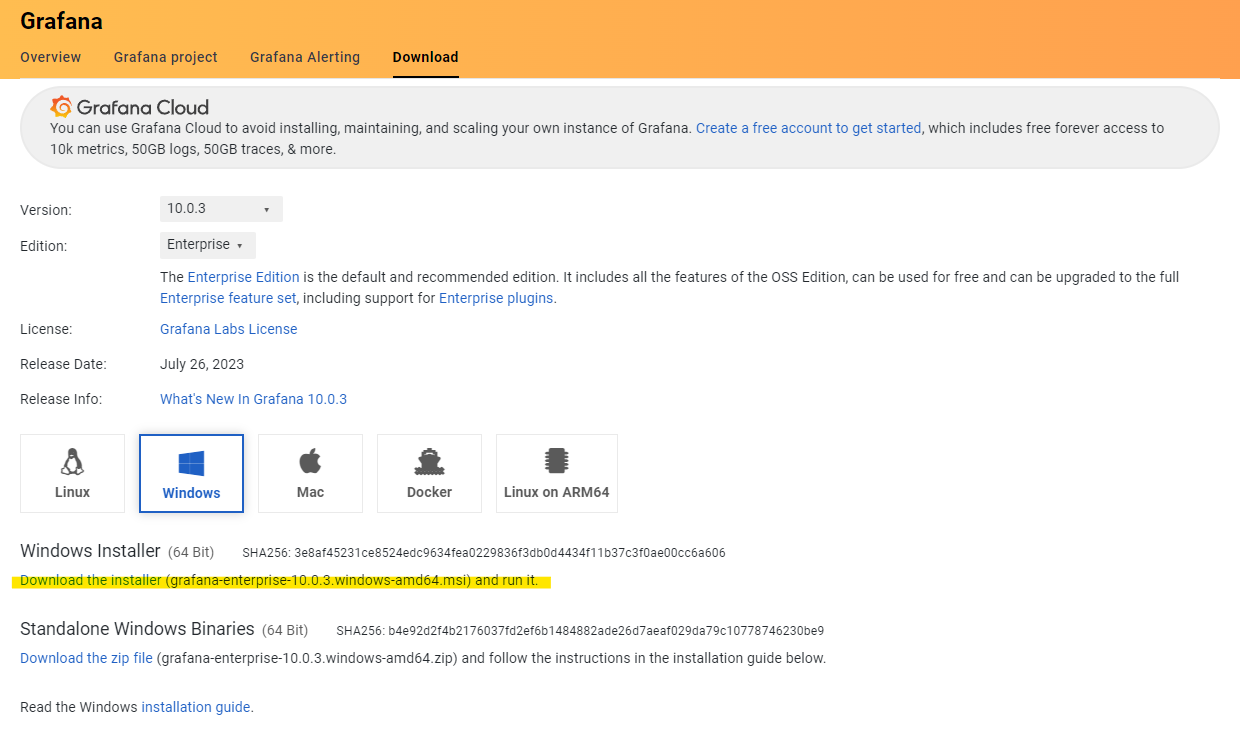
그라파나 설치
-
localhost:3000으로 그라파나 접속
- 초기 계정은 admin/admin
-
DATA SOURCES 추가(Add data source : http://localhost:3000/datasources/new) → Prometheus 클릭
-
HTTP 부분에 http://localhost:9090 입력 후 맨 아래 HTTP method가 POST인지 확인 → 하단 Save & test 버튼 클릭
-
대시 보드 추가
- 가운데 상단 검색창에 Import dashboard 검색
- 해당 페이지에서 Import via grafana.com에 4701 입력 → Load
- Name : JVM(Micrometer)
- 기본 값
- 맨 하단에 Prometheus에서 Prometheus 선택 후 Import
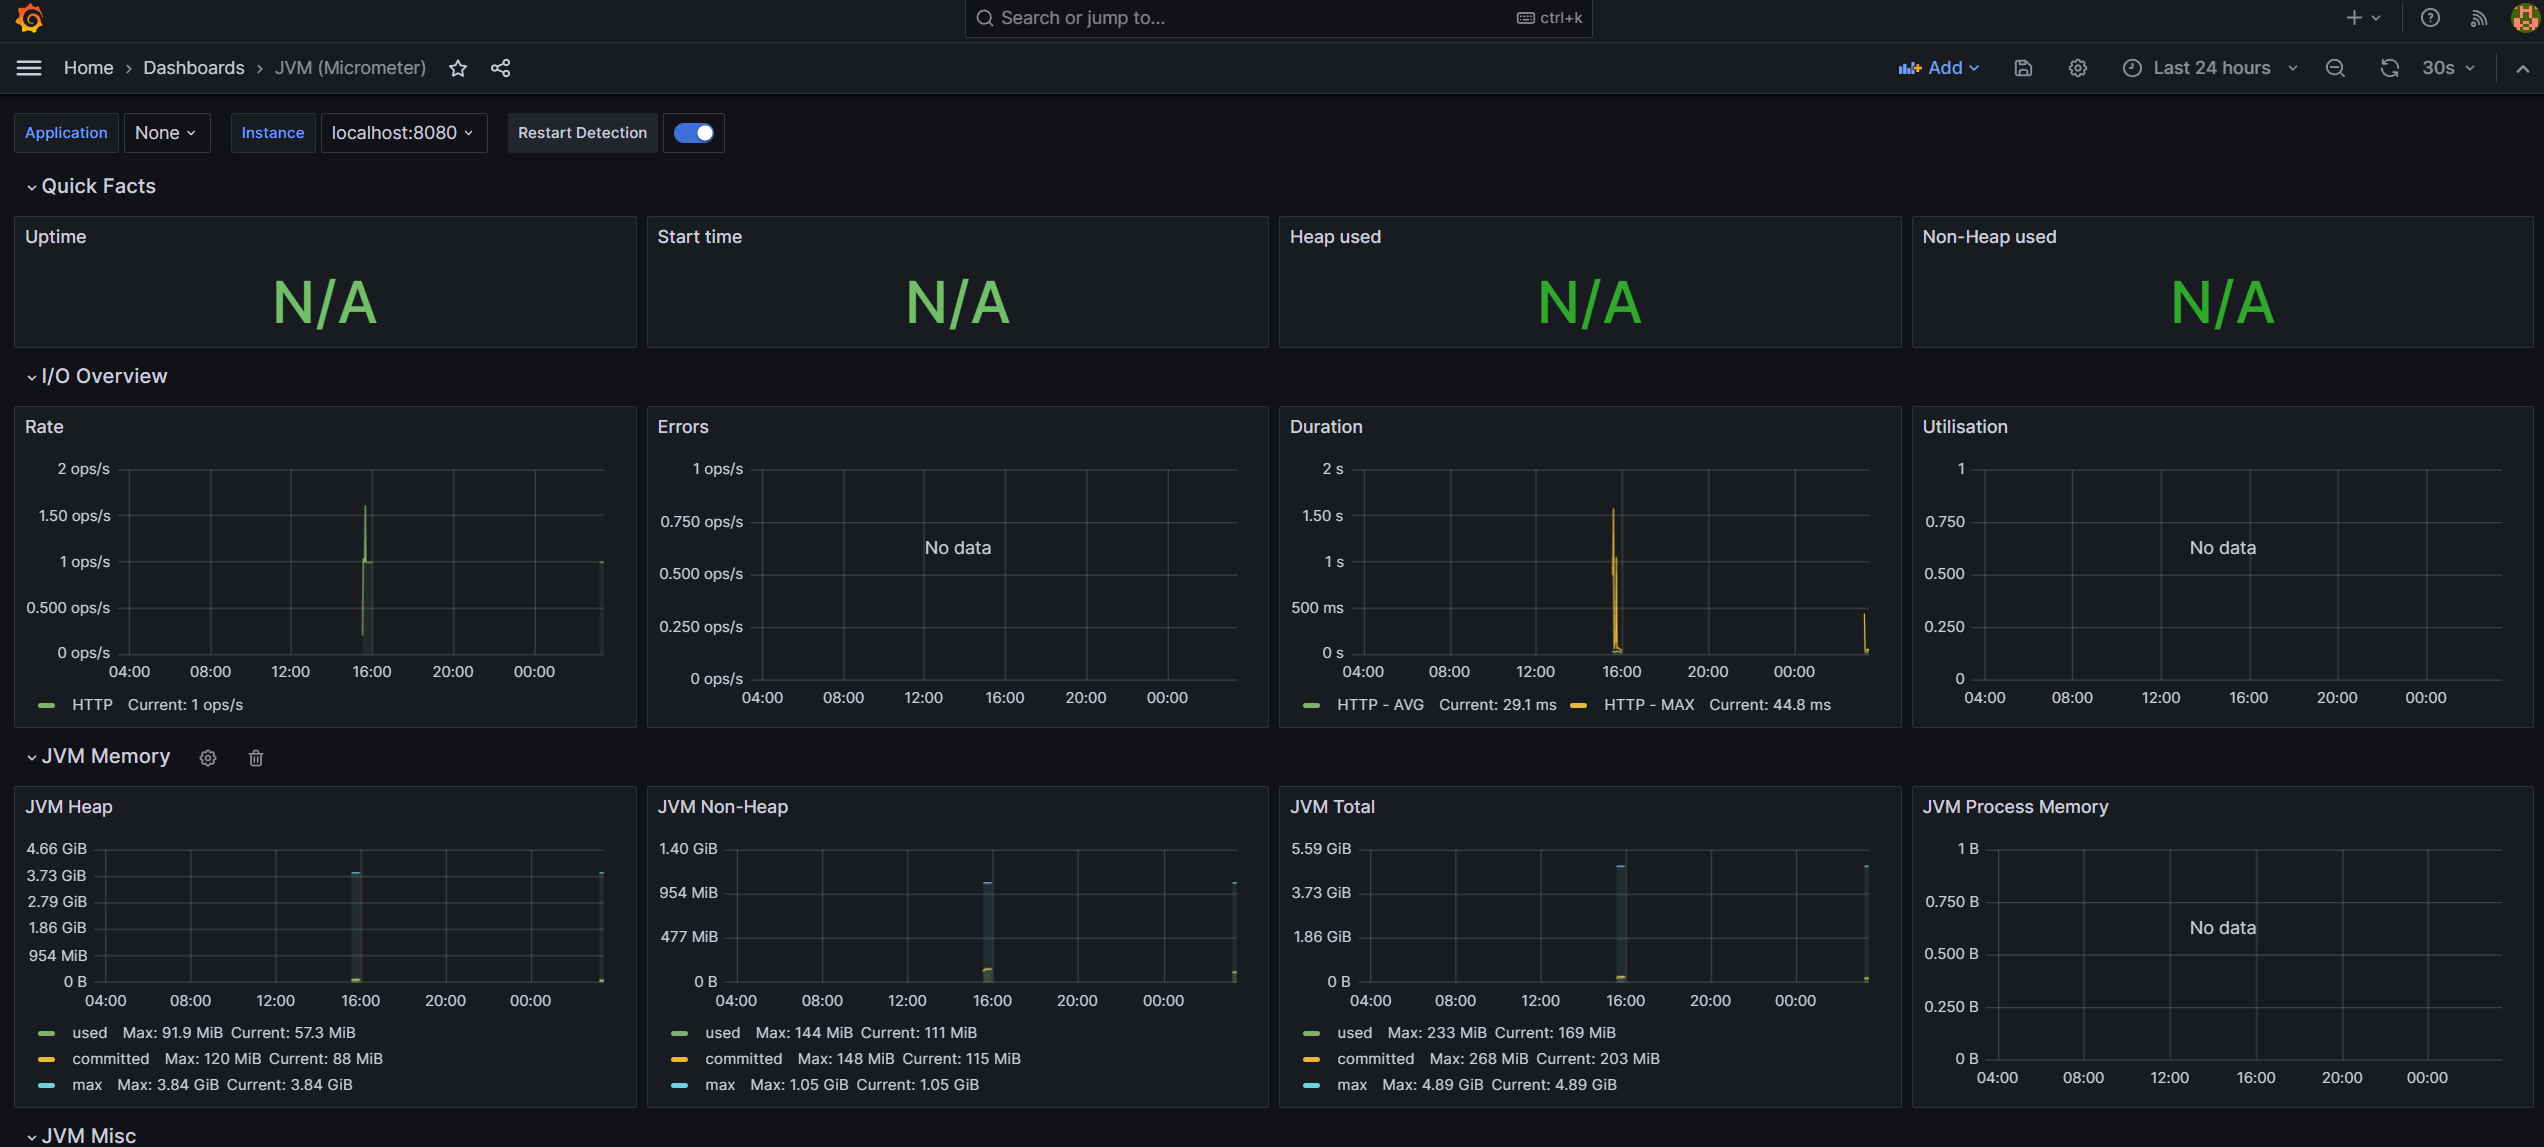
👉 Grafana 확인
- 대시보드
💻 참고 사이트 : Spring Boot | Prometheus + Grafana 모니터링 :: venh.log (tistory.com)

공부 중인 신입 백엔드 개발자입니다