6-1 Interactive Visualization
대표 python 라이브러리
- Plotly
- 통계, 지리, 3D, 금융 시각화 등 제공
- plotly.express: seaborn과 유사하게 사용가능
- D3기반
- Bokeh
- matplotlib 문법과 유사
- 기본 theme이 plotly에 비해 깔끔
- 비교적 문서화가 부족
- Altair
- Vega 라이브러리르 사용하여 만든 인터랙티브
- 문법이 pythonic하지 않음
- 데이터 크기 5000개 제한
- bar, line, scatter, histogram에 특화
6-2 Interactive Visualization 실습(colab)
plotly
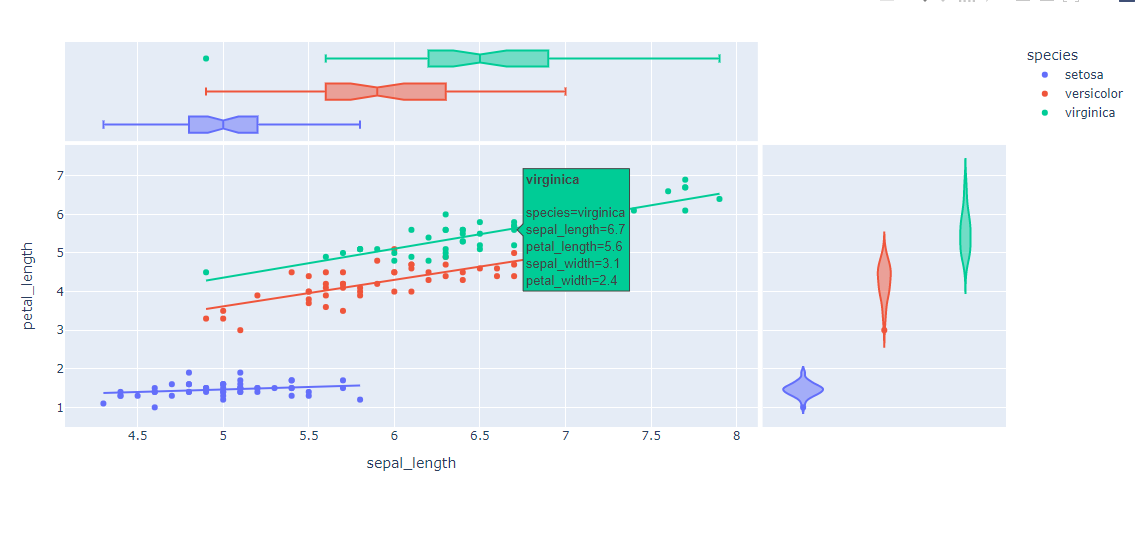
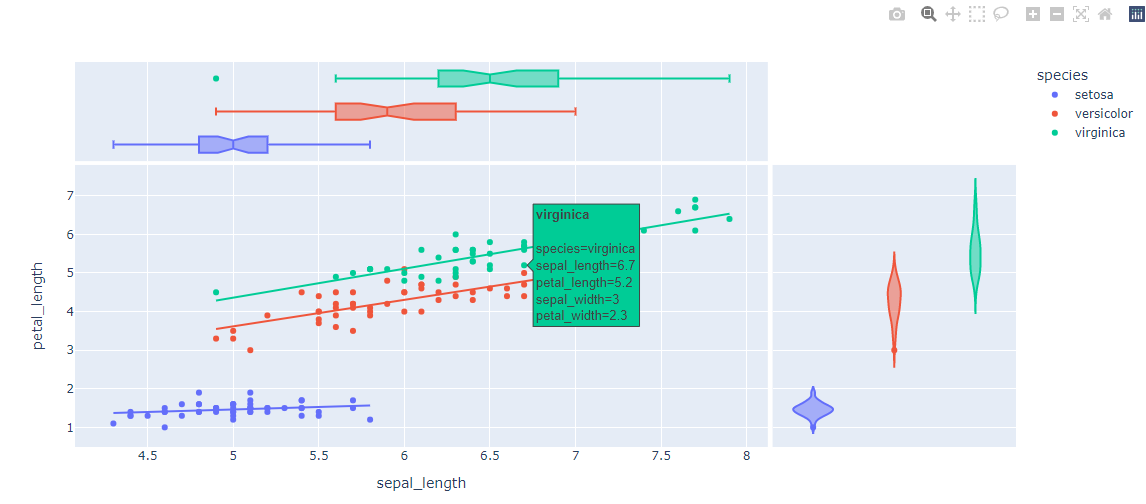
scatter
import plotly.express as px
fig = px.scatter(
    iris,
    x='sepal_length',
    y='petal_length',
    color='species',
    marginal_y="violin", # 오른쪽에 plot
    marginal_x="box",  # 위쪽에 plot
    hover_data=['sepal_width', 'petal_width'], #마우스 호버링 시 뜨는 값
    hover_name='species', # 마우스 호버링시 제목
    trendline="ols", #추세선
  #  facet_row='species', # facet grid기능
)
fig.show()
line
import plotly.express as px
fig = px.line(flights,
              x='year',
              y='passengers',
              color='month',
            )
fig.show()
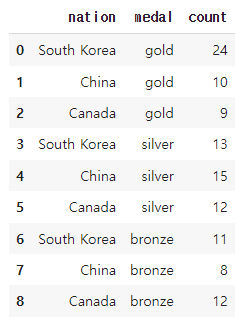
bar
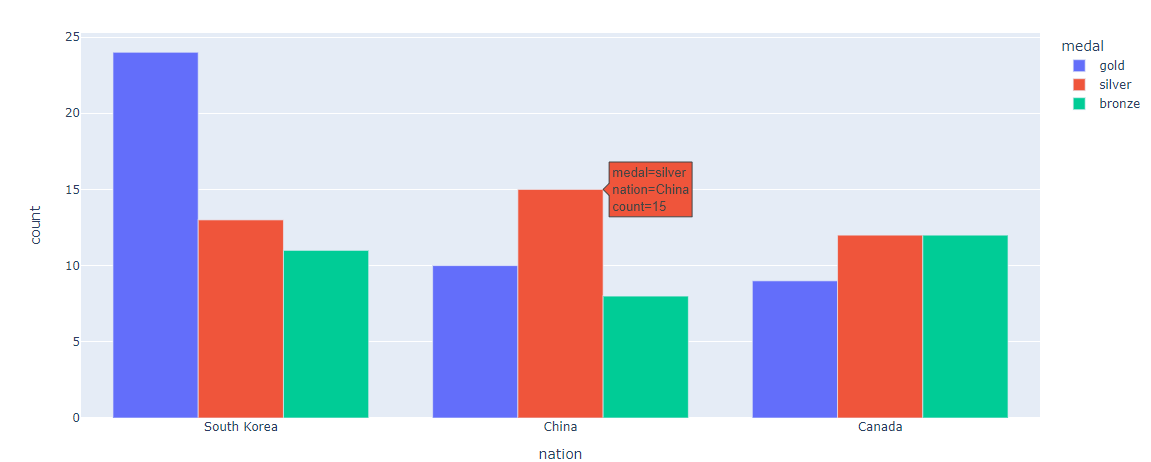
- case 1 - melt
fig = px.bar(medals,
             x="nation",
             y="count",
             color="medal")
fig.show()
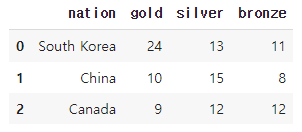
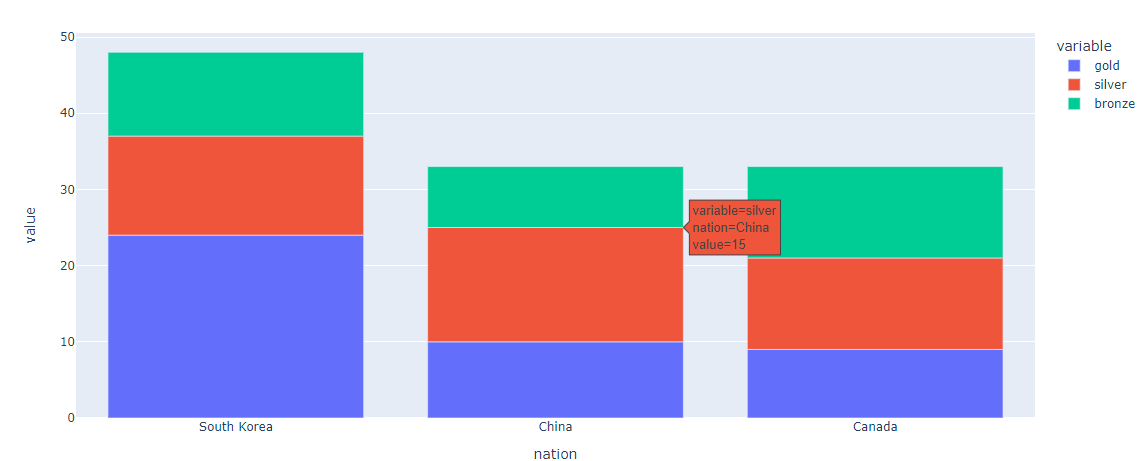
- case 2 - pivot
fig = px.bar(medals_wide,
           x="nation",
           y=["gold", "silver", "bronze"],
           )
fig.show()
- case 3 - group
fig = px.bar(medals,
           x="nation",
           y="count",
           color="medal",
           barmode="group",
          )
fig.show()
Part of Whole
- sunburst
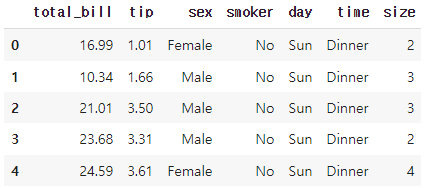
fig = px.sunburst(tips,
                path=['day', 'time', 'sex'], # 대, 중, 소 분류
                values='total_bill' # 그래프의 크기
                )
fig.show()
tree map
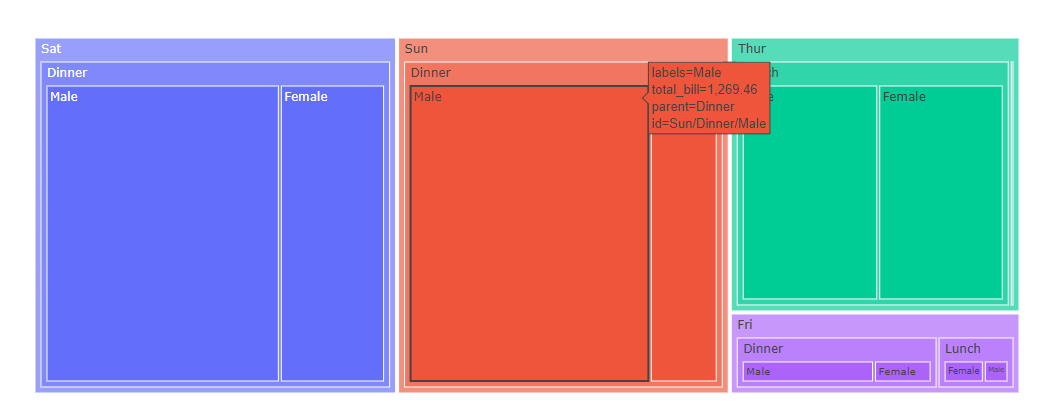
fig = px.treemap(tips,
                path=['day', 'time', 'sex'],
                values='total_bill')
fig.show()
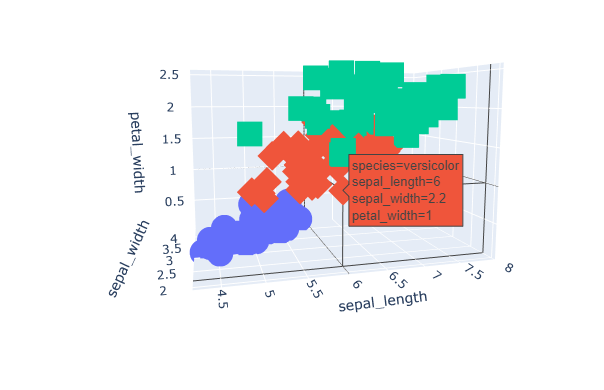
3-Dimensional
fig = px.scatter_3d(iris,
                    x='sepal_length',
                    y='sepal_width',
                    z='petal_width',
                    symbol='species', # 모양
                    color='species')
fig.show()
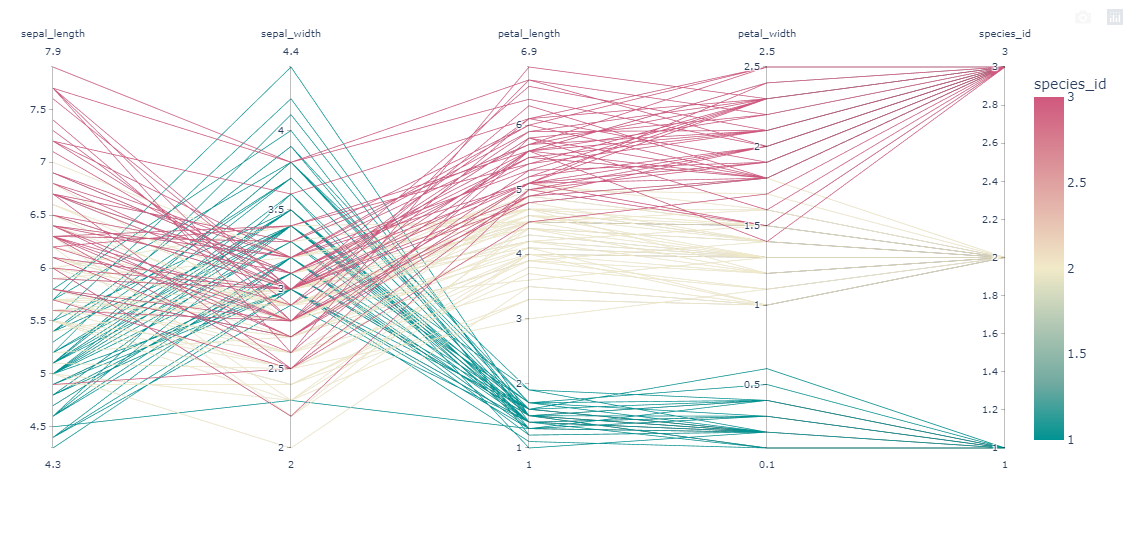
Multidimensional
parallel_coordinates - 연속형
fig = px.parallel_coordinates(iris,
                            color="species_id",
                           color_continuous_scale=px.colors.diverging.Tealrose,
                           )
fig.show()
parallel_categories - 이산형
tips = px.data.tips()
tips['color'] = tips['sex'].apply(lambda x : 'red' if x=='Female' else 'gray')
fig = px.parallel_categories(tips, color='color')
fig.show()
Geo
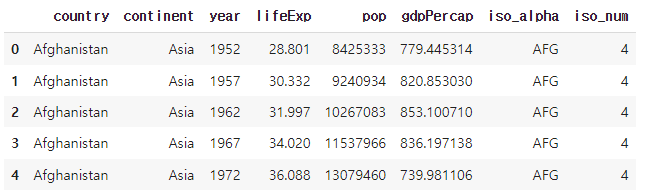
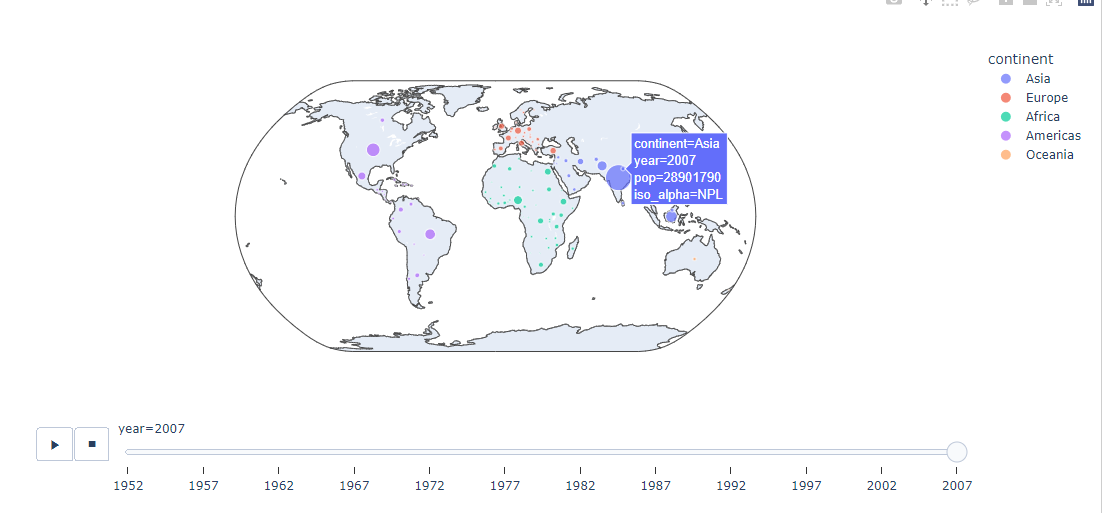
scatter_geo
fig = px.scatter_geo(geo,
                   locations="iso_alpha",
                   color="continent",
                   size="pop",
                   animation_frame="year",
                   projection="natural earth")
fig.show()
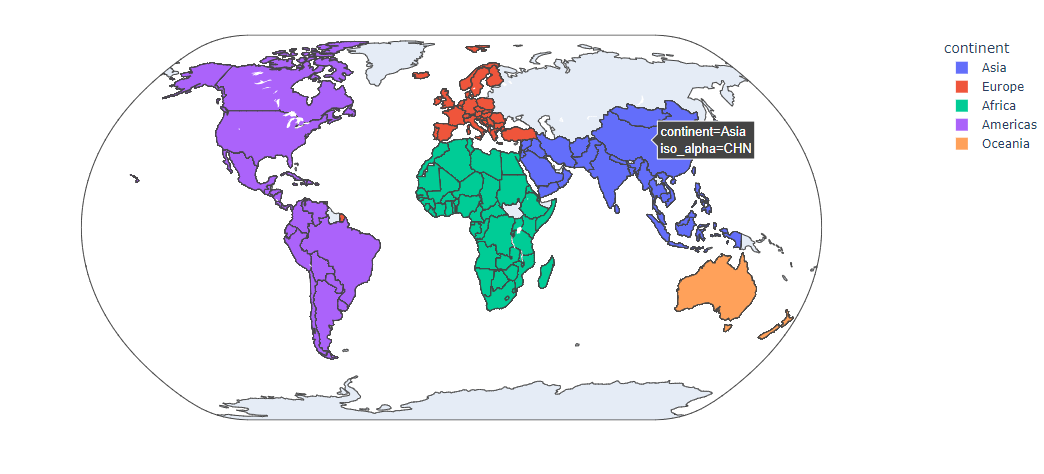
choropleth
fig = px.choropleth(geo,
                   locations="iso_alpha",
                   color="continent",
                   projection="natural earth")
fig.show()
그 외 시각화
html 저장
fig.write_html("path/to/file.html")


7-1 Custom Matplotlib Theme(colab)
- 애플 색 가이드라인(link)
raw_gray_dark_palette = [
    (142, 142, 147),# Gray
    (99, 99, 102),  # Gray (2)
    (72, 72, 74),   # Gray (3)
    (58, 58, 60),   # Gray (4)
    (44, 44, 46),   # Gray (5)
    (28, 28, 39),   # Gray (6)
]
gray_dark_palette = np.array(raw_gray_dark_palette)/255
sns.palplot(gray_dark_palette)

7-2 Image & Text Visualization Techniques(colab)
patch
import matplotlib.patches as patches
fig, ax = plt.subplots(1, 1, figsize=(5, 5))
ax.imshow(data[0].reshape(8, 8), cmap='gray_r')
# ax.axis('off')
rect = patches.Rectangle((1, 2),
                         3, 4,
                         linewidth=2, edgecolor='r', facecolor='red', alpha=0.3)
ax.add_patch(rect)
plt.show()

- dimention reduction method -차원축소방법
- UMAP(참고블로그)

인공지능 꿈나무