Matplotlib에서 Figure와 Axes 이해하기 (Basic)
Matplotlib이란?
- python에서 가장 보편화된, 기본적인 시각화 자료를 그릴 수 있게 도와주는 라이브러리
- 기본적으로
numpy와scipy라이브러리를 베이스로 합니다. - 덕분에 다른 라이브러리와 호환성이 매우 좋습니다. (범용성 최고)
Figure & Axes 개요
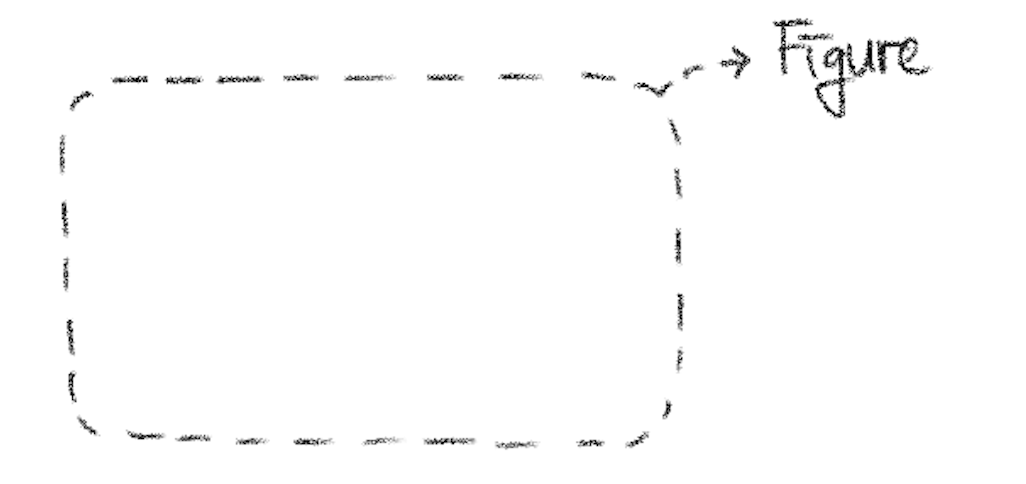
- Figure:
- 흔히들 그림을 그리기전 액자의 모양을 정하는 것이라고 합니다.
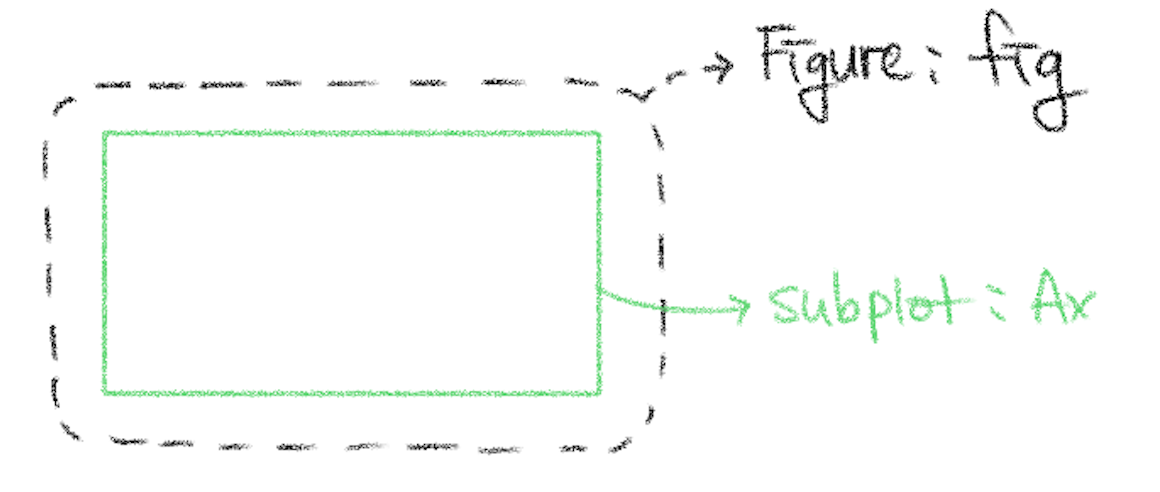
- 그림은 Figure(액자)에 바로 그려지는 것이 아닌, Ax(캔버스)에 그리게 됩니다.
- 이 캔버스가 들어갈 크기를 미리 정하는 겁니다.
- Ax:
- 액자의 크기가 정해졌으면, 이제 해당 액자 안에 캔버스가 몇 개들어가고, 어떻게 배치할지 정하면 됩니다.
- 실제로 우리가 표현하고자 하는 자료가 그려지는 장소입니다.
실습
먼저 라이브러리와 가장 많이 사용되는 모듈인 pyplot 모듈을 임포트해줍니다.
import numpy as np
import matplotlib as mpl
import matplotlib.pyplot as plt
figure 생성
fig = plt.figure()- fig라는 객체가 하나의 큰 figure(액자)가 되는 것입니다.

Axes 생성
fig = plt.figure()
ax = fig.add_subplot()fig라고 만들어놓은 Figure 객체 위에ax라는 작은 subplot을 그린다.

Figure 위에 여러개의 Subplot을 그리고 싶을 때
fig = plt.figure()
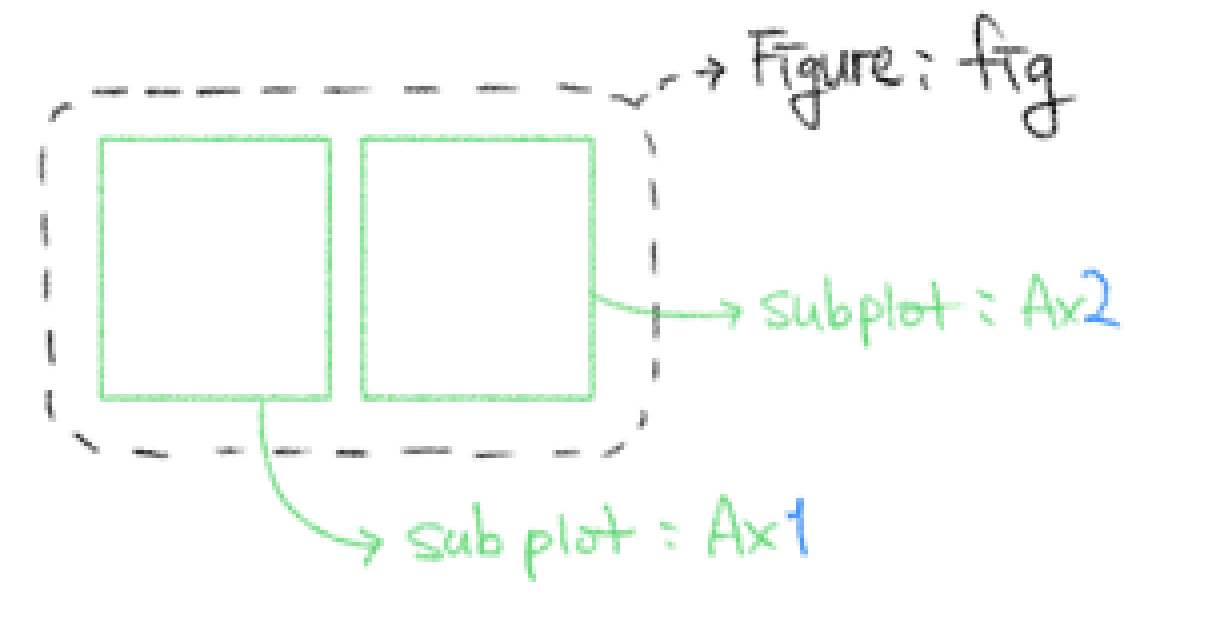
ax1 = fig.add_subplot(121)
ax2 = fig.add_subplot(122) - 121는 subplot의 위치가 1행 2열 배열에서 1번째라는 말이다.
- 122는 subplot의 위치가 1행 2열 배열에서 2번째라는 말이다.
- 121,122 와 같이 표현했지만 기본적으로, 1,2,1과 같이 입력하는것이 기본이다. (ex
fig.add_subplot(1,2,1))

Ax 위에 그림 그리는 방법
- pyplot API: 순차적 방법
plt(pyplot)은 기본적으로 그래프들을 순차적으로 입력받는다.- 이것을 순차적 방법이라고 한다.
- 객체 지향 방법
- Ax에 직접 그림을 그리는 방법
- pythonic code
-
순차적인 방법(code)
fig = plt.figure()

x1 = [1, 2, 3]
x2 = [3, 2, 1]

ax1 = fig.add_subplot(211)
plt.plot(x1)

ax2 = fig.add_subplot(212)
plt.plot(x2)
plt.show()
이렇게 되면, 순서대로 plt.plot을 통해서 그림을 그려주게 된다.
-
객체 지향 방법
fig = plt.figure()

x1 = [1, 2, 3]
x2 = [3, 2, 1]

ax1 = fig.add_subplot(211)
ax2 = fig.add_subplot(212)

ax1.plot(x1)
ax2.plot(x2)
plt.show()
이 방법은 그림을 어떤 Ax에 그릴지 확실하게 정해준다.
reference
- 안수빈님의 강의 https://subinium.github.io/
