💻 3차 프로젝트 소개
OneBook (Fin_Pong)
- OneBook 프로젝트는 가족들이 하나의 예산과 재정을 다같이 관리하는 가계부 서비스 입니다.
✅ 3차 프로젝트 목표
- 금융지식 부족으로 인한 불필요한 비용의 발생은 해마다 증가하는 추세, 이에 대비하여 가볍게라도 금융지식의 필요성을 어렸을때부터 자연스럽게 습득케 하고자 한 가족이 같이 사용할 수 있는 가족 단위의 가계부의 필요성을 느껴 기획하게 되었습니다.
✅ 서비스 목표 및 기대효과
- 자녀 : 돈의 가치 이해, 자발적인 용돈의 관리능력 증대
- 부모 : 재정 상황 파악, 상황에 맞는 계획적 소비 가능
- 가족 : 하나의 재정 목표설정, 가족 결속력 재고, 미래 계획 가능
🖥️ 프로젝트 시연영상
🖥️ Project Github 저장소
🛜 팀 프로젝트 기간 & 참여인원
- 날짜 : 2023년 11월 06일 ~ 2023년 11월 24일 (총 3주)
- 참여 인원 : 6명 (프론트엔드 3명, 백엔드 3명)
- 팀원 소개
Product Manager : 이새미(Front-End)
Project Manager : 홍영기(Back-End)
Front-End Teammate : 김성호, 황수현
Back-End Teammate : 최현수, 정원규
🛠️ 기술 Stack
-
Front-End Stack
React,Javascript,HTML,SCSS,Git & Github,Visual Studio Code -
Back-End Stack
Javascript,Node.js,Express,MySQL,Git & Github,Visual Studio Code -
Communication
Slack,Notion,Trello -
Design
Figma
💽 User Flow & ERD
(1) OneBook User Flow
- User Flow 이미지가 잘 보이지 않는 관계로 여기를 클릭하시면 정확한 확인이 가능합니다.
(2) OneBook ERD
- ERD의 구성은 다음과 같습니다.
✅ 구현 기능 선정
1) 필수 구현 List
- SNS(카카오) 로그인 및 회원가입 페이지
- 가족 생성 및 참여하기 모달창
- 메인 페이지 - 대시보드 & 매뉴바
- 예산 및 용돈 등록
- 수입/지출 테이블
- 설정 페이지
2) Front-End 기능 구현 파트
이새미(Product Manager)
- User Flow 제작
- 카카오 로그인 & 회원가입
- 가계부 조회 페이지 - 수입/지출 테이블
김성호(Teammate)
- 메인 페이지 - 대시보드(1년 수입/지출과 월별-카테고리별 현황 그래프)
- 메인 페이지 - 메뉴바
- 메인 페이지 - 가계부 참여 & 생성 모달창
황수현(Teammate)
- OneBook 레이아웃 디자인
- 가계부 설정 페이지 - 예산 등록하기
- 가계부 설정 페이지 - 용돈 등록하기
🙋🏻♂️ 맡은 역할(페이지 & 기능)
상세역할 : 프로젝트 개발 담당
- 메뉴바 : map 메서드를 활용하여 버튼 및 User 정보를 표시하는 매뉴바 개발
- 메인(대시보드) 페이지 : Rechart 라이브러리를 활용하여 수입/지출, 카테고리별 현황 그래프 개발
- 관리자 시점(가계부 참여 & 생성) : 가계부를 생성할 수 있는 생성하기 개발
- 참여자 시점(가계부 참여 & 생성) : 인증코드로 참여할 수 있는 참여하기 개발
1) 메인 페이지 - 매뉴바 & 매뉴바 버튼
import React, { useEffect, useState } from 'react';
import { useNavigate } from 'react-router-dom';
import API from '../../config';
import './MenuBar.scss';

const MenuBar = () => {
  // 페이지 이동
  const navigate = useNavigate();
  // 사용자 이름, 권한 상태 지정
  const [userName, setUserName] = useState('');
  const [userRole, setUserRole] = useState('');

  // 로고 클릭시 메인페이지로 이동
  const goToMain = () => {
    navigate('/main');
  };

  const TOKEN = localStorage.getItem('TOKEN') || '';

  // 로그아웃
  const logout = () => {
    localStorage.removeItem('TOKEN');
    localStorage.removeItem('userName');
    localStorage.removeItem('userRole');
    alert('로그아웃 되었습니다.');
    navigate('/login');
  };

  // 버튼 데이터
  const BUTTONS = [
    { text: 'Home', onClick: () => navigate('/main') },
    { text: '가계부 조회', onClick: () => navigate('/table') },
    { text: '가계부 설정', onClick: () => navigate('/setting') },
    { text: '금융상품 안내', onClick: () => {} },
    { text: '개인정보 수정', onClick: () => {} },
    { text: '로그아웃', onClick: logout, isRed: true },
  ];
  // 사용자 정보(이름, 권한)
  useEffect(() => {
    fetch(API.UserInfo, {
      method: 'GET',
      headers: {
        'Content-Type': 'application/json;charset=utf-8',
        authorization: `Bearer ${TOKEN}`,
      },
    })
      .then((response) => response.json())
      .then((data) => {
        setUserName(data.userName);
        setUserRole(data.userRole === 1 ? '관리자' : '참여자');
      })
      .catch((error) => {
        console.error('로그인 정보를 불러오는 중 에러:', error);
      });
  }, []);

  return (
    <div className="menuBarFrame">
      <div className="logoFrame">
        <img
          className="wonBookLogo"
          src="/../images/OneBook_Logo_Small.png"
          alt="WonBook 로고"
          onClick={goToMain}
        />
      </div>
      <div className="userInfoFrame">
        <p className="nameText">{userName}</p>
        <p className="adminText">{userRole}</p>
      </div>
      <div className="menuBarButtonFrame">
        <ul>
          {BUTTONS.map(
            (button, index) =>
              !(setUserRole === 0 && button.text === '가계부 설정') && ( //userRole이 0이면서, button.text가 가계부 설정이면 렌더링하지않음
                <li key={index} className="buttonList">
                  <button
                    className={`menuBarButton${button.isRed ? ' red' : ''}`}
                    onClick={button.onClick}
                  >
                    {button.text}
                  </button>
                </li>
              ),
          )}
        </ul>
      </div>
    </div>
  );
};

export default MenuBar;
- 메인 페이지에서 주로 사용되는 메뉴바 안에 메뉴바 버튼은 map 메서드를 활용하여 반복적으로 표시되는 UI를 하나로 처리했고, 상수 데이터 값들을 넣어 버튼에 들어갈 text, onClick 이벤트 발생시 navigate hook을 이용해 각각의 페이지로 이동할 수 있도록 구현하였습니다.
2) 메인 페이지 - 대시보드(1년 수입/지출 그래프, 월별 카테고리별 현황 원형차트)
(2-1) 대시보드(1년 수입/지출 그래프 & 월별 카테고리별 현황 원형차트)
	...생략...
    <div className="dashboardContainer">
        <div className="graphMain">
          <div className="graphBarChart">
            <p className="yearText">1년 수입/지출 비교</p>
            {yearlyData && <GraphBarChart data={yearlyData} />}
          </div>
          <div className="graphCirculChart" onClick={goToTable}>
            <p className="monthText">월별-카테고리별 현황(%)</p>
            {monthlyData && <GraphCircularChart data={monthlyData} />}
          </div>
        </div>
...생략...- GraphBarChart, graphCirculChart는 공용 컴포넌트로 재사용하여 대시보드에 import 해서 사용했습니다.
(2-2) 1년 수입/지출 그래프 - 막대그래프
import React from 'react';
import {
  BarChart,
  Bar,
  XAxis,
  YAxis,
  CartesianGrid,
  Tooltip,
  Legend,
} from 'recharts';

const GraphBarChart = ({ data }) => {
  const transformedData = [];

  for (let month = 1; month <= 12; month++) {
    const monthName = month + '월';
    const income = data.INCOME[monthName];
    const spending = data.SPENDING[monthName];

    const newData = {
      name: monthName,
      수입: income,
      지출: spending,
    };

    transformedData.push(newData);
  }

  const tickFormatY = (tickItem) => tickItem.toLocaleString();

  return (
    <BarChart
      width={580}
      height={280}
      data={transformedData}
      margin={{
        top: 25,
        right: 10,
        left: 40,
        bottom: 5,
      }}
    >
      <CartesianGrid strokeDasharray="3 3" />
      <XAxis dataKey="name" />
      <YAxis tickFormatter={tickFormatY} />
      <Tooltip />
      <Legend />
      <Bar
        dataKey="수입"
        fill="#8884d8"
        position="top"
        formatter={(value) => new Intl.NumberFormat('ko-KR').format(value)}
      />

      <Bar
        dataKey="지출"
        fill="#82ca9d"
        position="top"
        formatter={(value) => new Intl.NumberFormat('ko-KR').format(value)}
      />
    </BarChart>
  );
};

export default GraphBarChart;
- 해당 코드는 1년 수입/지출에 대한 데이터를 막대 그래프형으로 생성하는 컴포넌트를 정의하고 있으며, recharts 라이브러리를 사용하여 데이터를 시각적으로 표현해줍니다.
- 막대그래프 함수에 data를 prop으로 전달받고 이 data는 월별 수입과 지출 데이터를 포함하고 있습니다.
- Bar 컴포넌트에서 수입, 지출마다 막대 형식으로 데이터를 표시해주고 수입, 지출마다 색깔을 구분해서 data 마다 지정해주고 있습니다.
(2-3) 월별 카테고리별 현황 - 원형차트
import React, { useState, useEffect } from 'react';
import { PieChart, Pie, Cell, Tooltip, LabelList } from 'recharts';

const GraphCircularChart = ({ data }) => {
  const transformedData = [];
  // 월 데이터 변환 로직
  const [currentMonth, setCurrentMonth] = useState(getCurrentMonth());
  // 현재
  useEffect(() => {
    const interval = setInterval(() => {
      const newMonth = getCurrentMonth();
      if (newMonth !== currentMonth) {
        setCurrentMonth(newMonth);
      }
    }, 1000 * 60);

    return () => clearInterval(interval);
  }, [currentMonth]);

  function getCurrentMonth() {
    const currentDate = new Date();
    const month = currentDate.toLocaleString('default', { month: 'long' });
    return month;
  }

  data.forEach((item) => {
    let value = 0;
    if (item.spending !== '0%') {
      const percentage = parseInt(item.spending);
      value = Math.round((percentage / 100) * 100);
    }

    transformedData.push({
      name: item.category,
      value: value,
    });
  });

  // const total = data.reduce((acc, entry) => acc + entry.value, 0);

  return (
    <PieChart width={900} height={500}>
      <Pie
        data={transformedData}
        dataKey="value"
        isAnimationActive={true}
        cx={250}
        cy={140}
        innerRadius={45}
        outerRadius={110}
        fill="#82ca9d"
        paddingAngle={5}
        label
      >
        {transformedData.map((entry, index) => (
          <Cell key={`cell-${index}`} fill={COLORS[index % COLORS.length]} />
        ))}
        <LabelList
          dataKey="name"
          position="outside"
          content={(props) => {
            const { value, index } = props;
            const percent = data[index].spending;

            return (
              <g>
                <rect
                  x={465}
                  y={196 + index * 28}
                  width={20}
                  height={15}
                  fill={COLORS[index % COLORS.length]}
                />
                <text
                  x={500}
                  y={210 + index * 28}
                  fill={COLORS[index % COLORS.length]}
                  fontWeight="bold"
                  fontSize={18}
                >
                  {value} ({percent})
                </text>
                <text
                  x={255}
                  y={155}
                  textAnchor="middle"
                  fill="#333"
                  fontSize={24}
                  fontWeight="bold"
                >
                  {currentMonth}
                </text>
              </g>
            );
          }}
        />
      </Pie>
      <Tooltip />
    </PieChart>
  );
};

export default GraphCircularChart;

const COLORS = ['#0088FE', '#00C49F', '#FFBB28'];
- 해당 코드는 월별 카테고리별 현황 데이터를 원형 차트형으로 생성하는 컴포넌트를 정의하고 있으며, 막대그래프와 마찬가지로 recharts 라이브러리를 사용하여 데이터를 시각적으로 표현해줍니다.
- 원형차트 함수에 data를 prop으로 전달받고 이 data는 카테고리와 지출 비율 정보가 포함되어 있습니다.
- PieChart 에서 Pie 컴포넌트를 사용해 원형차트를 그려주고 있고 transformedData를 처음에 빈 배열로 할당되어 있지만 데이터로 활용할때, 각 항목의 비율에 따라 차트의 크기와 색상을 결정할 수 있도록 했습니다.
- 각 데이터 별로 구현된 차트에 마우스를 가져다 대면 Tootip 컴포넌트가 각 데이터 대한 정보를 보여주도록 구현했습니다.
3) 메인 페이지 - 가계부 생성 & 참여하기 모달창
import Modal from 'react-modal';
...생략...
// 모달창 닫기
const closeModal = () => {
setCurrentModal('');
resetInputStates();
};
// 입력 값 초기화(모달창 닫았을때)
const resetInputStates = () => {
setCheckedMenu('');
setInputValues(INITIAL_INPUT_VALUES);
setIsCompleteEnabled(false);
};
...생략...
...생략...
// input, selectBox 값 변경 여부
const handleInputChange = (fieldName, value) => {
if (fieldName === 'verifyInput') {
// 인증번호 입력값 업데이트
setVerifycationCode(value);
// 참여하기 체크박스가 활성화되면서 인증번호를 입력되면 완료 버튼 활성화
const isVerifycationCodeValid =
checkedMenu === 'partic' && value.length === 8;
setIsCompleteEnabled(isVerifycationCodeValid);
} else {
// 다른 필드의 입력값 업데이트
const updatedInputValues = { ...inputValues, [fieldName]: value };
setInputValues(updatedInputValues);
// 완료 버튼 활성화 여부 업데이트
const { divide, category, day, price, memo } = updatedInputValues;
setIsCompleteEnabled(divide && category && day && price && memo);
// 체크박스 클릭시 비활성화
if (
(fieldName === 'partic' && checkedMenu === 'partic') ||
(fieldName === 'creating' && checkedMenu === 'creating')
) {
resetInputStates();
}
}
};
...생략...
...생략...
<button
className="actionButton"
onClick={() => setCurrentModal('참여')}
>
참여 & 생성하기
</button>
<Modal
isOpen={currentModal === '참여'}
overlayClassName="overlay"
className="modal"
ariaHideApp={false}
>
<button className="closeBtn" onClick={closeModal}>
<img src="/../images/closeMark.png" alt="닫기버튼" />
</button>
<div className="mainFrame">
<div
className={`partic${checkedMenu === 'partic' ? ' selected' : ''}`}
onClick={() => {
if (checkedMenu === 'partic') {
setCheckedMenu('');
} else {
setCheckedMenu('partic');
}
}}
>
<input
className="clickBox"
type="checkbox"
checked={checkedMenu === 'partic'}
readOnly
/>
<p className="clickText">참여하기</p>
<span className="womanEmoji" role="img" aria-label="Emoji">
💁🏻♀️
</span>
<input
className="verifyInput"
type="text"
placeholder="인증번호를 입력해주세요"
maxLength={8}
disabled={checkedMenu !== 'partic'}
onClick={(event) => event.stopPropagation()}
onChange={(event) =>
handleInputChange('verifyInput', event.target.value)
}
/>
</div>
<div
className={`creating${
checkedMenu === 'creating' ? ' selected' : ''
}`}
onClick={() => {
if (checkedMenu === 'creating') {
setCheckedMenu('');
} else {
setCheckedMenu('creating');
}
}}
>
<input
className="clickBox"
type="checkbox"
checked={checkedMenu === 'creating'}
/>
<p className="creatingText">생성하기</p>
<span className="manEmoji" role="img" aria-label="Emoji">
🙋🏻♂️
</span>
<p className="settingText">설정페이지로 이동합니다.</p>
</div>
</div>
<div className="buttonFrame">
<button
className="completeButton"
disabled={!isCompleteEnabled}
onClick={handleComplete}
>
완료
</button>
</div>
</Modal>
...생략...- 가계부 참여/생성 하기 버튼을 누르면 setCurrentModal 함수가 동작하여 모달창이 '참여'로 설정하고, 해당 모달을 화면에 보여줍니다.
- 모달창이 열리면 참여하기, 생성하기 2가지 영역으로 나뉘어져 있습니다. 각 영역마다 체크박스와 텍스트로 구성되어 있으며, 클릭 시 해당 메뉴를 선택하거나 선택 해제할 수 있습니다.
- 관리자(부모) 시점으로 가계부를 생성할 경우 생성하기 영역을 누르면 밑에 있는 완료버튼이 활성화 되어 "설정페이지로 이동합니다" 라는 alert 알림을 확인후 가계부 설정페이지로 이동하여 가족 가계부를 새로 생성할 수 있게 됩니다.
- 참여자(자녀) 시점으로 가족 가계부에 참여할 경우 참여하기 영역을 클릭하고, 관리자로 부터 전달받은 인증코드를 입력창에 입력후에 완료버튼을 누르면 가계부에 참여할 수 있는 권한을 부여받을 수 있도록 했습니다.
(이때, 인증번호 입력창은 참여하기 영역을 클릭했을때 활성화 되도록 조건을 부여하였습니다.) - 개인정보 보호를 위해 닫기 버튼을 누르면 지금까지 입력했던 인증코드가 초기화 되도록 기능을 구현했습니다.
4) 메인 페이지 - 수입/지출 등록하기 모달창
import Modal from 'react-modal';

        ...생략...
		// 모달창 닫기
        const closeModal = () => {
          setCurrentModal('');
          resetInputStates();
        };
        // 입력 값 초기화(모달창 닫았을때)
        const resetInputStates = () => {
          setCheckedMenu('');
          setInputValues(INITIAL_INPUT_VALUES);
          setIsCompleteEnabled(false);
        };
        ...생략...

		...생략...
        <button
          className="actionButton"
          onClick={() => setCurrentModal('수입')}
        >
          수입/지출 등록하기
        </button>
        <Modal
          isOpen={currentModal === '수입'}
          overlayClassName="overlay"
          className="modal"
          ariaHideApp={false}
        >
          <button className="closeBtn" onClick={closeModal}>
            <img src="/../images/closeMark.png" alt="닫기버튼" />
          </button>
          <div className="requiredTextMain">
            <p className="divideText">구분</p>
            <p className="categoryText">카테고리</p>
          </div>
          <div className="divideFrame">
            <select
              className="selectBox"
              value={inputValues.divide}
              onChange={(event) =>
                handleInputChange('divide', event.target.value)
              }
            >
              {DIVIDE_LIST.map((divide, index) => (
                <option key={index}>{divide}</option>
              ))}
            </select>
            <select
              className="selectBox"
              value={inputValues.category}
              onChange={(event) =>
                handleInputChange('category', event.target.value)
              }
            >
              {CATEGORY_LIST.map((category, index) => (
                <option key={index}>{category}</option>
              ))}
            </select>
          </div>
          <div className="requiredTextMain">
            <p className="dayText">일자</p>
            <p className="priceText">금액</p>
          </div>
          <div className="divideFrame">
            <DatePicker
              className="selectBox"
              selected={inputValues.day}
              onChange={(date) => handleInputChange('day', date)}
              selectsEnd
              dateFormat="yyyy년MM월dd일"
              locale={ko}
            />
            <input
              type="text"
              className="priceInput"
              placeholder="금액을 입력해주세요"
              value={inputValues.price}
              onChange={(event) => {
                const onlyNumbers = event.target.value.replace(/[^0-9]/g, '');
                handleInputChange('price', onlyNumbers);
              }}
            />
          </div>
          <div className="memoTextMain">
            <p className="memoText">메모</p>
          </div>
          <div className="divideFrame">
            <input
              className="memoInput"
              type="text"
              maxLength={25}
              placeholder="25자 내로 작성해주세요"
              value={inputValues.memo}
              onChange={(event) =>
                handleInputChange('memo', event.target.value)
              }
            />
          </div>
          <div className="yearTextMain">
            <p className="yearText">반복 종료 년/월</p>
            <p className="optionalText">선택 입력</p>
          </div>
          <div className="divideFrame">
            <select className="selectBox">
              {YEAR_LIST.map((year, index) => (
                <option key={index}>{year}</option>
              ))}
            </select>
            <select className="selectBox">
              {MONTH_LIST.map((month, index) => (
                <option key={index}>{month}</option>
              ))}
            </select>
          </div>
          <div className="buttonFrame">
            <button
              className="completeButton"
              disabled={!isCompleteEnabled}
              onClick={goToIncomeExpend}
            >
              완료
            </button>
          </div>
        </Modal>
...생략...- 수입/지출 등록하기 버튼을 누르면 setCurrentModal 함수가 동작하여 모달창이 '수입'으로 설정한뒤, 해당 모달을 화면에 보여줍니다.
- 모달창에는 수입 또는 지출에 대해 나눌 수 있는 구분 영역, 생활비와 공과금에 대한 내용을 구분하는 카테고리 영역, DatePicker 컴포넌트에 구현된 캘린더가 나와 년, 월, 일을 선택할수 있는 일자 영역, 얼마정도의 수입이 들어왔고 지출이 나갔는지 금액을 작성할 수 있는 금액영역, 수입/지출에 대한 메모를 할수 있는 메모영역 총 5가지로 구성했습니다. 5가지 영역은 수입/지출에 있어 사용자가 필수로 입력해야만 내역을 등록할 수 있도록 설계했습니다.
- 5가지 영역에 내용을 모두 입력했을때 완료버튼이 활성화 될수 있도록 했으며, 가계부 정보와 개인정보 보호를 위해 모달창을 종료했다가 다시 수입/지출하기 버튼을 누르면 작성된 정보가 모두 초기화 될 수 있도록 구현했습니다.
✅ 팀 프로젝트간 협업의 중요성
-
OneBook 팀원들과 소통하는데 사용했던 Slack 채널 방


-
Front-End & Back-End 간의 티켓 분배 상태들을 관리하는 Trello 협업 툴
-
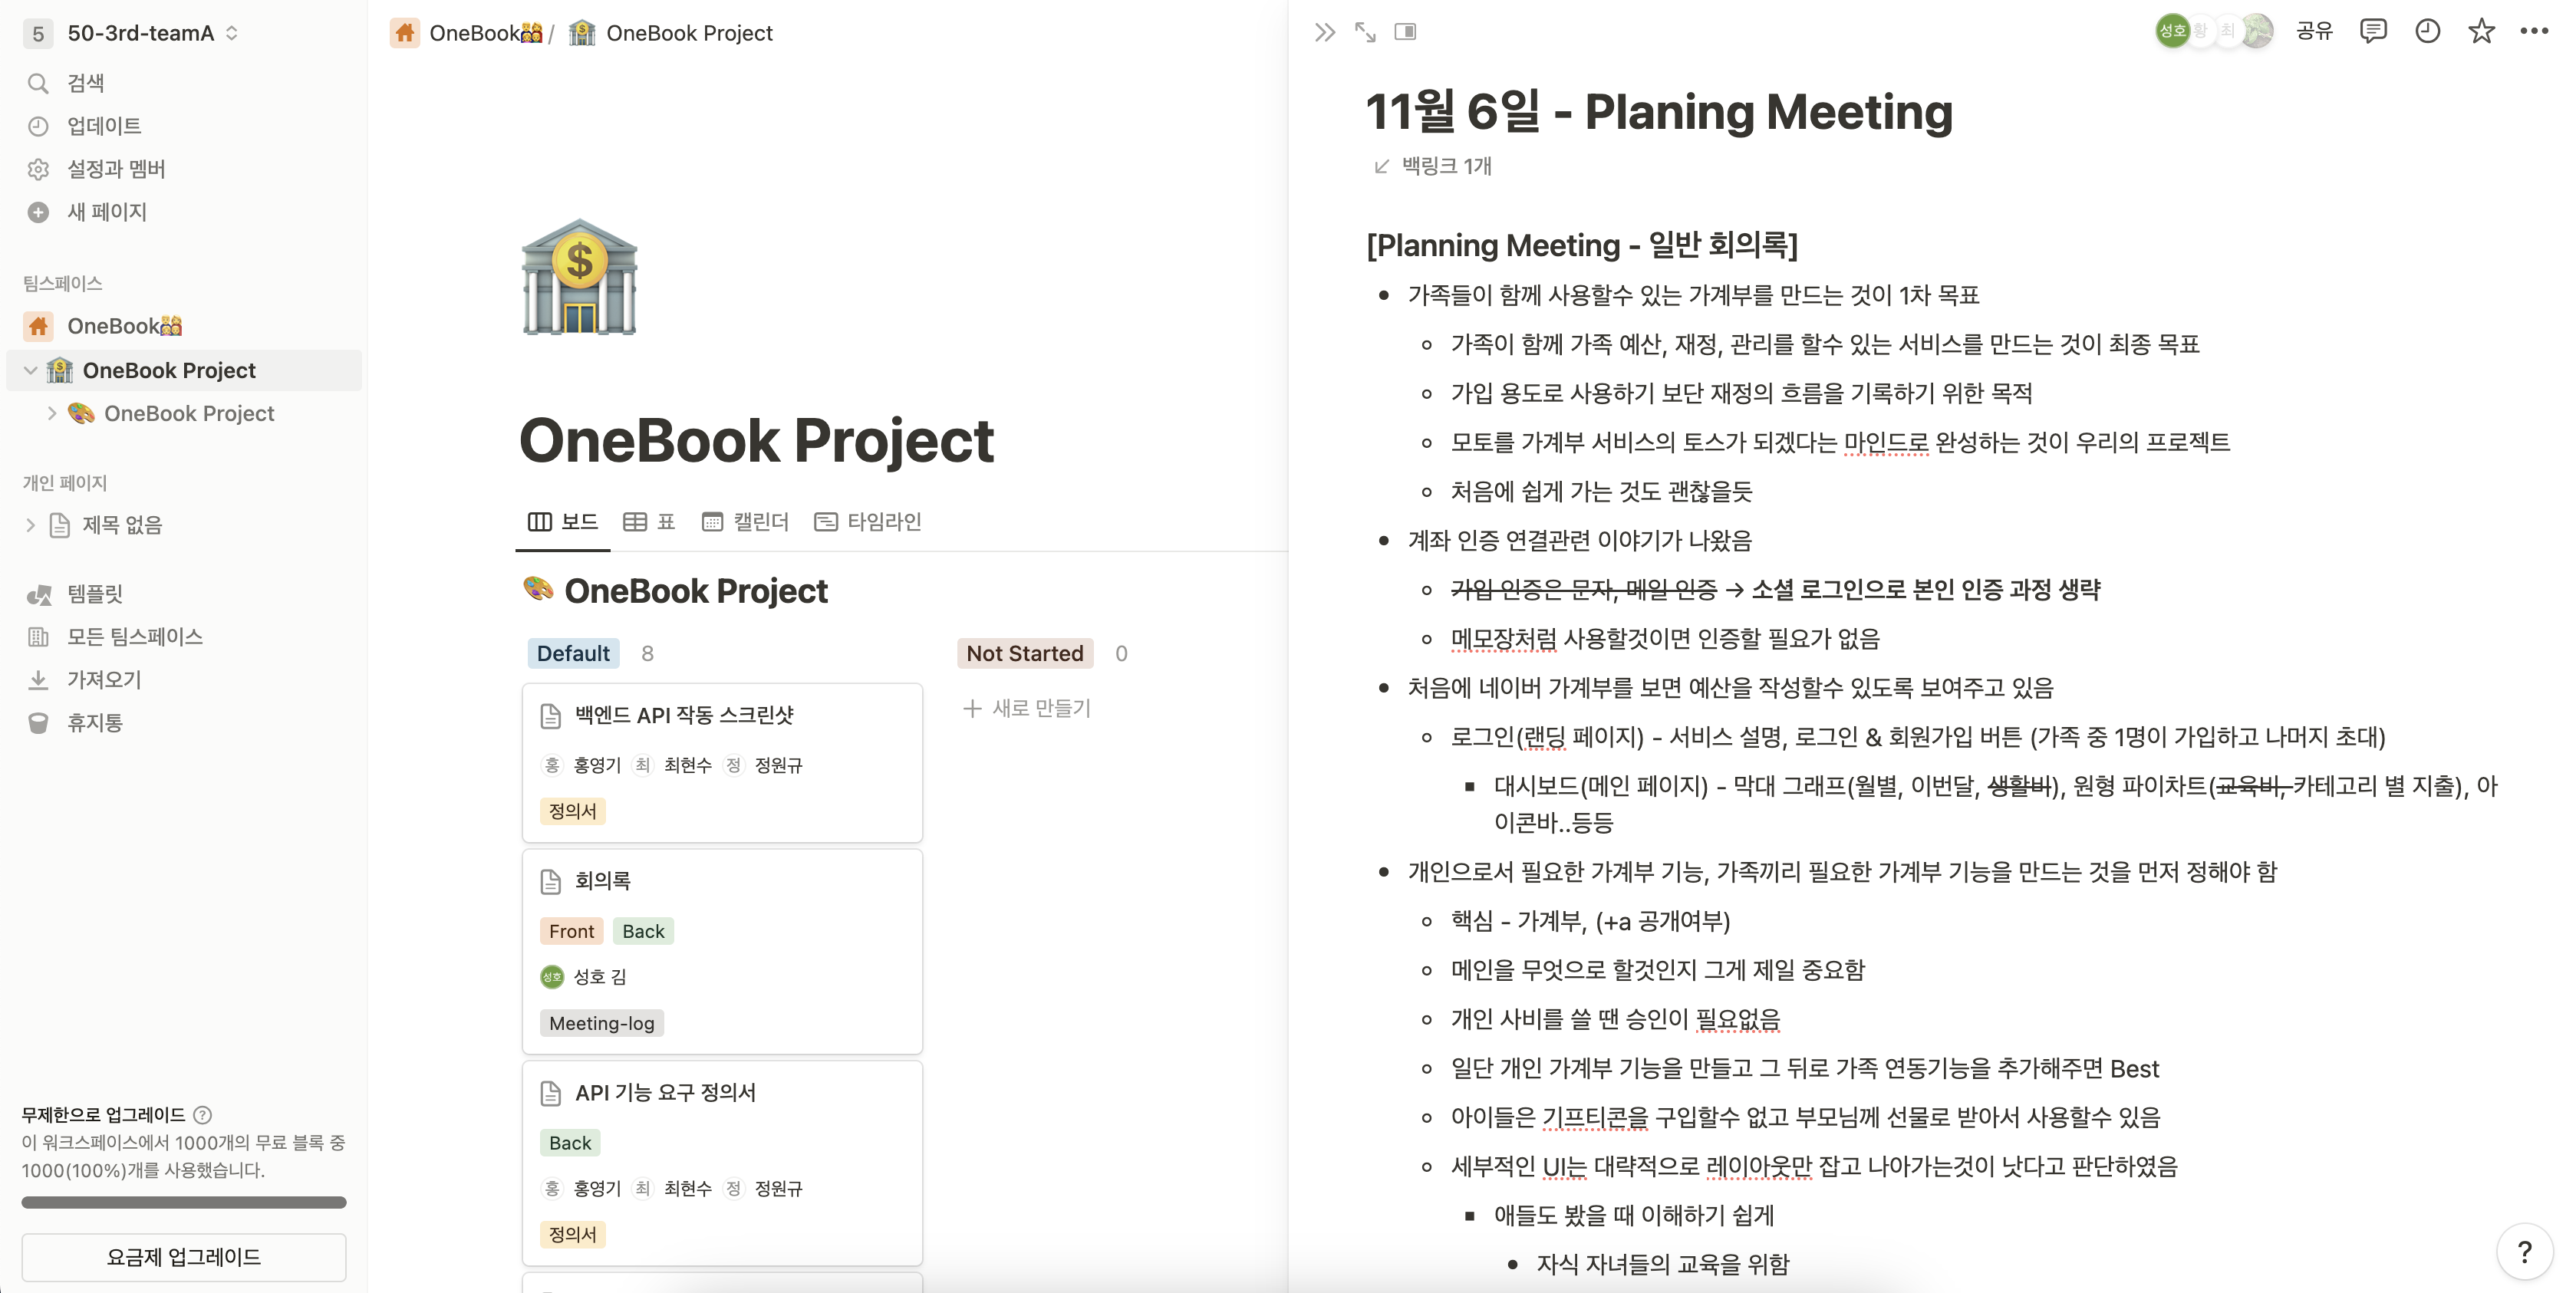
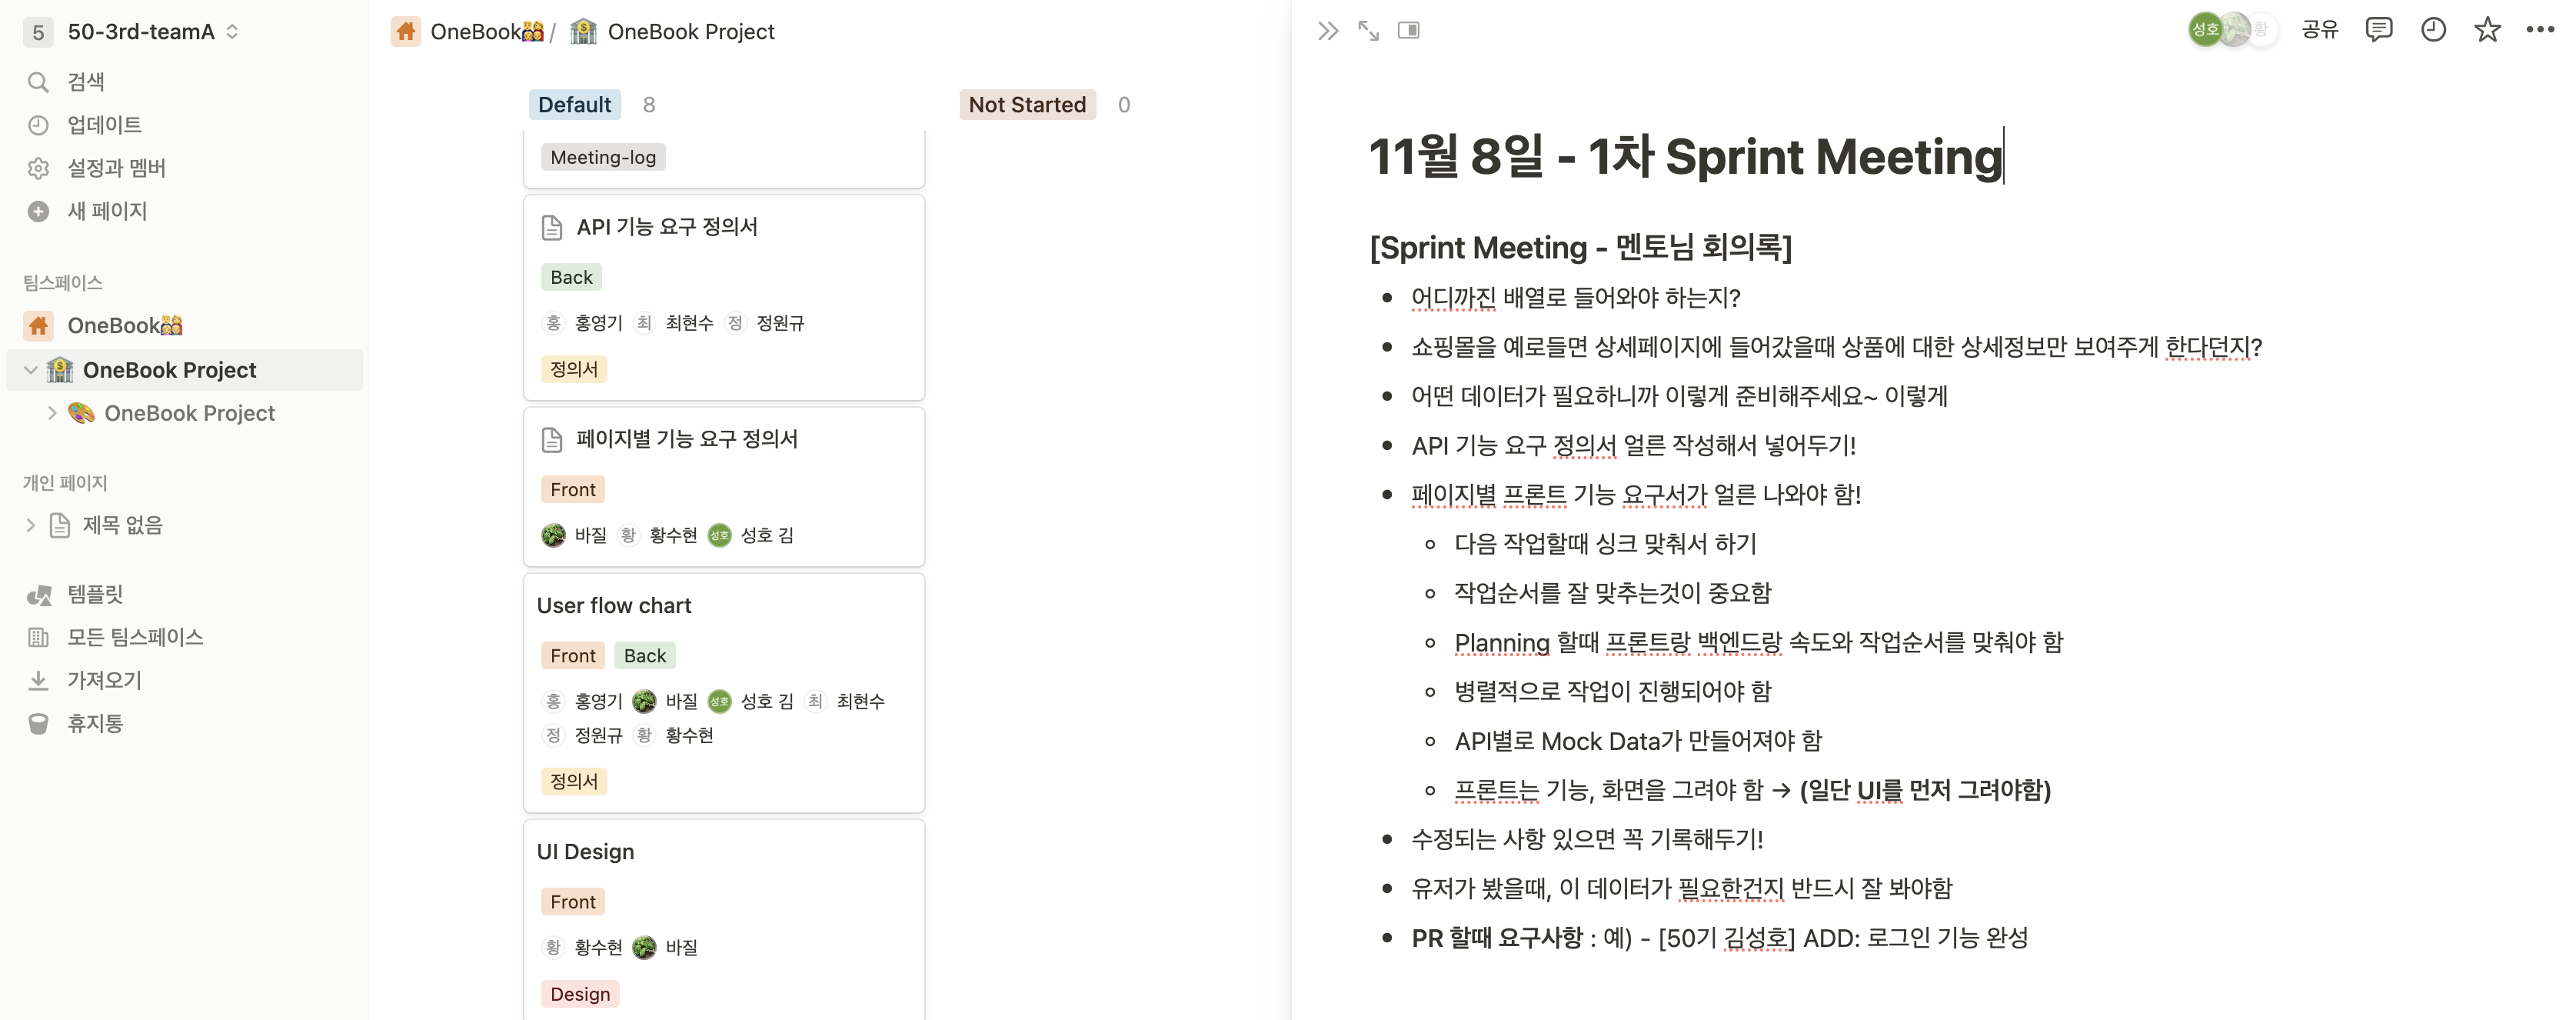
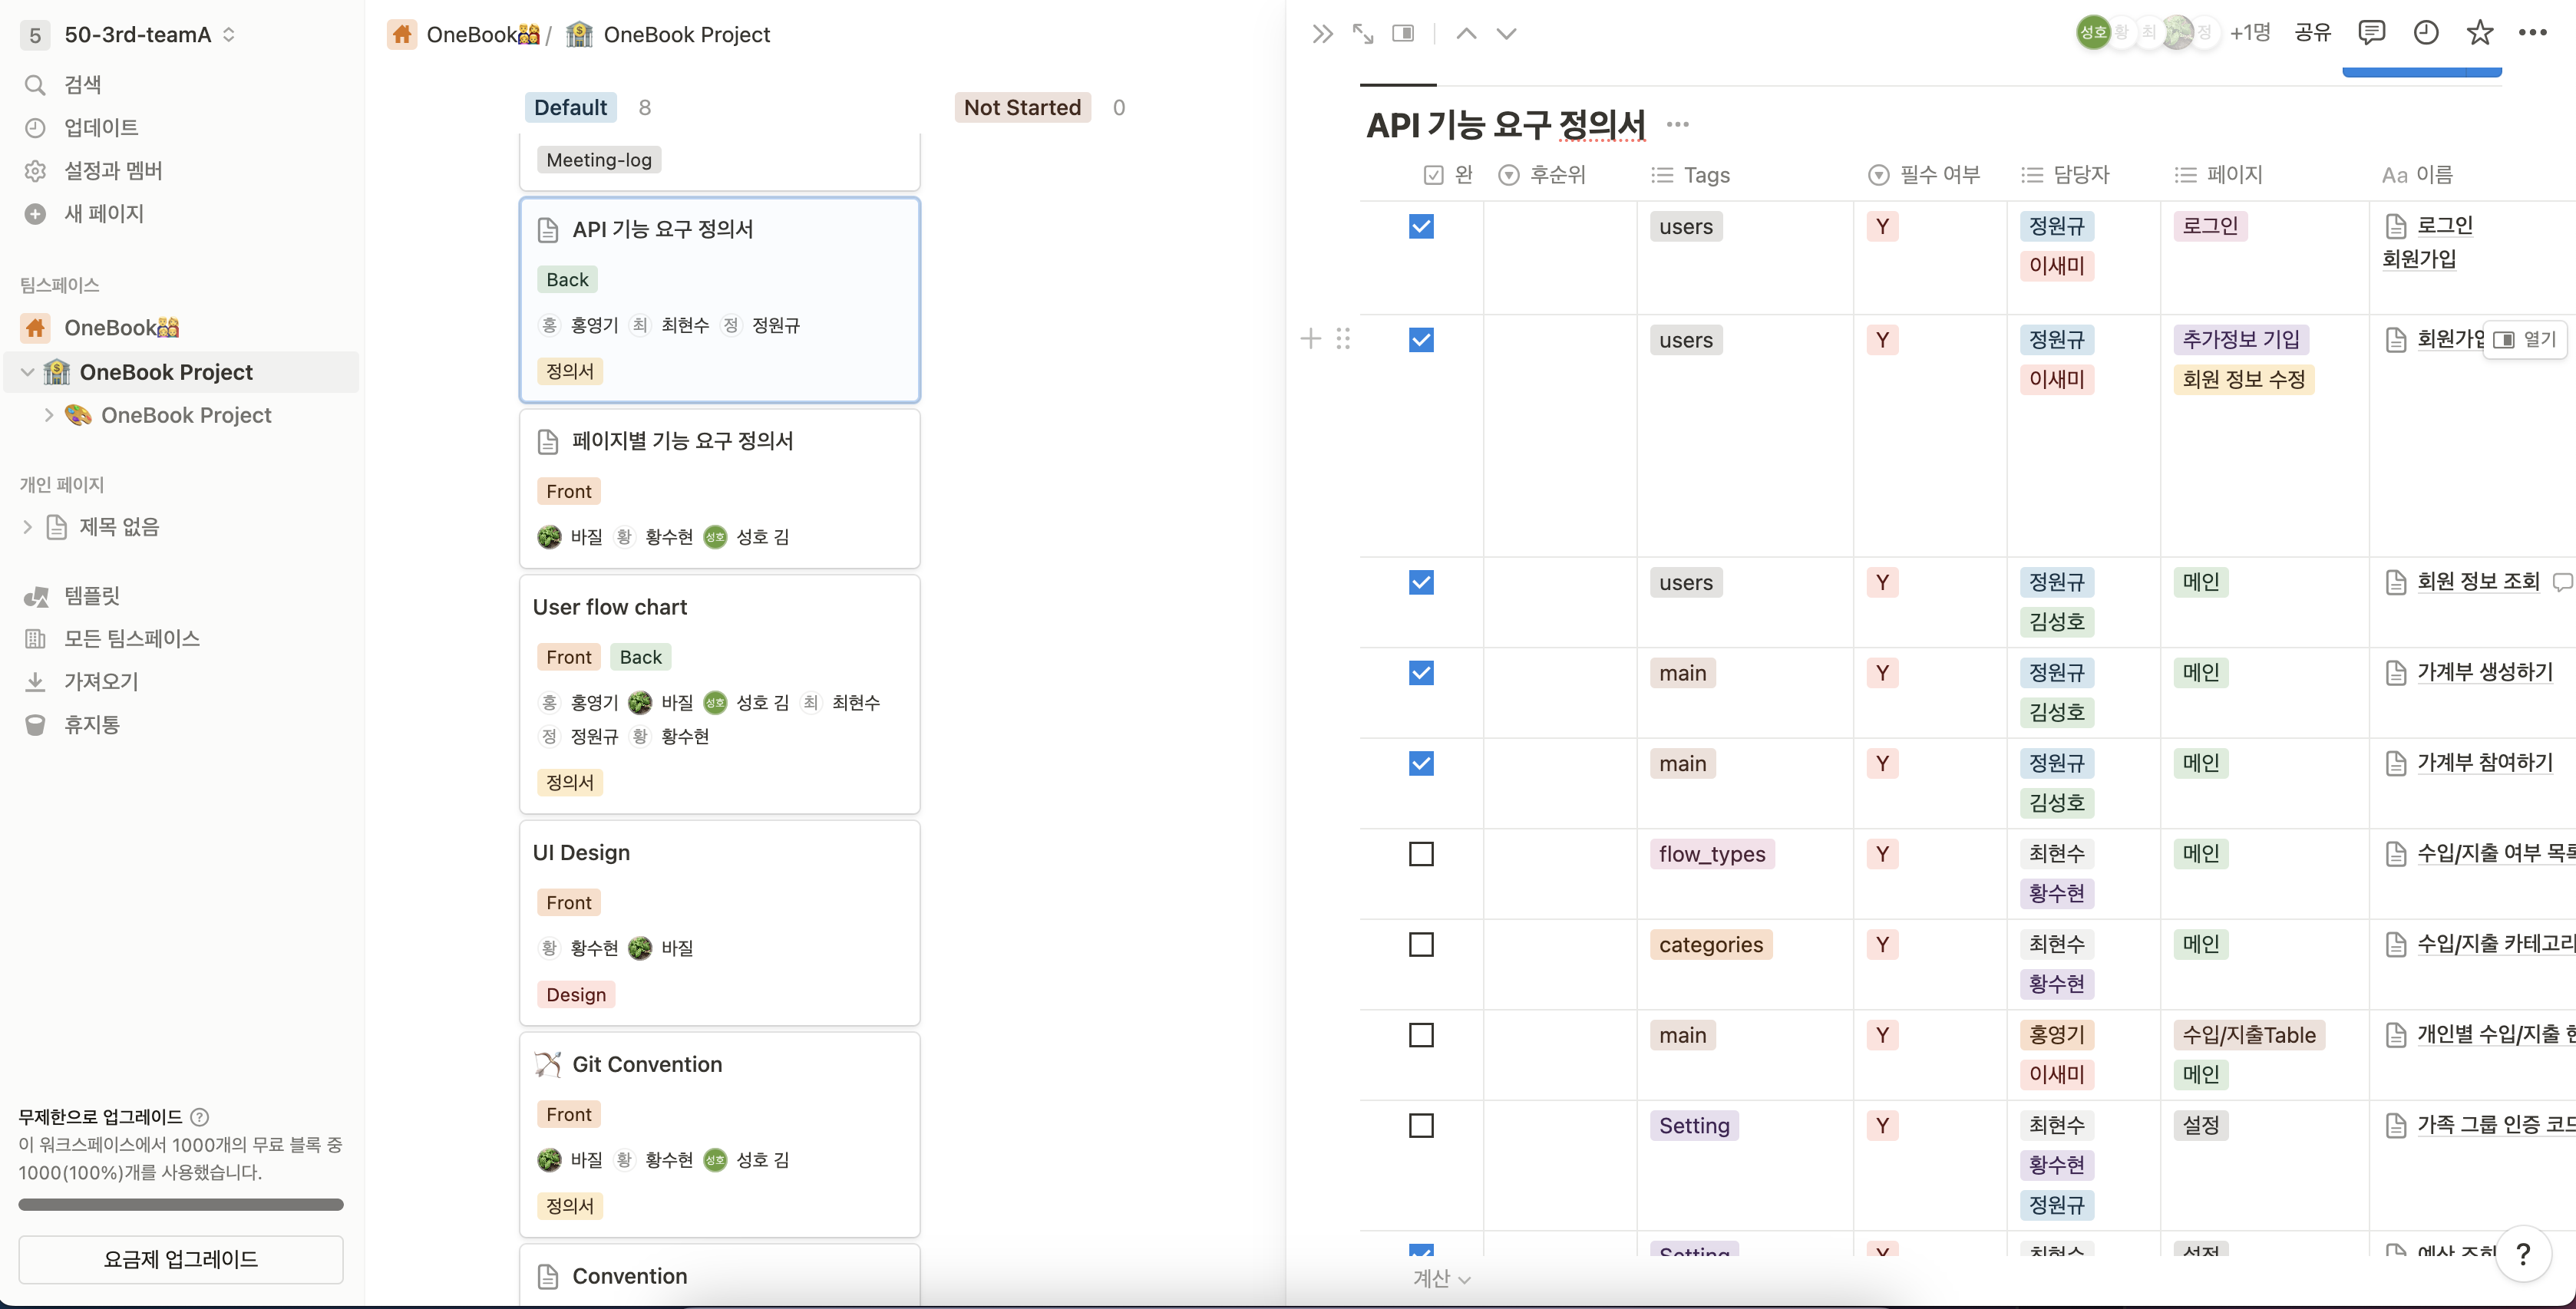
Daily Standup Meeting, Planing Meeting, Sprint Meeting 시 기록한 회의록 및 프로젝트 기능 요구 정의서를 정리해둔 Notion 툴
-
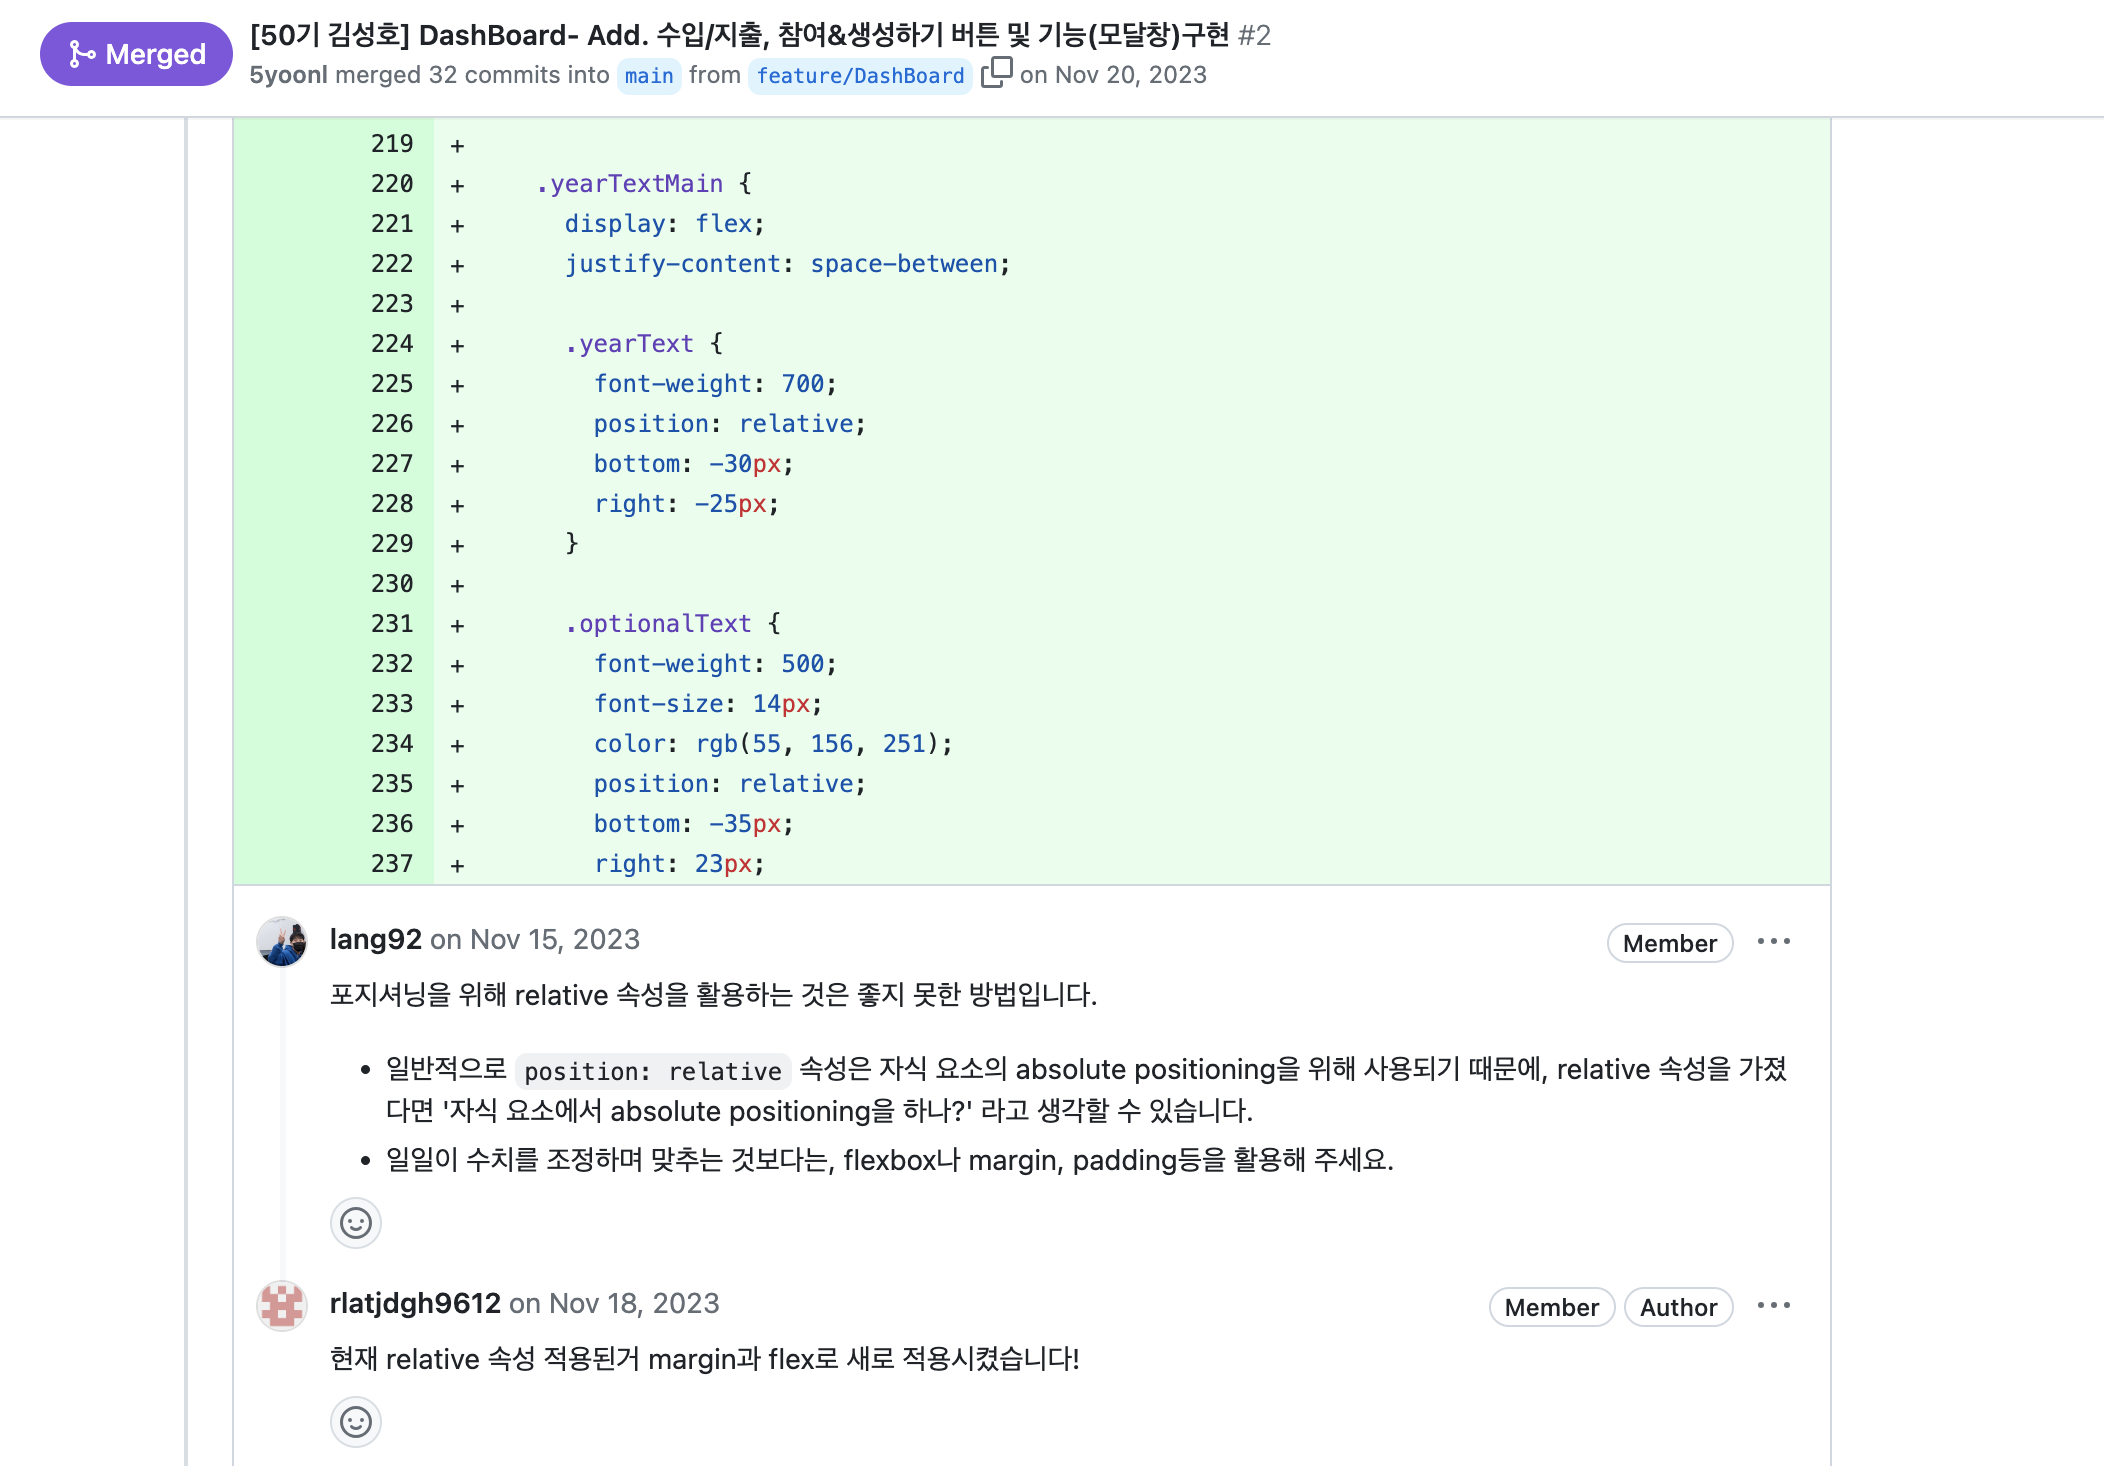
Github 원격에서 Git Convention을 활용한 팀 코드리뷰 수행
Meeting 때마다 매일 아침 10시~11시로 시간을 정해서, 프로젝트 티켓 분배 및 그외 이슈사항들을 팀원과 멘토님에게 공유하며 팀원간의 커뮤니케이션을 증대시키기 위해 노력하였습니다.
🚨 기술적 문제 & 개선 성과
[기술 문제]
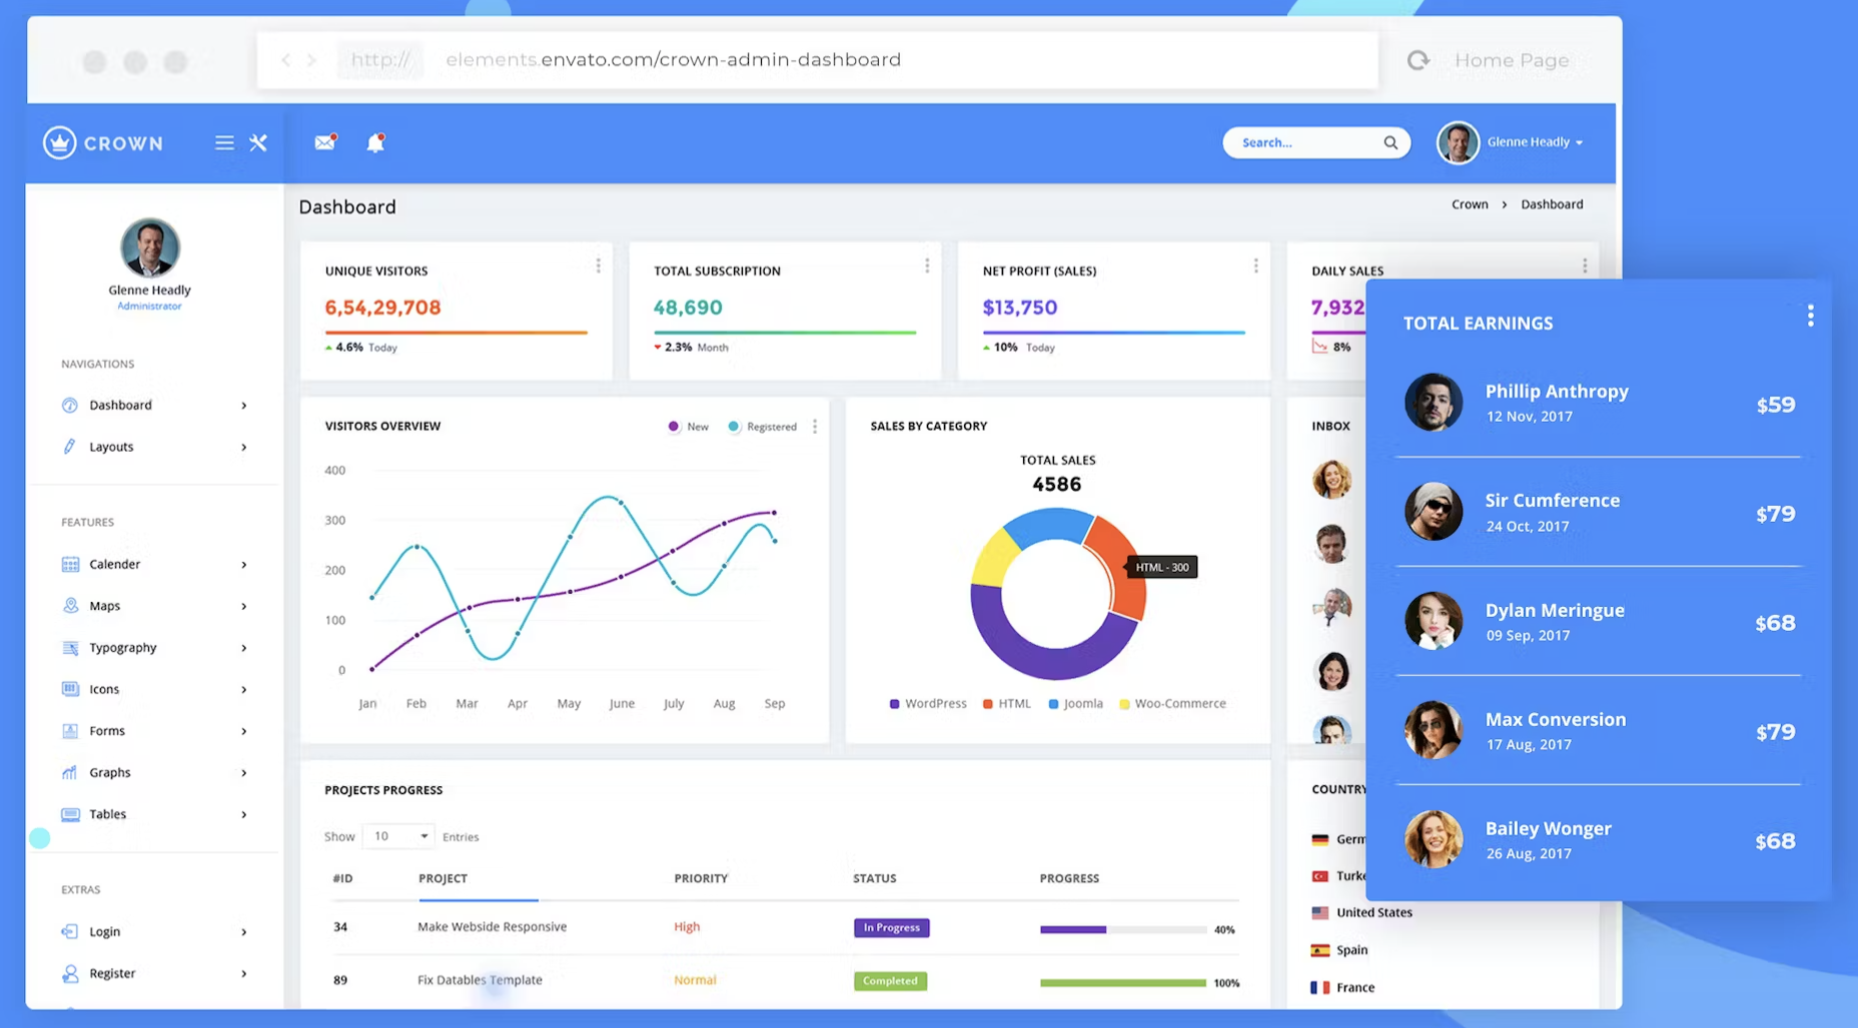
- 실제로 사용되고 있는 대시보드 내용들은 사용자들에게 보여주는 데이터들이 복잡하고 쉴새없이 많아서, 이 내용들을 그대로 가계부에 적용하게 될시에는 사용자가 수입/지출 내역 및 예산을 등록하고 파악하는데 불편함을 느껴 사용자 불만으로 이어지고 결국엔 사용자 이탈로 이어질수 있는 문제 가능성을 파악했습니다.
- 개선 하기 전
[고민]
- 사용자들이 가계부라는 하나의 제품 안에서 가계부 정보를 파악하기 쉽게끔 수입/지출 내역에 대한 데이터를 간략하게 시각화해서 쉽게 접근할 수 있도록 개선해야할 필요성을 느끼게 되었습니다.
[시도 방법]
- 대시보드 한 페이지 안에 1년 수입/지출과 월별-카테고리별 현황으로 나누어 간결하게 그래프 데이터로 보여주는 방법을 도입했습니다. 이를 통해 사용자들이 필요한 정보를 보다 쉽게 파악하고 활용할 수 있도록 하는 방법으로 보완하였습니다.
- 문제 개선 후
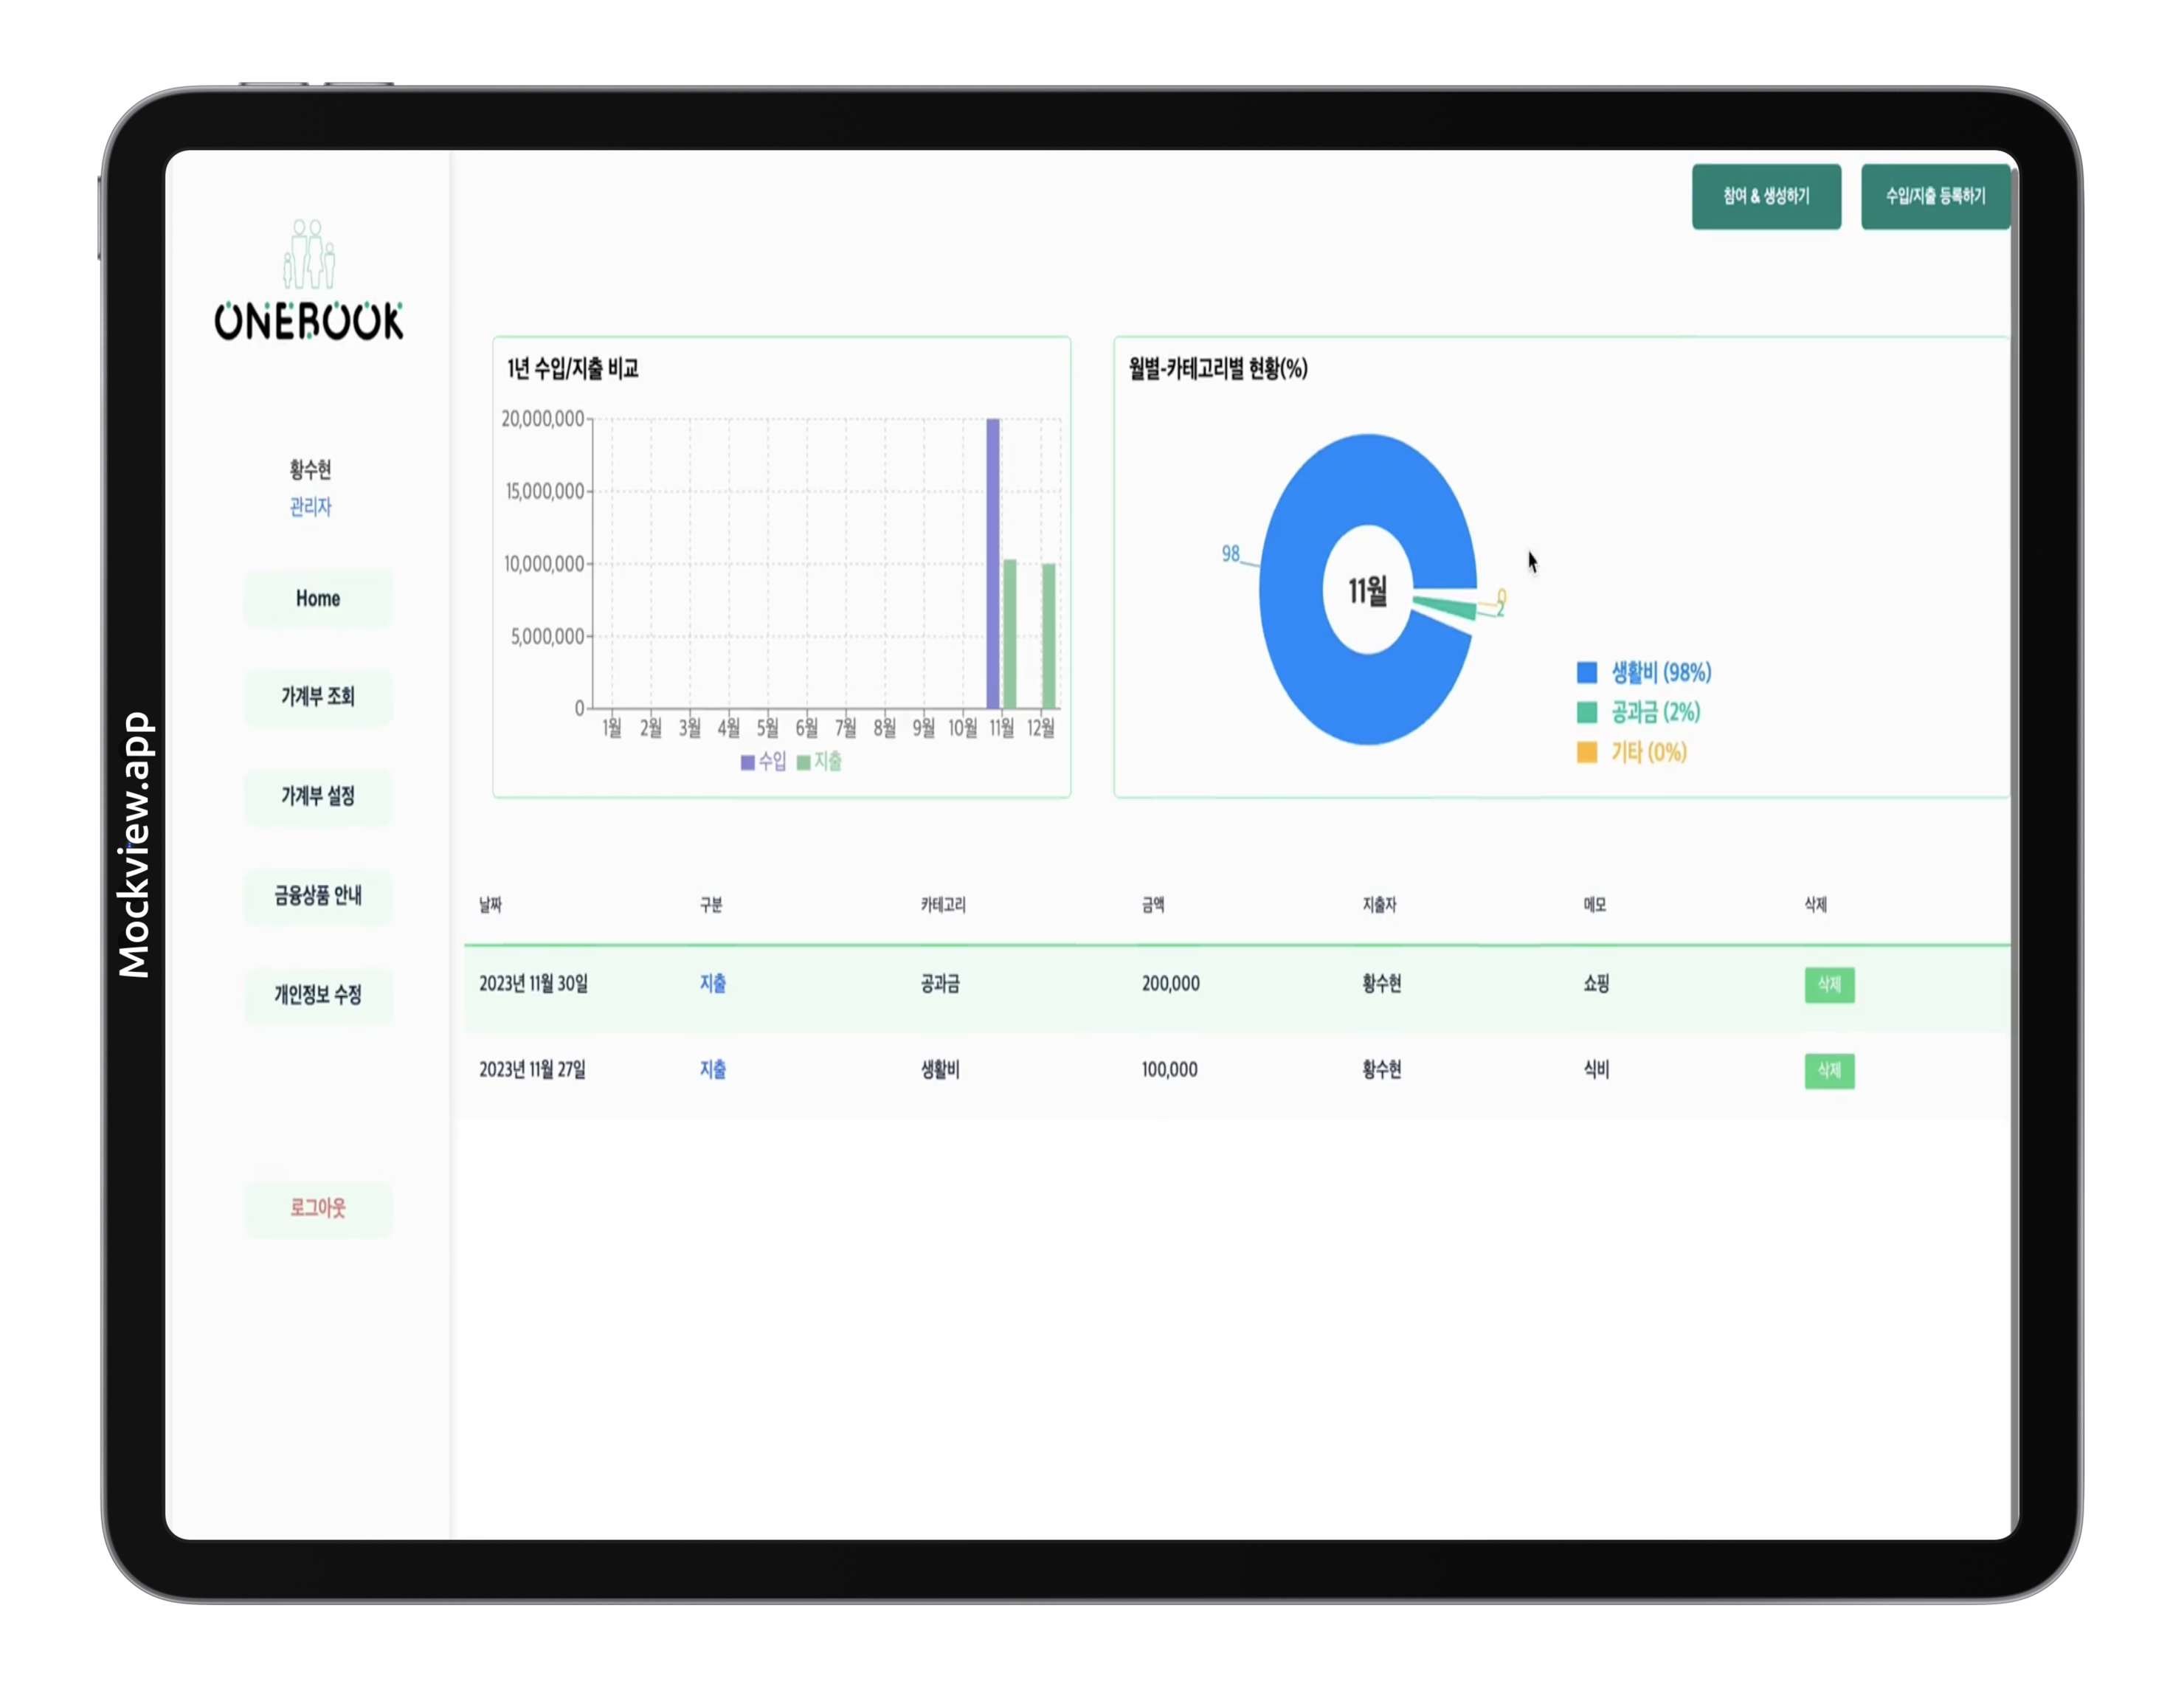
[개선 성과]
- 가계부 데이터들을 하나로 간략하게 시각화함으로써, 사용자들이 수입/지출 내역을 하나로 확인하고 예산을 관리할때 더욱 편리해졌습니다. 이를 통해, 사용자들이 가족 예산과 수입/지출의 내역 정보의 접근성과 편의성을 높여 가계부를 더욱 효율적으로 활용할 수 있도록 개선했습니다.
🧑🏻💻 가장 기억에 남는 코드
1) 가장 어려웠던 코드
1-2) 막대그래프 차트
import React from 'react';
import {
  BarChart,
  Bar,
  XAxis,
  YAxis,
  CartesianGrid,
  Tooltip,
  Legend,
} from 'recharts';

const GraphBarChart = ({ data }) => {
  const transformedData = [];

  for (let month = 1; month <= 12; month++) {
    const monthName = month + '월';
    const income = data.INCOME[monthName];
    const spending = data.SPENDING[monthName];

    const newData = {
      name: monthName,
      수입: income,
      지출: spending,
    };

    transformedData.push(newData);
  }

  const tickFormatY = (tickItem) => tickItem.toLocaleString();

  return (
    <BarChart
      width={580}
      height={280}
      data={transformedData}
      margin={{
        top: 25,
        right: 10,
        left: 40,
        bottom: 5,
      }}
    >
      <CartesianGrid strokeDasharray="3 3" />
      <XAxis dataKey="name" />
      <YAxis tickFormatter={tickFormatY} />
      <Tooltip />
      <Legend />
      <Bar
        dataKey="수입"
        fill="#8884d8"
        position="top"
        formatter={(value) => new Intl.NumberFormat('ko-KR').format(value)}
      />

      <Bar
        dataKey="지출"
        fill="#82ca9d"
        position="top"
        formatter={(value) => new Intl.NumberFormat('ko-KR').format(value)}
      />
    </BarChart>
  );
};

export default GraphBarChart;
1-2) 원형차트
import React, { useState, useEffect } from 'react';
import { PieChart, Pie, Cell, Tooltip, LabelList } from 'recharts';

const GraphCircularChart = ({ data }) => {
  const transformedData = [];
  // 월 데이터 변환 로직
  const [currentMonth, setCurrentMonth] = useState(getCurrentMonth());
  // 현재
  useEffect(() => {
    const interval = setInterval(() => {
      const newMonth = getCurrentMonth();
      if (newMonth !== currentMonth) {
        setCurrentMonth(newMonth);
      }
    }, 1000 * 60);

    return () => clearInterval(interval);
  }, [currentMonth]);

  function getCurrentMonth() {
    const currentDate = new Date();
    const month = currentDate.toLocaleString('default', { month: 'long' });
    return month;
  }

  data.forEach((item) => {
    let value = 0;
    if (item.spending !== '0%') {
      const percentage = parseInt(item.spending);
      value = Math.round((percentage / 100) * 100);
    }

    transformedData.push({
      name: item.category,
      value: value,
    });
  });

  // const total = data.reduce((acc, entry) => acc + entry.value, 0);

  return (
    <PieChart width={900} height={500}>
      <Pie
        data={transformedData}
        dataKey="value"
        isAnimationActive={true}
        cx={250}
        cy={140}
        innerRadius={45}
        outerRadius={110}
        fill="#82ca9d"
        paddingAngle={5}
        label
      >
        {transformedData.map((entry, index) => (
          <Cell key={`cell-${index}`} fill={COLORS[index % COLORS.length]} />
        ))}
        <LabelList
          dataKey="name"
          position="outside"
          content={(props) => {
            const { value, index } = props;
            const percent = data[index].spending;

            return (
              <g>
                <rect
                  x={465}
                  y={196 + index * 28}
                  width={20}
                  height={15}
                  fill={COLORS[index % COLORS.length]}
                />
                <text
                  x={500}
                  y={210 + index * 28}
                  fill={COLORS[index % COLORS.length]}
                  fontWeight="bold"
                  fontSize={18}
                >
                  {value} ({percent})
                </text>
                <text
                  x={255}
                  y={155}
                  textAnchor="middle"
                  fill="#333"
                  fontSize={24}
                  fontWeight="bold"
                >
                  {currentMonth}
                </text>
              </g>
            );
          }}
        />
      </Pie>
      <Tooltip />
    </PieChart>
  );
};

export default GraphCircularChart;

const COLORS = ['#0088FE', '#00C49F', '#FFBB28'];- 가계부 데이터들을 표시할 막대그래프와 원형차트의 코드입니다. rechart 라는 react 차트용 라이브러리를 사용했고, 월별 카테고리별에 표시된 데이터들과 수입/지출에 대한 막대형 데이터들을 실제 백엔드 API가 가지고 있는 data를 prop으로 전달받아 main 대시보드 페이지에서 각각의 차트들을 사용자에게 보여주는 점을 알게되어 좋았지만, React에서 그래프 로직들을 처음으로 만들다보니 한번에 이해하기가 어려웠던 코드로 남았습니다.(시간 관계상 라이브러리로 가져와서 사용했지만 추후에 그래프를 직접 만들어서 적용하는 습관도 중요하다는 것을 느꼈습니다.)
😄 3차 프로젝트 회고
2차 프로젝트가 끝난뒤, 바로 3차 프로젝트 기획과 개발에 착수했습니다. 이번 3차 프로젝트는 가족의 예산 관리와 자녀들의 경제 교육을 위한 가계부를 개발하는것을 목표로 잡았습니다.
이를 위해 4일 동안 늦은 시간까지 Planing Meeting을 진행하고, 매일 아침 10~11시 마다 Daily Standup Meeting으로 각자 맡은 개발 티켓 상황과 이슈사항을 공유하면서 현업과 똑같은 프로젝트를 수행했습니다. 프로젝트를 진행하면서 실제 회사에서 진행하는 업무를 경험하며 프로젝트의 중요성을 몸소 느낄 수 있었습니다.
제가 맡았던 기능들은 대시보드, 메뉴바, 막대/원형 그래프 구현을 담당했습니다. 개발 수행시 멘토님의 코드리뷰와 해결해야 할 과제가 많았는데, 특히 막대그래프와 원형차트의 구현이 어려웠지만, 이러한 어려움과 에러를 극복하며 적용하기 위해 노력했습니다. 만약에 저희 팀에서 개발한 가계부 프로젝트가 실제 사용자들에게 배포해서 사용에 대한 피드백을 받는다면, 그것을 어떻게 적용해야 하는지 문제 해결의 의미를 생각하며 스스로 반성해야 겠다고 느꼈습니다.
3주 라는 기간동안 고생많으셨고 저는 별도로 개인 프로젝트를 통해 부족한 내용에 대해 스스로 학습하며 회고하는 습관을 가지기 위해, 기업협업을 나가지 않지만 이것도 하나의 큰 도움이 될꺼라고 믿어 의심치 않습니다.다음주 부터 시작되는 기업협업 잘 다녀오시길 바랄께요!
Fighting!!