서론
In this semester, I studied Statistics.
I thought like Statistics? isn't it a pseudo-math?
So, I didn't studied that hard. So arrogant. I regret it sincerely.
By the way, there is a concept name CLT(Central Limit Theorem)
To say it roughly, it's concept is, as the sample size increases, the distribution of sample means will become normally distributed approximately regardless of the shape of original population distribution.
So, I tried to see it actually working.
Python code
import random
from matplotlib import pyplot as plt
import numpy as np
import seaborn as sns


def array_gen():
	# generate population and its size = 1000
    num = []
    for i in range(1000):
        num.append(random.randint(1, 10))
    return num


def avg(num):
	# return the sample mean
    sum = 0
    for i in range(30):
        rand_num = random.randint(0, 999)
        sum += num[rand_num]
    return sum/30


mean_array = []
new_array = array_gen()
#simulation
for i in range(10000):
    mean = avg(new_array)
    mean_array.append(mean)
#draw histogram
sns.distplot(mean_array, bins=30, kde=False)
plt.show()
I ran the source code above.
the result was like this.
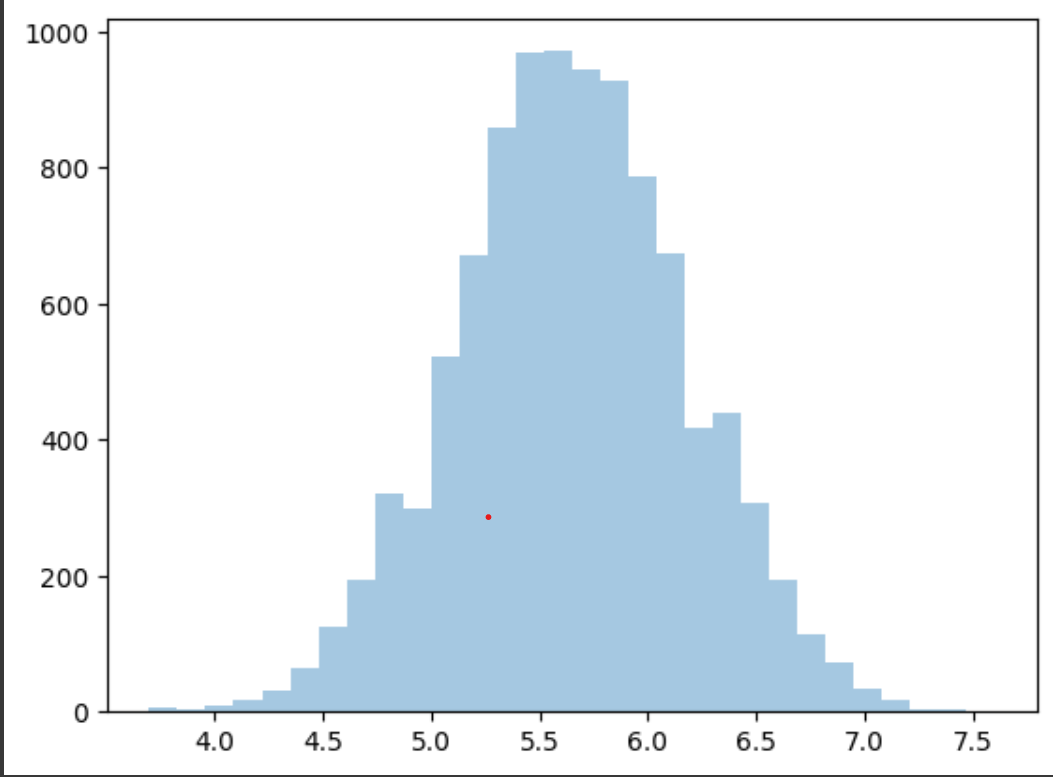
This time I increased sample size to 200.
And I repeated extracting sample mean 1000000 times.
And Originally I drew histogram. But this time I just used plt.plot()function.
It took 213 seconds.
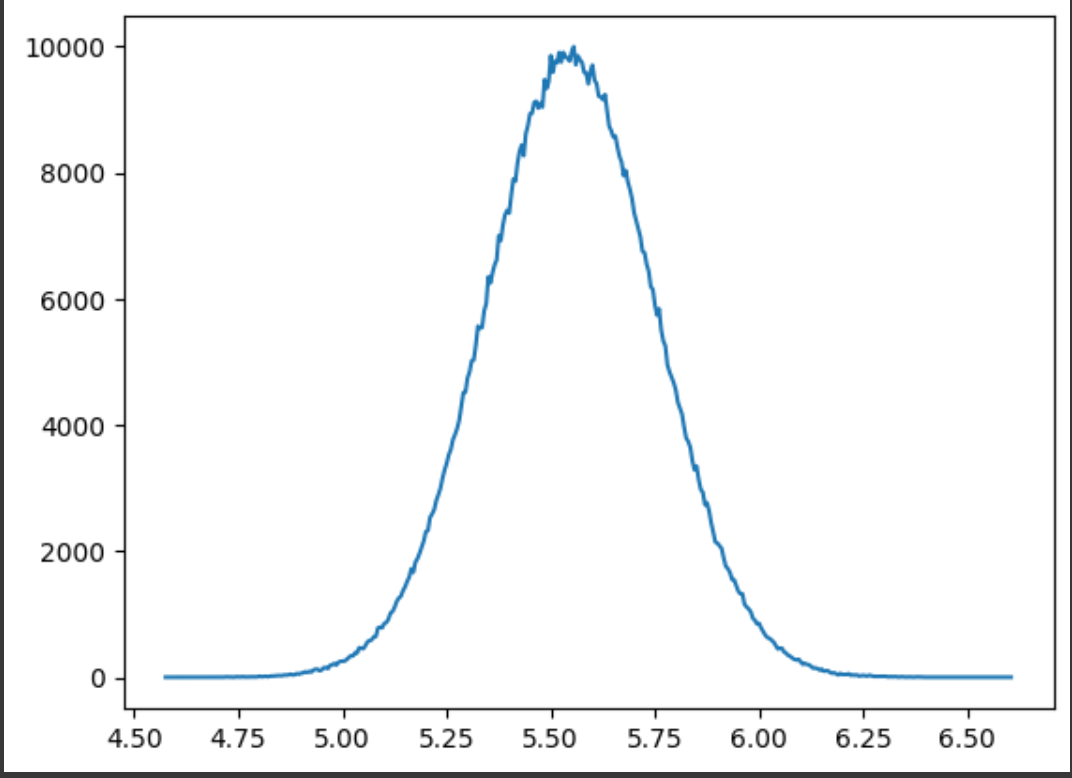
Though it looks continuously.
And I set the sample size 10.
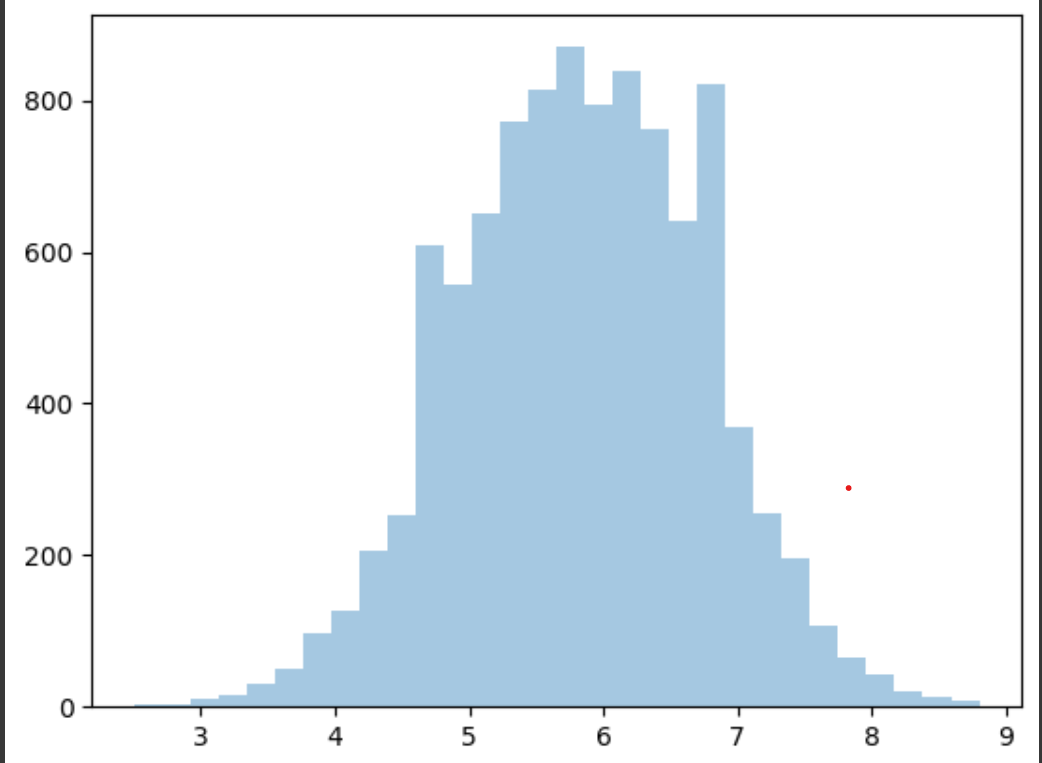
I think this also looks like normal distribution.
However the version of size 30 looks like more normal distribution.
검색해보니 잘 정리된게 있어서 차라리 이걸 봐도 좋을 거 ㅅ같다.
https://m.blog.naver.com/parksehoon1971/221585313064