Introduction
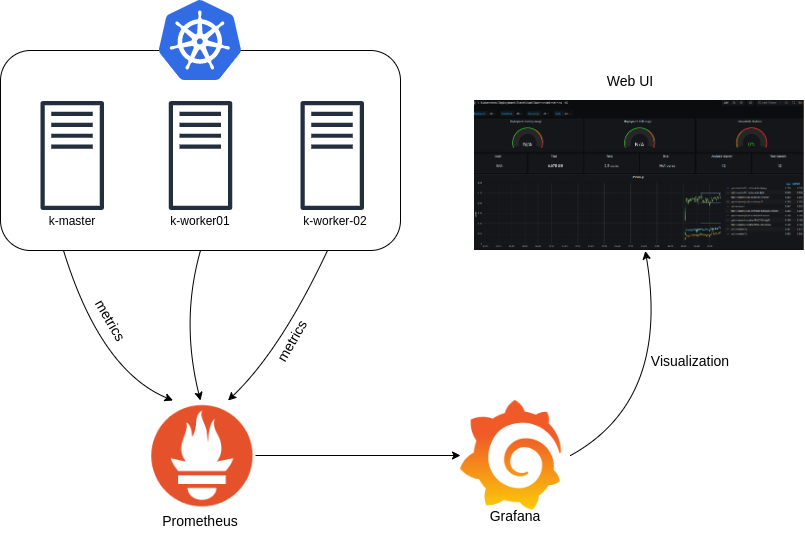
Prometheus🔥와 Grafana☀️를 설치하고, 시계열 데이터와 시스템 및 애플리케이션의 성능을 모니터링 해보자!
프로메테우스와 그라파나에 대한 개념은 여기를 참고하라.
프로메테우스 스택
이번 과정은 프로메테우스 스택을 이용해서 설치할 것이다.
프로메테우스 스택이란, 프로메테우스 모니터링에 필요한 다양한 도구들을 단일 스택으로 구성할 수 있는 패키지📦이다.
이러한 프로메테우스 스택을 통해서 프로메테우스나 그라파나, AlertManager등을 한번에 설치할 수 있다.
프로메테우스 스택 설치
네임 스페이스 생성
// monitoring 네임 스페이스 생성
kubectl create ns monitoring
helm repo 추가
// helm chart repository 추가
helm repo add prometheus-community https://prometheus-community.github.io/helm-charts
프로메테우스 스택을 제공하는 prometheus-community 리포지토리가 추가되었다.
이 리포지토리에서 kube-prometheus-stack를 설치할 것이다.

프로메테우스 스택 설치
// 파라미터 파일 다운로드 및 확인
curl -s -O https://raw.githubusercontent.com/cloudneta/cnaeblab/master/_data/monitor-values.yaml
cat monitor-values.yaml | yh
// 변수 추가
// 1. 도메인 변수 선언
MyDomain=<자신의 도메인>
// 2. ARN 변수 선언
CERT_ARN=`aws acm list-certificates --query 'CertificateSummaryList[].CertificateArn[]' --output text`; echo $CERT_ARN
// 환경 변수 선언
export MyDomain=$MyDomain CERT_ARN=$CERT_ARN
// 프로메테우스 스택 배포
envsubst < monitor-values.yaml | helm install kube-prometheus-stack prometheus-community/kube-prometheus-stack --version 45.27.2 \
--set prometheus.prometheusSpec.scrapeInterval='15s' \
--set prometheus.prometheusSpec.evaluationInterval='15s' \
-f - --namespace monitoring
// 확인
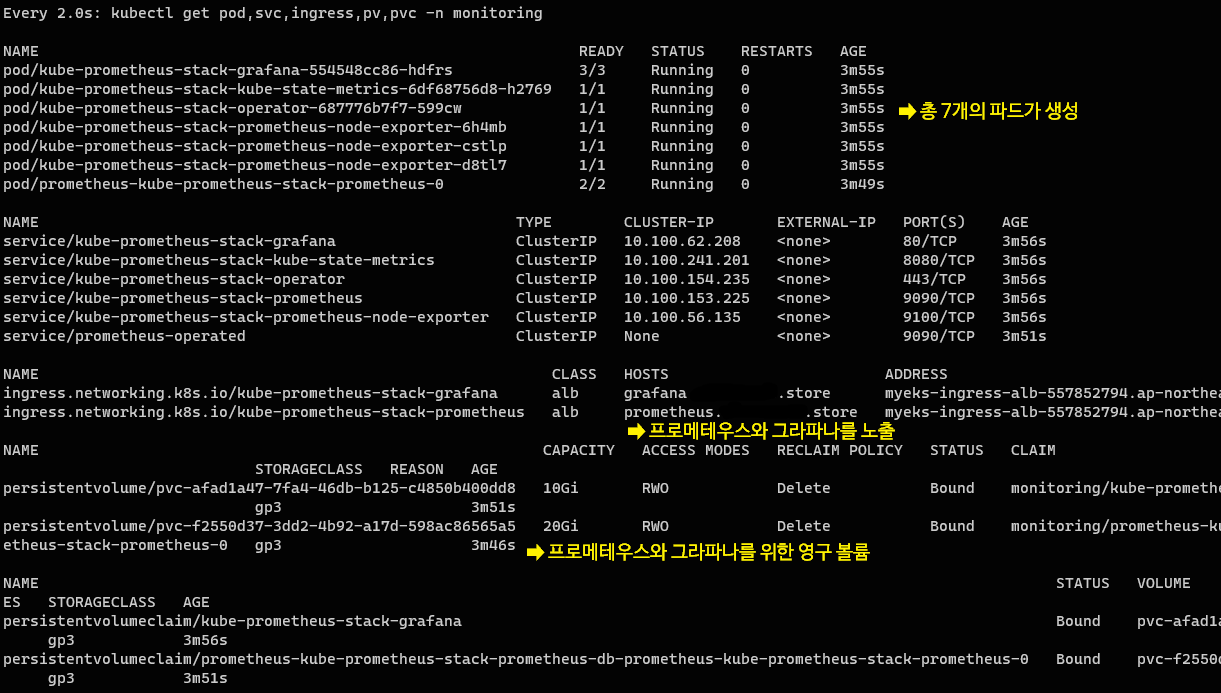
kubectl get pod,svc,ingress,pv,pvc -n monitoring프로메테우스 스택을 설치하기 위한 파라미터를 구성한다. 파일을 다운로드 후 확인해 보자.
프로메테우스🔥
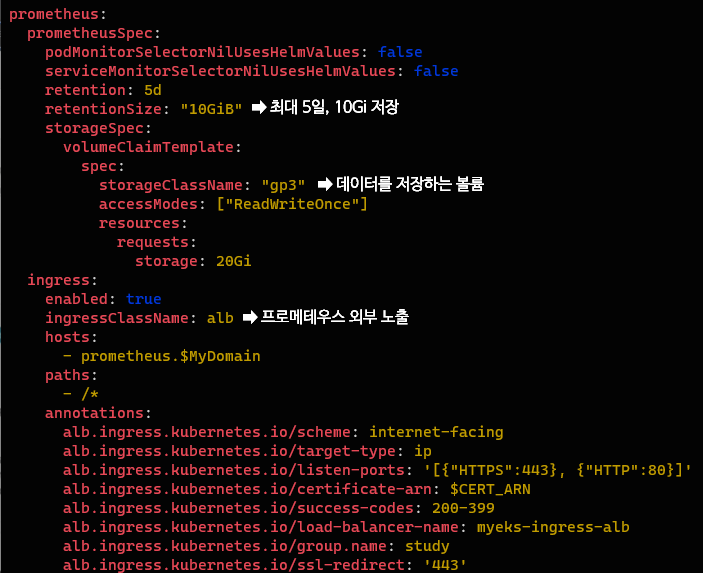
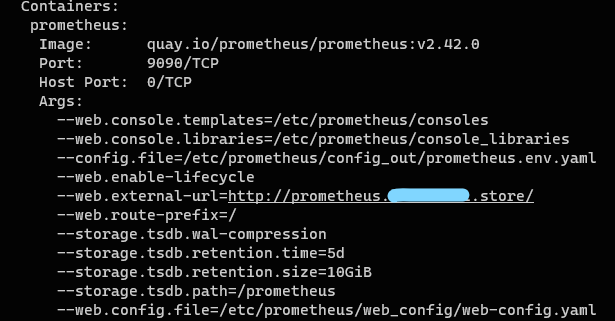
먼저 프로메테우스를 정의하고 프로메테우스 스펙을 정의하고 있다.
retention은 메트릭 정보를 보유하는 기간이나 사이즈를 의미하는데, 최대 5일간 수집된 메트릭을 보유하고 최대 10Gi까지 메트릭을 저장할 수 있다는 것을 뜻한다.
데이터를 저장할 볼륨과, 프로메테우스를 외부로 노출할 ingress(ALB)또한 확인할 수 있다.
그라파나☀️
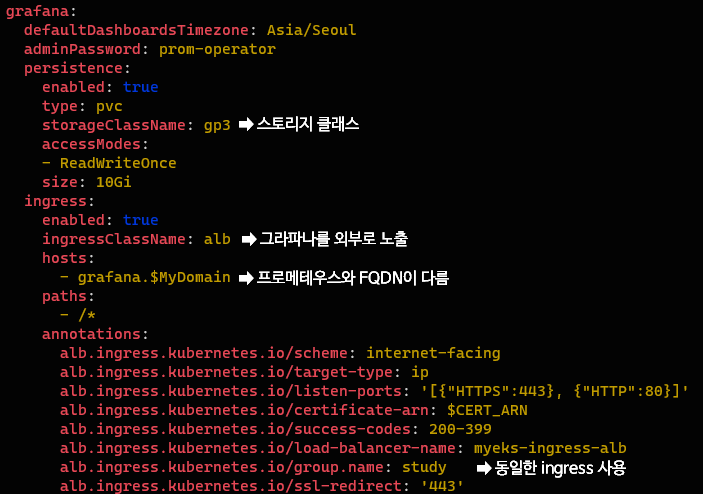
프로메테우스 스택🧩이므로 그라파나☀️를 정의하는 부분 또한 함께 있다.
이제 이러한 프로메테우스 스택을 배포할 때 $ARN과 $MyDomain이 자동으로 치환될 수 있도록 환경변수로 설정한 뒤, 배포를 수행하면 된다.
monitor-values.yaml 파일을 파라미터로하여 prometheus-community/kube-prometheus-stack가 설치완료 되었다.
다음과 같이 많은 자원이 생성되는데, 이후 도식화된 그림에서 자세히 설명하겠다.
프로메테우스 설치 확인
// monitoring 네임 스페이스에 helm list 확인
helm list -n monitoring

// monitoring 네임 스페이스에 모든 자원 확인
kubectl get-all -n monitoring
helm을 통해 프로메테우스 스택이 잘 생성된 것을 확인할 수 있다.
sts, ds, deloy 확인
// monitoring 네임 스페이스에 sts, ds, deploy 확인
kubectl get sts,ds,deploy -n monitoring

// statefulset 상세 정보
kubectl describe sts -n monitoring

// daemonset 상세 정보
kubectl describe ds -n monitoring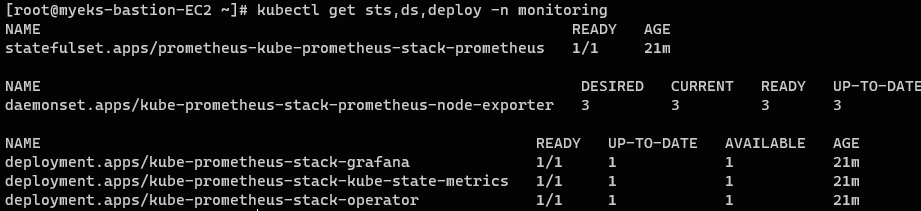
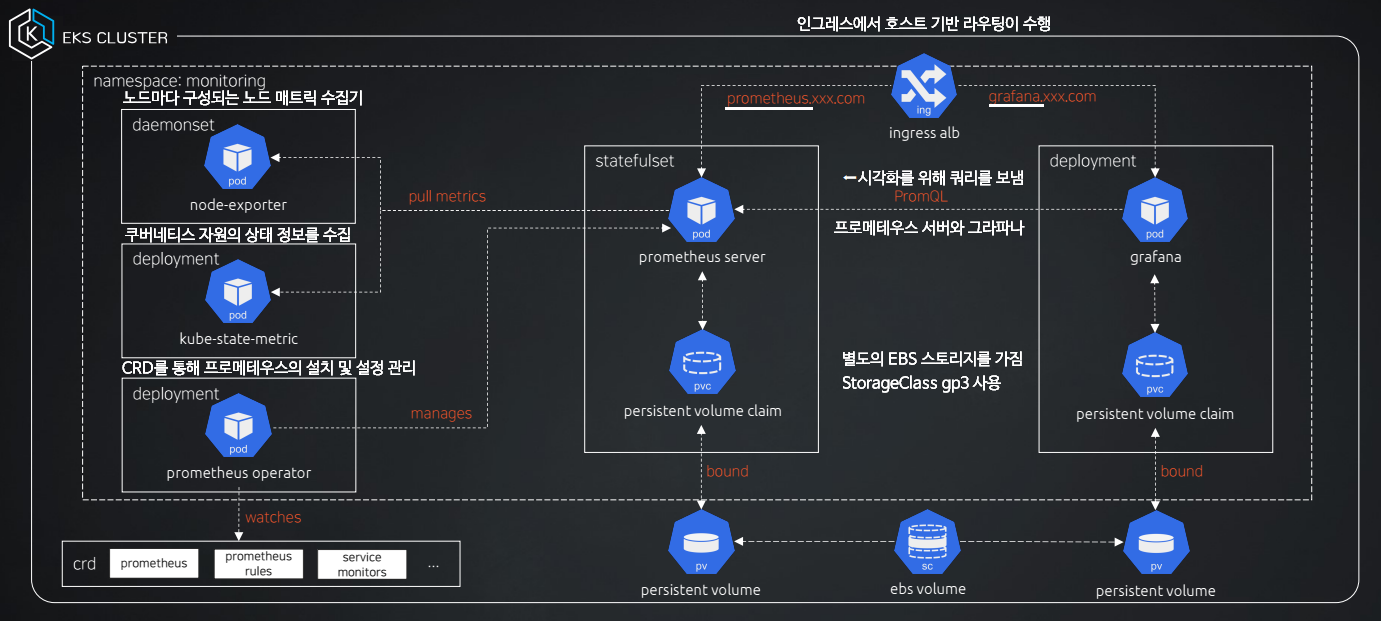
- StatefulSet으로 프로메테우스 서버가 1대 구성된다.
- 데몬셋으로
node-exporter가 각각의 노드에 배치된다. (3개)
데몬셋으로 배포된node-exporter는 노드의 시스템 및 리소스 메트릭을 수집하는 역할을 수행한다. - 끝으로 grafana☀️, kube-state-metrics📊, prometheus-stack-operator⚙️가 한대씩 설치된다.
StatefulSe(프로메테우스 서버)의 상세정보를 확인해보면 서버가 노출되는 external-url은 앞서 구성한 ingress의 호스트 주소로 설정되어 있다.
crd, servicemonitors, targetgroupbindings 확인
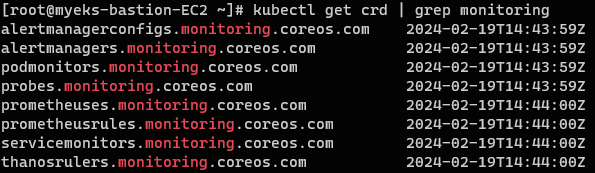
// CRD 확인
kubectl get crd | grep monitoring
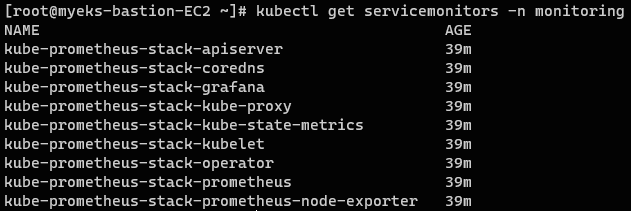
// 모니터링 대상 확인
kubectl get servicemonitors -n monitoring
// Ingress(ALB) 대상그룹 확인
kubectl get targetgroupbindings -n monitoring
- CRD 확인
CRD에서 정의한 스펙을 바탕으로 prometheus-stack-operator⚙️가 설치 및 설정 관리를 수행
- 모니터링 대상 확인
servicemonitors: 프로메테우스의 서비스 디스커버리🔍가 실행되는 대상들

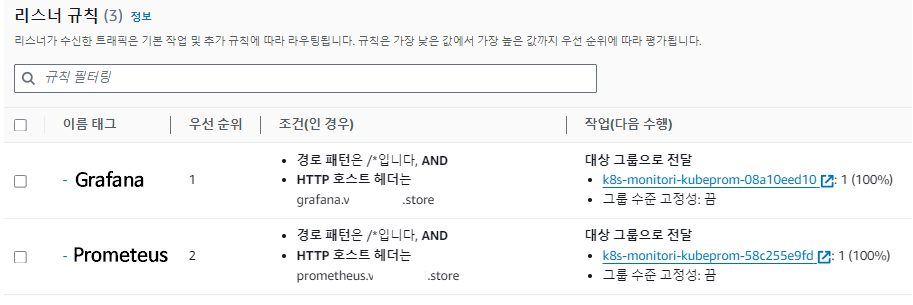
- Ingress(ALB) 대상그룹 확인
하나의 ALB에 2개의 리스너가 연결되어 🏨호스트 기반 라우팅이 되는 것을 확인할 수 있다.
ex.) www.naver.com에서 www가 달라지는 것이 호스트 기반 라우팅이다.
전체 정리🌠
모니터링 대상을 확인하고, 프로메테우스 서버에 접속하여 프로메테우스 웹 페이지를 살펴보도록 하자.
PromQL를 통해서 테이블 형태와 그래프 형태로 확인할 수 있다.
node-exporter 확인
// node-exporter의 포트 정보
kubectl describe ds -n monitoring | grep Port

// node-exporter의 서비스와 엔드포인트 확인
kubectl get svc,ep -n monitoring kube-prometheus-stack-prometheus-node-exporter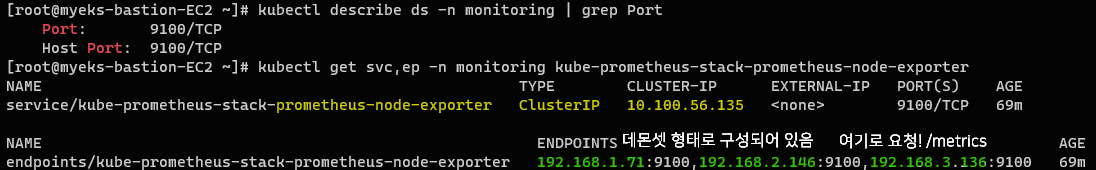
프로메테우스 서버는 각 노드에 있는 node-exporter의 엔드포인트에 요청해서 노드에 관련된 매트릭을 수집한다. (pull metrics 방식)
모니터링 대상별 /metrics 확인
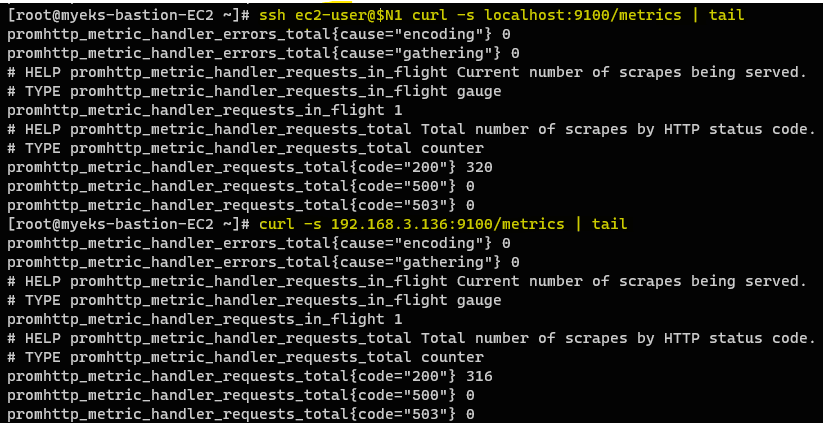
// node-export - 노드에서 localhost로 9100 포트에 /metrics 접속
ssh ec2-user@$N1 curl -s localhost:9100/metrics | tail

// servicemonitors 확인
kubectl get servicemonitors -n monitoring

// 네임 스페이스별 엔드포인트 확인
echo ">>>monitoring NS<<<"; kubectl get ep -n monitoring; \
echo ">>>kube-system NS<<<"; kubectl get ep -n kube-system; \
echo ">>>default NS<<<"; kubectl get ep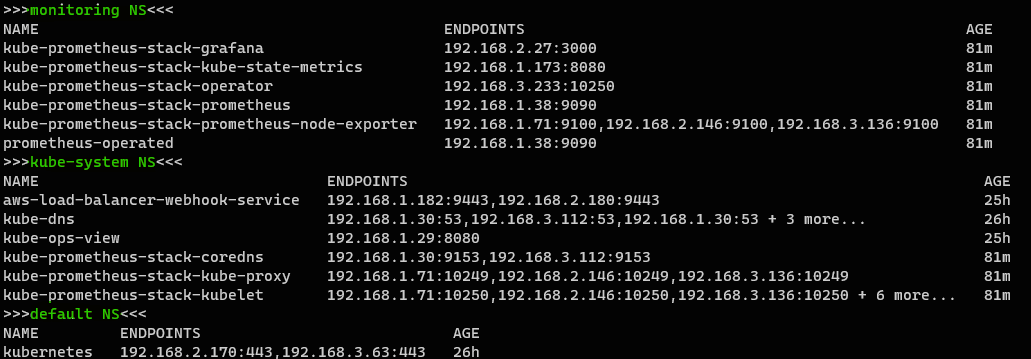
각 네임스페이스 별로 엔드포인트가 구성되어있는 것을 확인할 수 있다.즉, 프로메테우스🔥는 이러한 엔드포인트 주소를 통해서 /metrics를 수집할 수 있다.
단,
kubectl get servicemonitors -n monitoring모니터링 대상에 들어간 파드 및 엔드포인트만 가능하다.
일반적으로 엔드포인트 주소:9100/metrics URL 경로로 요청을 보내게 되면 수집된 메트릭 값을 확인할 수 있다.
프로메테우스 ingress 정보 확인
// 프로메테우스 ingress 정보 확인
kubectl get ingress -n monitoring kube-prometheus-stack-prometheus
프로메테우스 상단 메뉴
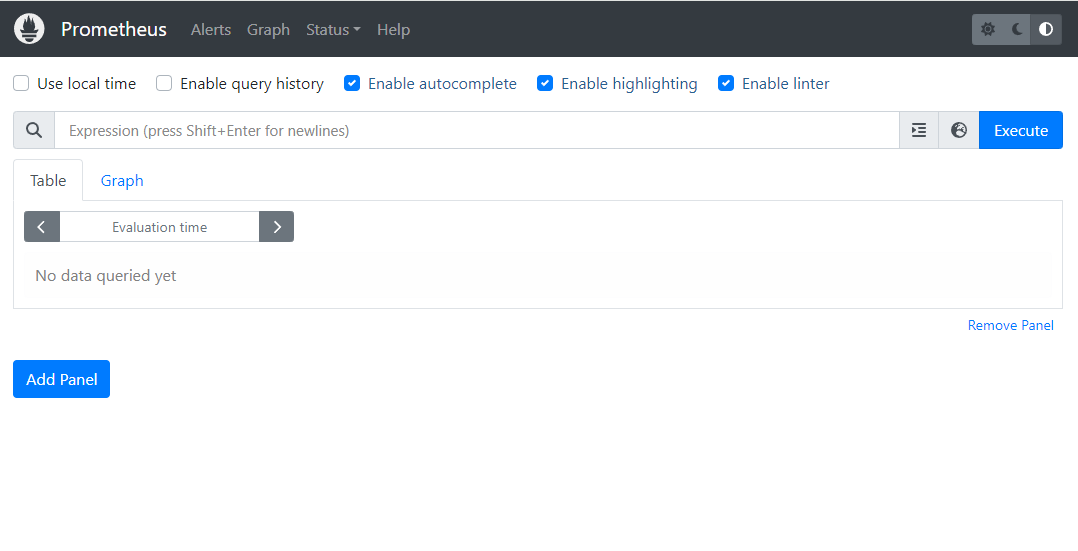
경고(Alert): 사전에 정의한 시스템 경고 정책(Prometheus Rules)에 대한 상황
그래프(Graph): 프로메테우스 자체 검색 언어PromQL을 이용하여 메트릭 정보를 조회하고 이를 그래프 형태로 확인
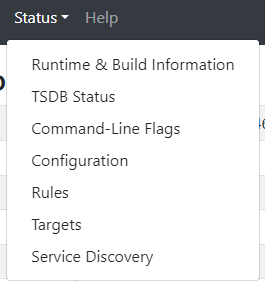
상태(Status): 경고 메시지 정책(Rules), 모니터링 대상(Targets) 등 다양한 프로메테우스 설정 내역을 확인
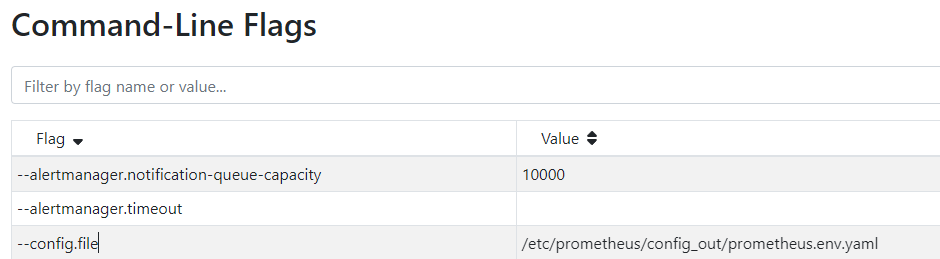
프로메테우스 설정 확인
프로메테우스 서버에 접속해서 해당 파일을 직접 확인해볼 수 있다.
// 프로메테우스 설정 파일 확인
kubectl exec -it -n monitoring sts/prometheus-kube-prometheus-stack-prometheus \
-- cat /etc/prometheus/config_out/prometheus.env.yaml
// 프로메테우스 설정에서 job_name 확인
kubectl exec -it -n monitoring sts/prometheus-kube-prometheus-stack-prometheus \
-- cat /etc/prometheus/config_out/prometheus.env.yaml | grep job_name:
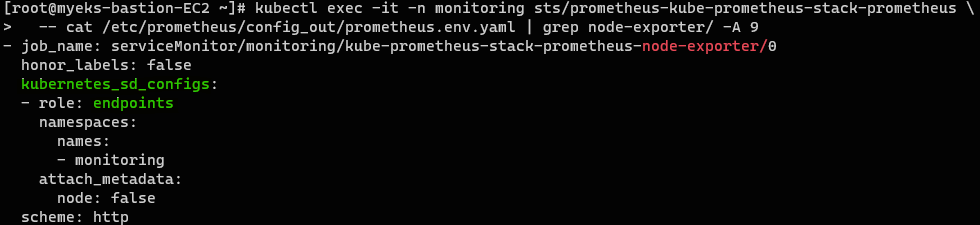
// 프로메테우스 설정에서 node-export 확인
kubectl exec -it -n monitoring sts/prometheus-kube-prometheus-stack-prometheus \
-- cat /etc/prometheus/config_out/prometheus.env.yaml | grep node-exporter/ -A 9
// 엔드포인트 확인
kubectl get ep -n monitoring; kubectl get ep -n kube-system서비스 디스커버리에서 엔드포인트로 통신이 되면 그 이후, 실제 모니터링 대상으로 지정된다.
즉, 서비스 모니터링 대상이 자동으로 생성된 것은 서비스 디스커버리로 엔드포인트와 통신을 통해서 갱신된 것이다.
ServiceMonitor 리소스가 자동으로 생성된 것이 아니라, 수집 대상으로 추가된 것!
노드 그룹의 보안 그룹 수정
// 보안 그룹 ID 지정
NGSGID=$(aws ec2 describe-security-groups --filters Name=group-name,Values='*ng1*' --query "SecurityGroups[*].[GroupId]" --output text)

// 작업용 인스턴스의 모든 트래픽 허용
aws ec2 authorize-security-group-ingress --group-id $NGSGID --protocol '-1' --cidr 192.168.1.100/32
Bastion 호스트에서 curl 요청을 보내기 위해 Bastion 호스트에서 보내는 모든 트래픽♒이 노드 보안그룹🧱을 뚫을 수 있도록 수정해준다.
PromQL 예시
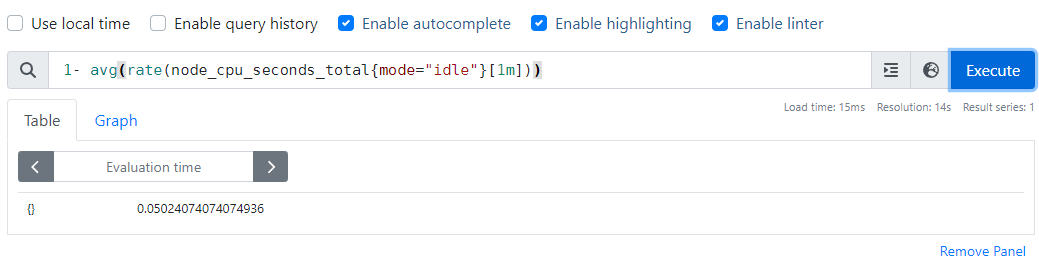
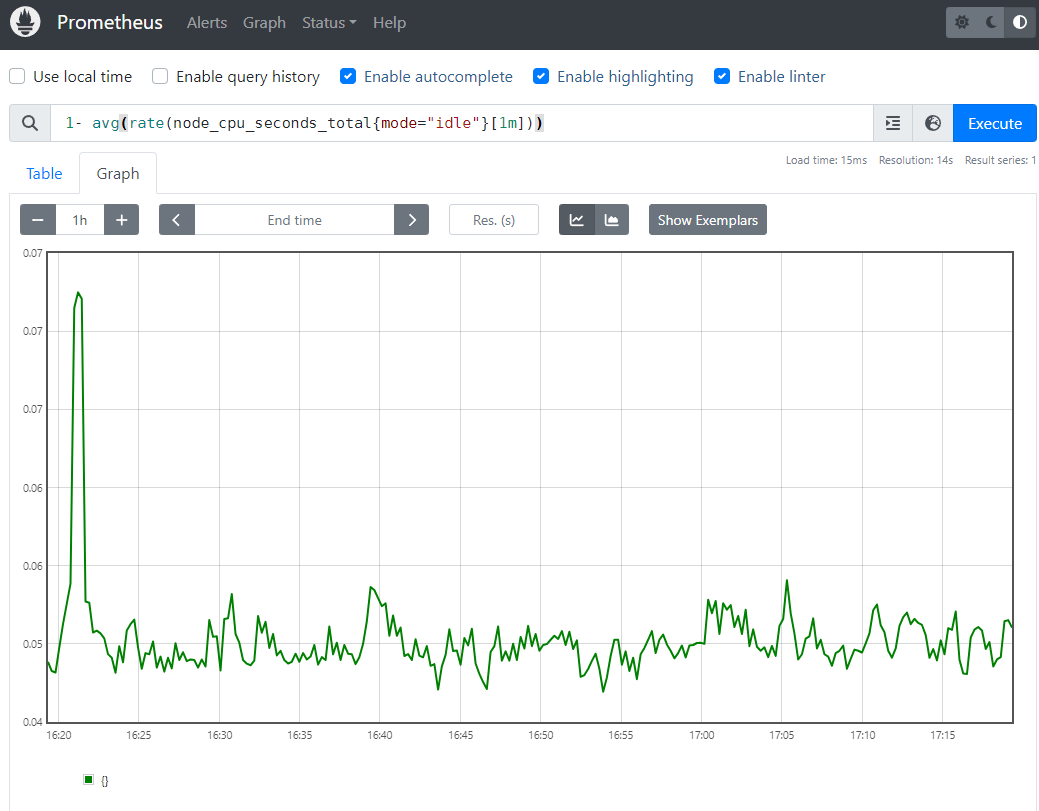
// 전체 클러스터 노드의 CPU 사용량의 1분간 평균
1- avg(rate(node_cpu_seconds_total{mode="idle"}[1m]))
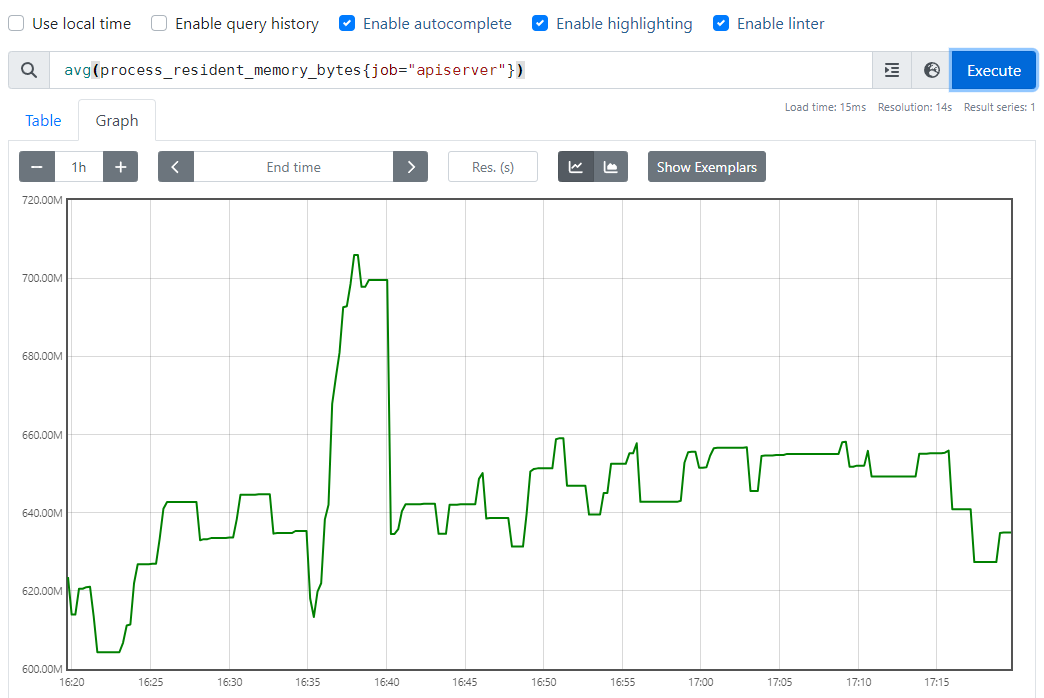
// api-server 상주 메모리 평균
avg(process_resident_memory_bytes{job="apiserver"})
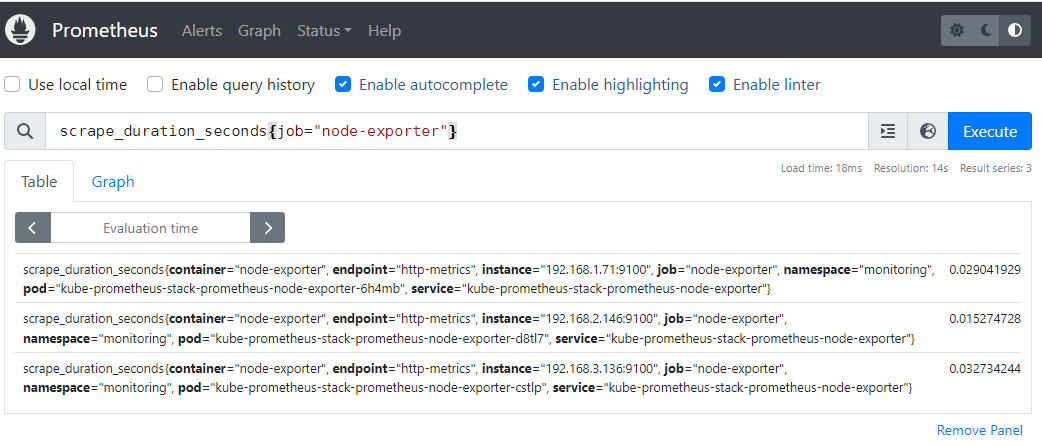
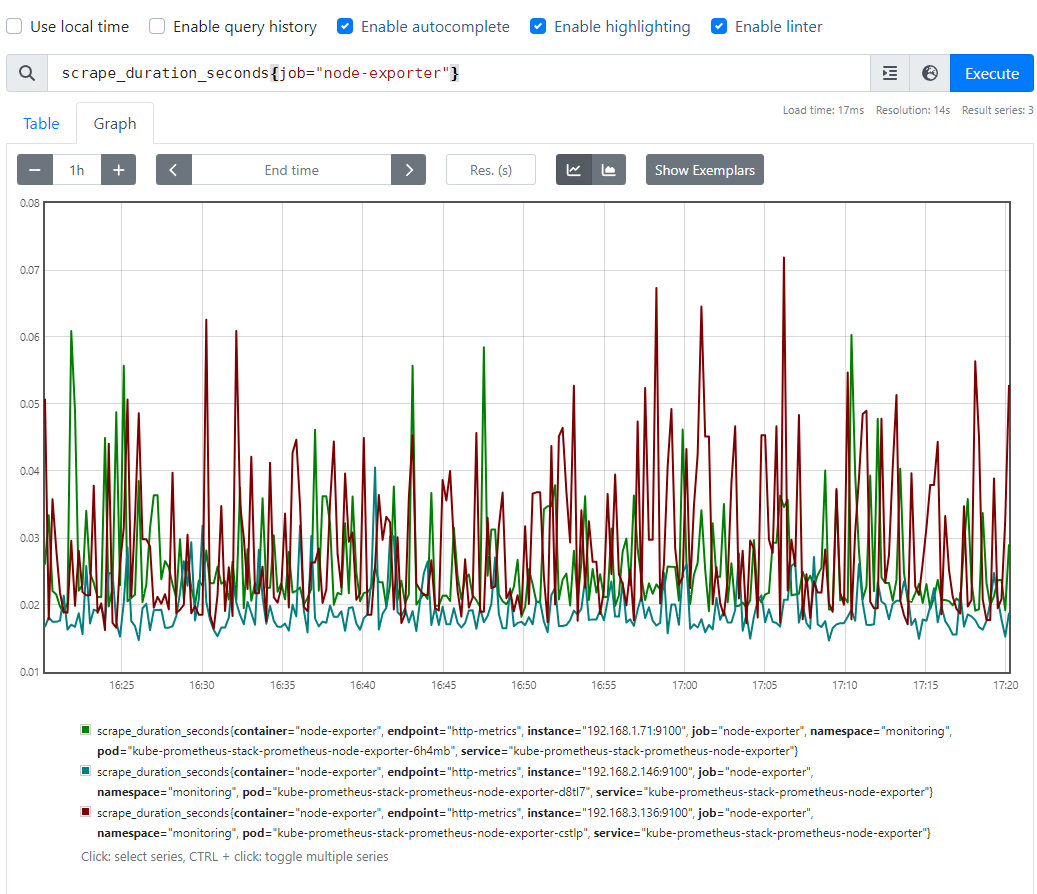
// node-export 스크랩 기간
scrape_duration_seconds{job="node-exporter"}-
전체 클러스터 노드의 CPU 사용량의 1분간 평균
-
api-server 상주 메모리 평균
-
node-export 스크랩 기간