저고도의 skew-t log-p 양식이 필요해 gtp도움을 받았다
950~1010hpa, 15~35도 skew_t-log_p 그래프 생성 후 png파일로 저장
skewt_logp.py
import matplotlib.pyplot as plt
import numpy as np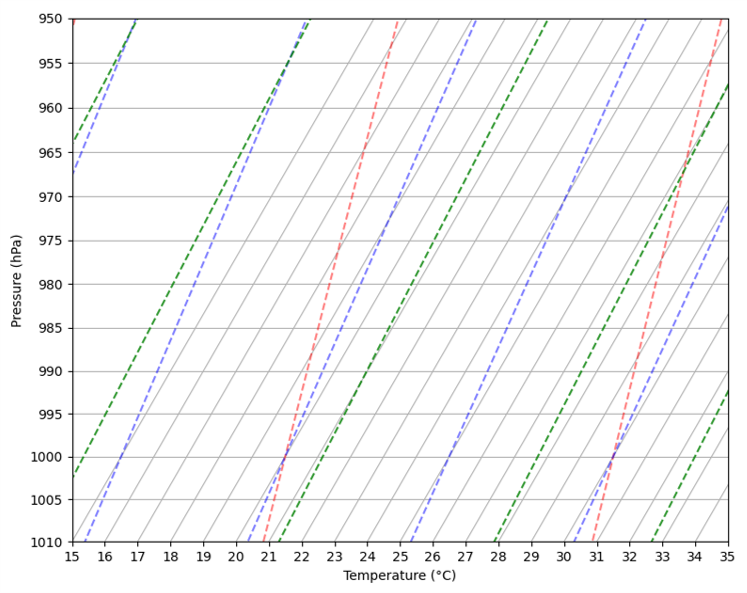
from metpy.plots import SkewT
from metpy.units import units
# Create a skew-T log-P diagram:
fig = plt.figure(figsize=(9, 18)) # Increase the vertical size of the figure
skew = SkewT(fig)
# Add lines for dry adiabats, moist adiabats, and mixing ratio:
skew.plot_dry_adiabats()
skew.plot_moist_adiabats()
skew.plot_mixing_lines()
# Set the pressure limits
skew.ax.set_ylim(1010, 950)
# Set the temperature limits
skew.ax.set_xlim(15, 35)
skew.ax.set_yticks(np.arange(950, 1010+1, 5))
skew.ax.set_xticks(np.arange(15, 35+1, 1))
# Set aspect for the plot to have the y-axis stretched
skew.ax.set_aspect(600) # Adjust the value as necessary to change the stretch of the y-axis
# Set the labels for the x and y axes
skew.ax.set_xlabel('Temperature (°C)') # Set the label for the x-axis
skew.ax.set_ylabel('Pressure (hPa)') # Set the label for the y-axis
plt.savefig('skew_t_log_p.png') # Save the figure as a PNG file
plt.show()