By default, cloudwatch cannot monitor memory.
So you need to install the cloudwatch agent on that instance to check it.
CloudWatch Agent를 별도로 설치하는 이유
AWS CloudWatch는 기본적으로 CPU Utilization 같이 호스트에서 감지할 수 있는 Metric을 측정할 수 있다. 다만, OS에서 관리하는 Metric에 대해서는 측정할 수 없다.
당연하다. 메모리와 디스크를 할당하는 주체는 최초 가용량을 할당해준 호스트가 아니라 OS이기 때문이다.
그래서 메모리 사용량, 디스크 사용량, CPU 사용량, 네트워크 인바운드/아웃바운드 크기 등 OS 내부에서 이루어지는 Metric을 측정하기 위해선 CloudWatch Agent 설치가 필수적이다.
출처 : https://dataportal.kr/71
First, you need to add an IAM role.
- add IAM Role (cloudwatchAgentServerPolicy)
- at instance add IAM role
0. in ec2 instance
cd /var1. agent setting (amazon linux based)
//agent downloads
sudo wget https://s3.amazonaws.com/amazoncloudwatch-agent/amazon_linux/amd64/latest/amazon-cloudwatch-agent.rpm

//agent install
sudo rpm -U ./amazon-cloudwatch-agent.rpm

//agent wizard run
sudo /opt/aws/amazon-cloudwatch-agent/bin/amazon-cloudwatch-agent-config-wizard
2. agent configuration setting (we will only check the memory, we do not check the log.)
================================================================
= Welcome to the Amazon CloudWatch Agent Configuration Manager =
=                                                              =
= CloudWatch Agent allows you to collect metrics and logs from =
= your host and send them to CloudWatch. Additional CloudWatch =
= charges may apply.                                           =
================================================================
On which OS are you planning to use the agent?
1. linux
2. windows
3. darwin
default choice: [1]:
1
Trying to fetch the default region based on ec2 metadata...
Are you using EC2 or On-Premises hosts?
1. EC2
2. On-Premises
default choice: [1]:
1
Which user are you planning to run the agent?
1. root
2. cwagent
3. others
default choice: [1]:
2
Do you want to turn on StatsD daemon?
1. yes
2. no
default choice: [1]:
2
Do you want to monitor metrics from CollectD? WARNING: CollectD must be installed or the Agent will fail to start
1. yes
2. no
default choice: [1]:
2
Do you want to monitor any host metrics? e.g. CPU, memory, etc.
1. yes
2. no
default choice: [1]:
1
Do you want to monitor cpu metrics per core?
1. yes
2. no
default choice: [1]:
1
Do you want to add ec2 dimensions (ImageId, InstanceId, InstanceType, AutoScalingGroupName) into all of your metrics if the info is available?
1. yes
2. no
default choice: [1]:
1
Do you want to aggregate ec2 dimensions (InstanceId)?
1. yes
2. no
default choice: [1]:

Would you like to collect your metrics at high resolution (sub-minute resolution)? This enables sub-minute resolution for all metrics, but you can customize for specific metrics in the output json file.
1. 1s
2. 10s
3. 30s
4. 60s
default choice: [4]:
4
Which default metrics config do you want?
1. Basic
2. Standard
3. Advanced
4. None
default choice: [1]:
3
Current config as follows:
{
	"agent": {
		"metrics_collection_interval": 60,
		"run_as_user": "cwagent"
	},
	"metrics": {
		"aggregation_dimensions": [
			[
				"InstanceId"
			]
		],
		"append_dimensions": {
			"AutoScalingGroupName": "${aws:AutoScalingGroupName}",
			"ImageId": "${aws:ImageId}",
			"InstanceId": "${aws:InstanceId}",
			"InstanceType": "${aws:InstanceType}"
		},
		"metrics_collected": {
			"cpu": {
				"measurement": [
					"cpu_usage_idle",
					"cpu_usage_iowait",
					"cpu_usage_user",
					"cpu_usage_system"
				],
				"metrics_collection_interval": 60,
				"resources": [
					"*"
				],
				"totalcpu": false
			},
			"disk": {
				"measurement": [
					"used_percent",
					"inodes_free"
				],
				"metrics_collection_interval": 60,
				"resources": [
					"*"
				]
			},
			"diskio": {
				"measurement": [
					"io_time",
					"write_bytes",
					"read_bytes",
					"writes",
					"reads"
				],
				"metrics_collection_interval": 60,
				"resources": [
					"*"
				]
			},
			"mem": {
				"measurement": [
					"mem_used_percent"
				],
				"metrics_collection_interval": 60
			},
			"netstat": {
				"measurement": [
					"tcp_established",
					"tcp_time_wait"
				],
				"metrics_collection_interval": 60
			},
			"swap": {
				"measurement": [
					"swap_used_percent"
				],
				"metrics_collection_interval": 60
			}
		}
	}
}
Are you satisfied with the above config? Note: it can be manually customized after the wizard completes to add additional items.
1. yes
2. no
default choice: [1]:
1
Do you have any existing CloudWatch Log Agent (http://docs.aws.amazon.com/AmazonCloudWatch/latest/logs/AgentReference.html) configuration file to import for migration?
1. yes
2. no
default choice: [2]:
2
Do you want to monitor any log files?
1. yes
2. no
default choice: [1]:
2
Saved config file to /opt/aws/amazon-cloudwatch-agent/bin/config.json successfully.
Current config as follows:
{
	"agent": {
		"metrics_collection_interval": 60,
		"run_as_user": "cwagent"
	},
	"metrics": {
		"aggregation_dimensions": [
			[
				"InstanceId"
			]
		],
		"append_dimensions": {
			"AutoScalingGroupName": "${aws:AutoScalingGroupName}",
			"ImageId": "${aws:ImageId}",
			"InstanceId": "${aws:InstanceId}",
			"InstanceType": "${aws:InstanceType}"
		},
		"metrics_collected": {
			"cpu": {
				"measurement": [
					"cpu_usage_idle",
					"cpu_usage_iowait",
					"cpu_usage_user",
					"cpu_usage_system"
				],
				"metrics_collection_interval": 60,
				"resources": [
					"*"
				],
				"totalcpu": false
			},
			"disk": {
				"measurement": [
					"used_percent",
					"inodes_free"
				],
				"metrics_collection_interval": 60,
				"resources": [
					"*"
				]
			},
			"diskio": {
				"measurement": [
					"io_time",
					"write_bytes",
					"read_bytes",
					"writes",
					"reads"
				],
				"metrics_collection_interval": 60,
				"resources": [
					"*"
				]
			},
			"mem": {
				"measurement": [
					"mem_used_percent"
				],
				"metrics_collection_interval": 60
			},
			"netstat": {
				"measurement": [
					"tcp_established",
					"tcp_time_wait"
				],
				"metrics_collection_interval": 60
			},
			"swap": {
				"measurement": [
					"swap_used_percent"
				],
				"metrics_collection_interval": 60
			}
		}
	}
}
Please check the above content of the config.
The config file is also located at /opt/aws/amazon-cloudwatch-agent/bin/config.json.
Edit it manually if needed.
Do you want to store the config in the SSM parameter store?
1. yes
2. no
default choice: [1]:
2
Program exits now.
3. config file check and agent daemon run
cd /opt/aws/amazon-cloudwatch-agent/bin/

more config.json
4. Read the json file set by wizard
sudo ./amazon-cloudwatch-agent-ctl -a fetch-config -m ec2 file://opt/aws/amazon-cloudwatch-agent/bin/config.json -s5. check agent status and agent start
sudo /opt/aws/amazon-cloudwatch-agent/bin/amazon-cloudwatch-agent-ctl -m ec2 -a status

sudo /opt/aws/amazon-cloudwatch-agent/bin/amazon-cloudwatch-agent-ctl -m ec2 -a start

sudo /opt/aws/amazon-cloudwatch-agent/bin/amazon-cloudwatch-agent-ctl -m ec2 -a status
6. check error log
cd /opt/aws/amazon-cloudwatch-agent/logs
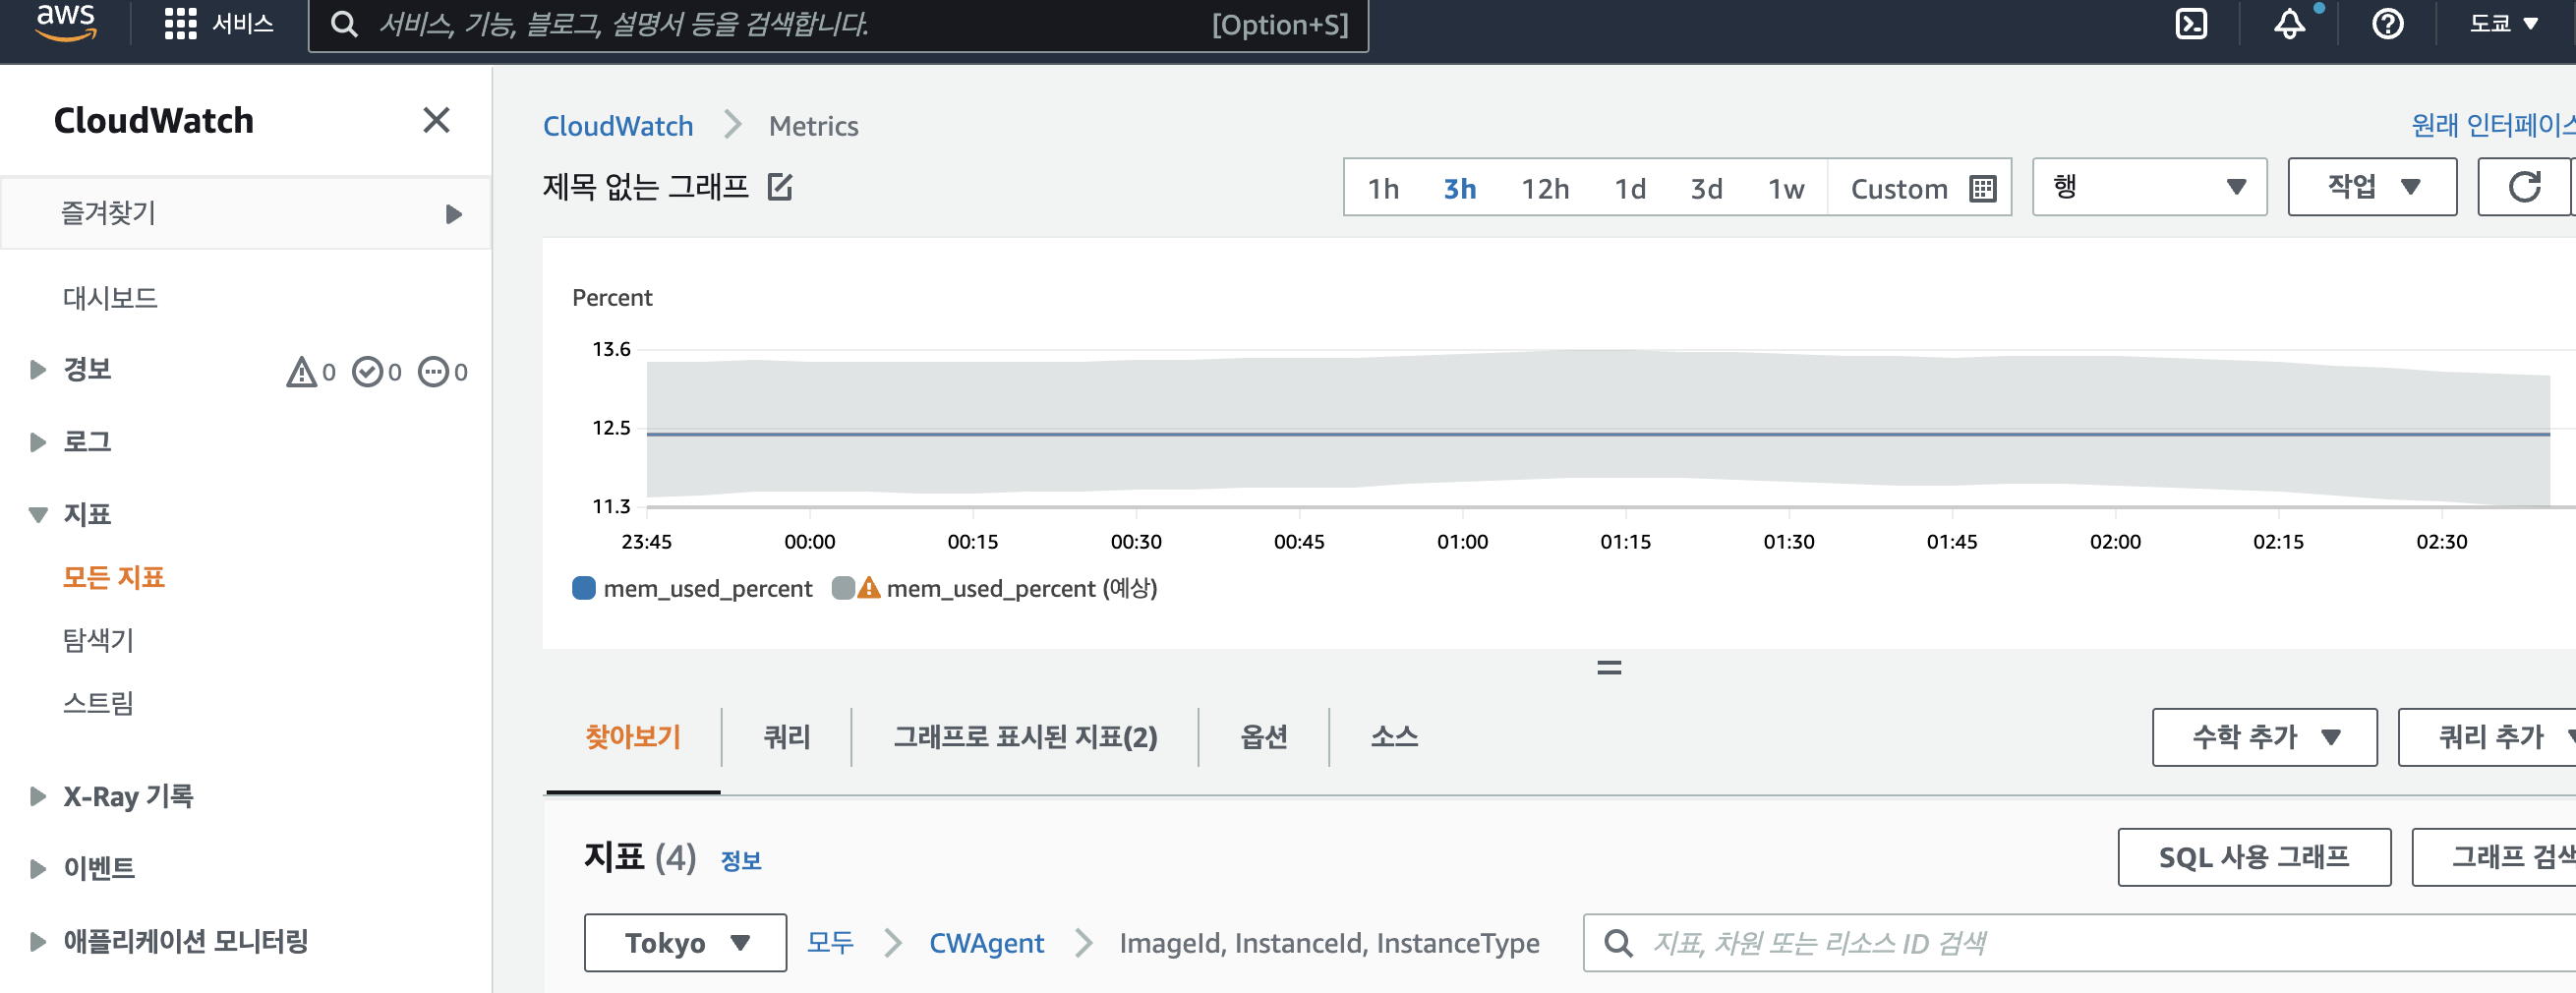
more amazon-cloudwatch-agent.log7. check aws cloudwatch metrics

안녕하세요 Cloudwatch agent 설치 과정 상세히 알려주셔서 감사합니다.
Cloudwatch agent 삭제를 하여도 Cloudwatch Metric 에서 항목을 찾을 수가 있던데, 그러한 이유가 무엇인지 알 수 있을까요?
Cloudwatch agent 설치된 인스턴스를 제거하였음에 불구하고 Cloudwatch Metric 에서 항목이 표시가 됩니다..